
 ?Mathematical formulae have been encoded as MathML and are displayed in this HTML version using MathJax in order to improve their display. Uncheck the box to turn MathJax off. This feature requires Javascript. Click on a formula to zoom.
Abstract
The main goal of this study is to show that the association between university entrance score and first-year students’ academic performance varies randomly across courses after controlling for students’ sociodemographic, schooling trajectory and motivational variables. The sample consists of 2697 first-year students who were enrolled in 54 courses at a Portuguese public university in 2015/16. Multilevel modelling of academic performance suggests that 34% of variability in grade point average is due to differences among courses and that 80% of such variability is explained by the field of study, whether the university is the student’s first choice, and the student’s gender, age and parents’ level of education. In addition, the results corroborate that the university entrance score is the strongest predictor of first-year academic performance.
Introduction
Portuguese higher education is organised as a binary system, with university education oriented toward the provision of solid academic training, combining the efforts and responsibilities of both teaching and research units, while polytechnic education concentrates on vocational and advanced technical training that are professionally oriented (Assembleia da República Citation2007). From 1971 to 2011, the number of students enrolled in higher education increased by 700%, from 49,461 to 396,268. Dias (Citation2015) presented a detailed analysis of official statistics to investigate how this strong increase was achieved and raised the question of whether such an increase (‘massification’) led to greater equity in terms not only of access but also of success in higher education. This growth implied an increase in the heterogeneity of the student population in terms of gender, socioeconomic level, age group and past academic trajectories. There is a broad consensus on the need for universities to promote students’ success, since many do not achieve their goals or fully realise their potential during their university experience, thus wasting talent and human potential. The rates of failure and abandonment have increased in recent years in Portugal, leading to questions regarding how institutions can support student retention (Dias et al. Citation2011; Ferreira, Vidal, and Vieira Citation2014).
Access to higher education in Portugal is organised by a system of numerus clausus defined as a national public tender to give priority of admission to students with higher admission scores – according to official statistics, in 2015/16 approximately 50% of students were placed in their first option for course and institution. Portela et al. (Citation2008) suggested that students implicitly rank courses and institutions when making their choices, reinforcing the need to quantify the effect of first-option admission on students’ individual performance in undergraduate courses. The interaction between student and university starts when the student chooses the university and course s/he intends to attend. For instance, Almeida et al. (Citation2006, 512) explored students’ sociodemographic characteristics related to the choice of courses at the University of Minho (a public university in northern Portugal), and concluded that students from less advantaged social classes were more likely to enrol in social sciences courses and that ‘higher sociocultural status and female students had higher entrance exam scores and averaged better academic achievement at the end of their first year at the university’.
Several authors noted that students’ socioeconomic and cultural capital are associated with the preference for more prestigious courses or institutions (e.g. Tavares et al. Citation2008; Tavares and Ferreira Citation2012). According to Tavares et al. (Citation2008), students from disadvantaged family backgrounds have stronger preferences for courses related to teacher training and management, while students from advantaged family backgrounds are more likely to choose courses in the areas of law, fine arts, health and science. Considering, for example, the health sector, the authors found that the parents of 73.2% of students who were attending a university course in medicine hold higher education degrees, while 73.0% of the students enrolled in a health care course at a polytechnic institute came from families with no higher education degrees. Such findings focus the equity debate on the transition from high school to higher education and on the rules regarding access to public higher education, since the evidence appears to support the idea of strong socioeconomic selectivity during the process of students’ admission to higher education.
Several studies suggested the relevance of a student’s high school achievement or university entrance score as predictors of academic performance in higher education (McKenzie and Schweitzer Citation2001; Almeida Citation2002; Soares et al. Citation2009; Johnston et al. Citation2016) and as predictors of academic, social and institutional adjustment (Páramo Fernández et al. Citation2017). Nonetheless, McKenzie and Schweitzer (Citation2001, 29) mentioned that ‘university entry scores need to be interpreted with caution, as they explain less than half of the variance in GPA’. Vulperhorst et al. (Citation2018) compared the predictive validity of high school scores on academic success in university between the Dutch pre-university (314 graduates) and the International Baccalaureate (n = 113 graduates) diploma. According to the authors, the most valid high school score to be used for selection procedures in higher education remains unclear, and it seems to depend on the diploma students enter with.
Although several studies have examined these issues around the world, little is known about how university/course choice mediate the influence of prior achievement on academic performance in the context of higher education in Portugal. To our knowledge, this relationship has not been analysed in the literature as a differential effect that is dependent on the course. Therefore, this work has three main objectives: (1) to quantify the effect of first-option admission (to the course or the university) on students’ academic performance, controlling for sociodemographic variables and admission score; (2) to estimate the variability of students’ academic performance at the end of the first year by the hierarchical levels of student and course and (3) to estimate the effect of students’ admission scores on their academic performance, controlling for sociodemographic and schooling trajectory variables (sex, age, socioeconomic status and failure in primary or secondary education) and quantifying the amount of the effect due to differences among students and differences across courses.
The relationship between students’ performance in high school and in college
International research shows that tests for university admission, such as the Scholastic Aptitude Test (SAT) or American College Testing (ACT), or high school grade point average (GPA), are assumed to be the best predictors of students’ academic performance in higher education (Baron and Norman Citation1992). Those three predictors taken together can account for 25% or more of the variance in the mean scores during the first year (Mouw and Khanna Citation1993; Robbins et al. Citation2004). Other variables related to students’ personality (O’Connor and Paunonen Citation2007; Poropat Citation2009), motivation (Eccles and Wigfield Citation2002; Pintrich Citation2004) and methods of study are also important (Diseth et al. Citation2010), but the meta-analysis performed by Richardson, Abraham, and Bond (Citation2012) with all these variables confirms the higher predictive capacity of the SAT, ACT and high school GPA.
Pike and Saupe (Citation2002) analysed data for 8674 first-time college students from 124 high schools who enrolled at a midwestern USA university between 1996 and 1999 and considered the students’ first-year GPA as a dependent variable. They also included in the analysis the ACT score as part of the university’s admission policy, high school class percentile rank, and a binary variable representing whether the student had or had not met new core course requirements implemented in 1997. Their results show a significant positive relationship between having met the new core course requirements and first-year GPA, providing evidence of the appropriateness of the new admission requirements for students to succeed in higher education. Regarding the effect of the ACT assessment composite score and high school class percentile rank on GPA, both coefficients were positive and statistically significant.
Fuller, Wilson, and Tobin (Citation2011) explore to what extent the cross-sectional and longitudinal National Survey of Student Engagement (NSSE) scores predict a college student’s final GPA. Their models include ACT scores and high school GPA as indicators of incoming students’ precollege abilities. Based on longitudinal data modelling, the authors conclude that 27.8% of the variance explained could be attributed to the precollege academic indicators. McKenzie and Schweitzer (Citation2001) conducted an investigation of the relationship between academic, psychosocial, cognitive and demographic factors and students’ academic performance, assessed by a student’s classification at the end of the first term in college. The authors suggested that as university entrance scores are moderately correlated with a high GPA, entry to courses with a high level of difficulty should be established at a realistic level to avoid undue problems for students with lower university entrance scores. The literature also shows that students’ performance over the first year tends to determine their performance in the following academic years (Berg and Hofman Citation2005; Yorke and Longden Citation2007).
Differentials of academic performance by area of study
Masui et al. (Citation2014) aimed to clarify the role of study time in academic performance by examining its capacity in the prediction of course grades, beyond relevant student characteristics (e.g. prior domain knowledge, prior study delay) and evaluating the predictive role of course characteristics in study time investment. The study was based on a sample of 168 (out of 196) freshmen in business economics at Hasselt University. According to the authors, their findings emphasise the relevance for future research of examining relationships at the course level, since the influence of students’ prior knowledge and skills on their academic performance seems to depend on their match or mismatch with the course requirements. They suggested that studies on the topic should take into account the field of study because differential grading induces the mismeasurement of academic performance.
In line with this view, Beenstock and Feldman (Citation2016) applied regression models to longitudinal data gathered between 2003 and 2008 from 1217 social sciences students (majoring in psychology, sociology, political science, international relations, statistics, economics, business studies, accounting, communications, politics, philosophy, economics and geography) at the Hebrew University of Jerusalem with the purpose of decomposing course grades into the rewards to student ability at the university and the rewards to instructor quality. The authors reported a correlation of 0.41 between a student’s high school ability and his/her performance at the university and showed that there were grade differentials that were probably established by policies determined at the departmental level. Their findings suggested that students majoring in economics obtained higher grades in non-economics courses after controlling for students’ high school ability.
Considering data from algebra courses at a large community college in California, Chingos (Citation2016) applied regression models to the longitudinal data of 8654 students collected from 2008 to 2011 with the objective of examining to what extent student learning varies across different sections. The author found that student learning varies systematically across instructors, who appeared to influence student learning beyond their impact on course completion rates.
In general, students with higher socioeconomic status and women have higher levels of academic performance as shown by GPA (Smith and Naylor Citation2001; Laforge Citation2003; Robbins et al. Citation2004; Dennis, Phinney, and Chuateco Citation2005; Voyer and Voyer Citation2014), as these socioeconomic factors are present in the explanation of variance in predictors (SAT, ACT or high school GPA) as well as in the average classifications during the first year of college (Sackett et al. Citation2009). Regarding students’ age, in some studies, older students show a slight superiority in academic performance (Clifton Citation1997), but in other studies, the youngest students perform better (Farsides and Woodfield Citation2007). In a meta-analysis by Richardson, Abraham, and Bond (Citation2012), the correlations between GPA and socioeconomic background, gender and age suggested that students from higher socioeconomic status, female students and older students obtained higher GPA. In spite of being statistically significant, the effect size estimates were small.
This study sought to answer the following research questions: Q1. Does the university or course choice matter for the student’s academic performance? Q2. How much is the variance of first-year students’ academic performance due to the variability across courses? Q3. Is there any evidence that students’ university entrance score is predictive of the first-year academic performance? Q4. Does the relationship between university entrance score and first-year academic performance vary across courses? Q5. How great are the differences in grading among the areas of study? Thus, the first and second research questions are linked respectively to the first and second research objectives, while the remaining research questions are related to the third objective.
We are confronted with hierarchically structured data in which students are nested within courses. According to some authors (e.g. Pike and Rocconi Citation2012) much of the research in higher education has failed to properly account for the hierarchical nature of the data. However, multilevel modelling has become increasingly popular, as Wells et al. (Citation2015) showed. Multilevel models (Bryk and Raudenbush Citation1992; Goldstein Citation2003) allow us to simultaneously consider multiple levels of effects, as many as the hierarchical structure includes. To obtain empirical evidence to answer our research questions, we used two types of multilevel models: the variance component model (VCM) and the random coefficients model (RCM).
Participants, variables and procedures
The sample consists of 2697 first-year students who were enrolled in undergraduate studies at the University of Minho in the academic year 2015/16, the same year that it became a public foundation under private law (article 129 of the Legal regime for higher education institution, RJIES). The University of Minho is located in the North of Portugal and offers graduation courses and postgraduate, including masters and doctorate degrees, for around 20,000 students in all fields of study. Data used for the purpose of this paper concern the following student attributes: academic performance measured by the average score (GPA) at the end of the first year; university entrance score; first-option admission (yes/no) to the institution and the undergraduate course; gender; age; schooling trajectory assessed by the early experience of repetition (yes/no); and parents’ education as proxy for the student’s socioeconomic status. The area of the course was also included as an explanatory variable.
Most of the students (57%) were female and were enrolled in their first-choice course (59%) and first-choice higher education institution (72%). Almost half of the students (47%) were registered in a science, technology, engineering and mathematics (STEM) course; 17% in economics, management or public administration; 13% in humanities, 10% in social sciences; 8% in health (medicine or nursing) and 5% in law. The students’ ages ranged from 16 to 61 years, with an average of 18.9 (SD 3.6), and 91.9% were full-time students. The average university entrance score was 152.4 (SD 18.9). Most of the students (83.3%) declared that they had never repeated a year along their schooling trajectory, and 13.9% declared at least one repetition. The distribution of students by parents’ education shows that 34.4% of their fathers and mothers had no more than a lower secondary education, and for 15.7%, both parents had a higher education degree. The academic performance data were available for 72% of the students, which is 1940. The remaining cases (28%) were attributable mainly to student dropout and transfers to other undergraduate courses, departments or institutions.
The descriptive statistics for the subset of students without an academic score at the end of the first year showed that they are older, more likely to have repeated a year during primary or secondary education, and had a lower university entrance score than the students who composed the full sample. The university entrance score is missing for 6% of students, the majority of whom got special access to higher education (Ministério da Educação e Ciência Citation2014). Such students could be immigrants or older than 23. In addition, there are no more than 4% of missing data in the remaining variables, which we consider to occur completely at random (Little and Rubin Citation2002). Students were informed about the objectives of the study and gave their written agreement, which included the possibility of accessing their classifications (GPA) at the end of the first semester and at the end of the first year (second semester). The remaining data were collected at the moment of enrolment in the university. For statistical modelling, we decided to standardise the variables GPA and university entrance score; thus, the results are interpreted in terms of standard deviations from the mean.
Statistical modelling
We applied multilevel (Goldstein Citation2003) or hierarchical (Bryk and Raudenbush Citation1992) models, specifically the Variance Components Model (VCM) and the Random Coefficient Model (RCM), since they have several advantages when the data are hierarchically structured, as is the population in the study. That is, students are grouped in undergraduate courses, so two-level models are applied, with students (indexed by i) at level 1 and courses (indexed by j) at level 2. The advantages of this class of models include the ability to model differential effects and to improve the efficiency of the estimators, i.e. with narrower confidence intervals and shrunken estimators, which are more efficient, especially when the group size is small or there is a large within-group to between-group variance ratio (Longford Citation1993; Ray, McCormack, and Evans Citation2009).
For each student i in undergraduate course j, Y represents the first-year academic performance measured by the student’s average score (GPA) obtained at the end of the academic year, and the observed scores are , where
, with nj representing the number of students in course j and J representing the total number of undergraduate courses offered. The event Y is assumed to follow a normal distribution with mean XB and variance
, i.e.
, where XB is the additive linear predictor or deterministic component of the model; X is the matrix of independent variables described above; B is the vector of fixed parameters; and
is the variance-covariance matrix, which includes the random parameters of the model.
The two-level VCM to address objective 1 is written as follows:
(1.1)
(1.1)
(1.2)
(1.2)
EquationEquation (1.1)(1.1)
(1.1) is defined at level 1 and consists of the linear predictor and the level 1 random component (
, and EquationEquation (1.2)
(1.2)
(1.2) is defined at level 2, with the term of intercept (
and the level 2 random component (
. The fixed parameters of the model are
, where p denotes the number of covariates. The probability distribution assumptions for the random components are
and
, respectively. That is,
is the random parameter at level 1 (the level 1 variance) and
is the random parameter at level 2 (the level 2 variance). According to the model defined by EquationEquations (1.1)
(1.1)
(1.1) and Equation(1.2)
(1.2)
(1.2) and by the assumptions, the intercept of the model varies randomly across programmes (level 2 units).
We used this model to analyse the relationship between academic performance and the student’s set of background covariates. Specifically, we were interested in understanding the relationship between the dependent variable and the student’s sociodemographic characteristics, such as gender, family sociodemographic and economic background, schooling trajectory assessed by the experience of retention, and score on tests for access to higher education. We also wanted to determine the amount of academic performance variance explained by the background variables and how much is due to the undergraduate programme. For this purpose, we compared the estimates of the random components obtained from the full model with those obtained from the null model. Two statistics are used for that purpose: the coefficient of determination and the variance partition coefficient (Goldstein, Browne, and Rasbash Citation2002).
The two-level RCM is defined by EquationEquations (2.1)–(2.3), meaning that the linear relation between university entrance score and academic performance () varies randomly across courses:
(2.1)
(2.1)
(2.2)
(2.2)
(2.3)
(2.3)
.
The probability distribution assumptions for the random components are now
This model includes two additional random parameters for level 2. The variance quantifies the variability of
across courses, and
quantifies the respective covariance between the intercept and
.
The empirical evidence for question Q1 (Does the university or course choice matter for the student’s academic performance?) is provided by a RCM; for question Q2 (How much is the variance of first-year students’ academic performance due to the variability across courses?) is provided by a VPC; for question Q3 (Is there any evidence that students’ university entrance score is predictive of the first-year academic performance?) either by VPC or RCM; and for questions Q4 (Does the relationship between university entrance score and first-year academic performance vary across courses?) and Q5 (How great are the differences in grading among the areas of study?) the evidence is based on a RCM.
We used the iterative generalised least squares (IGLS) algorithm as an estimation procedure implemented in MLwiN (Rasbash et al. Citation2014). In addition, the variance partition coefficient (Goldstein, Browne, and Rasbash Citation2002) was applied to quantify the amount of variance distributed by each hierarchical level.
Results
and present the estimates of the fixed and random parameters for the VCM and RCM, respectively. Asterisks are used to identify statistically significant effects based on a critical t value of ±1.96, i.e. a level of significance of 5%, and double asterisks when the critical t value is ±1.65, i.e. a level of significance of 10%. The variance partition coefficient applied to the null model parameter estimates () shows that the variability of GPA decomposes 34% across courses and 66% among students or within course. Such estimates allow us to provide empirical evidence that supports objective 2 and research question Q2. The column M1 in contains the estimates for university entrance score as a unique covariate, and M2 includes sociodemographic variables (sex, age and socioeconomic status), school trajectory (failure in primary or secondary education) as well. The column M3 in adds the random coefficient parameters keeping the M2 set of explanatory variables, and M4 includes also the covariates related to university and programme choice, and areas of study. Thus, objective 1 and research question Q1 is addressed by the results obtained from model M4 and the final model (); empirical evidence that supports the research questions underlying objective 3 is provided by all fitted models.
Table 1. Parameter estimates for variance component models.
Table 2. Parameter estimates for random coefficients models.
Both models produced estimates for fixed coefficient and standard error, indicating that there is a positive statistically significant relationship between GPA and university entrance score (b1 = 0.55; se =0.03). The coefficient of determination (R2) indicates that the university entrance score explains 25% of the GPA total variance, and, focussing on level 2, 42% of the variability of GPA across courses. The results for model M2 show that after controlling for sociodemographic variables and schooling trajectory, the marginal effect of university entrance score on GPA remains stable (b1 = 0.55), and the total variance explained increases to 28% (3 more percentage points than before) and increases to 47% at level 2 (5 more percentage points than before). The results also suggest that a student’s GPA is related to gender, the student’s age, and the parents’ level of education. When the influence of university entrance score on GPA is compared to the influence of socioeconomic variables, either the variance explained or the estimates for the fixed parameters indicate that the university entrance score has a stronger influence.
M3 adds to the previous findings by allowing the university entrance score coefficient to vary across courses. The change in the –2 log-likelihood value, which is also the change in deviance, has a chi-square distribution on 2 degrees of freedom under the null hypothesis that the extra two random parameters (variance and covariance) have population values of zero. The deviance is 20.365 (p value <0.001). Thus, the statistically significant random effect indicates that the relationship between GPA and university entrance score varies randomly across courses, i.e. the linear relation is stronger or weaker depending on the course.
The results for M4 suggest that the first-choice university and area of study are relevant variables in the GPA analysis. At the level of significance of 5%, our results do not show a statistically significant effect of first-choice course on GPA unless the variable first-choice university is excluded from the model. In such a situation, the effect seems to be due to the omitted variable, meaning a spurious relationship between the variables. However, the fixed parameter is statistically different from zero at the level of 10%.
Regarding the area of study, on average, students enrolled in humanities, health or law courses have a significantly different GPA than their colleagues who enrol in any STEM, economics and social sciences course. According to our estimates, grading in humanities or health is higher than in STEM courses, and in law courses grading is lower. In economics or social sciences, it is not possible to say whether, on average, grading is significantly different than in STEM courses. For that reason, in the final model, the baseline for areas of study comprises the STEM courses, economics, management, public administration and social sciences.
The estimates for the interaction terms between area of study and university entrance score suggest a statistically significant term for humanities course with negative estimate, meaning that the humanities students with higher entrance score have their GPA considerably reduced, having added the principal terms related to university entrance score and the dummy term for humanities. Such interaction represents the narrowing in the dispersion of classifications that occurs with greater incidence in the humanities courses.
The final model includes all explanatory variables that coefficients revealed to be statistically significant in models M1, M2 and M3. The coefficient of determination applied to the final model variances indicates that, on average, the model explains 42% of the GPA total variance; focussing on level 2, it explains 82% of the GPA variability across courses and 21% of the GPA variability at the student level.
The estimates obtained confirm the interpretations presented; that is, there is evidence in favour of an effect of first-option admission to the university on students’ academic performance, controlling for sociodemographic variables and admission score. Those students for whom the University of Minho was their first choice have their GPA increased by 0.141 standard deviations on average compared to their colleagues. The results do not provide enough evidence, at the level of significance of 5%, to allow us to say that the first-choice course influences students’ GPA.
According to the model, male students have their GPA reduced by 0.126 standard deviations, and students whose parents both have no more than a lower secondary education (i.e. a lower level of education) have their GPA increased by 0.135, on average, compared to their colleagues whose parents have any other level of education.
The final model replicates what shows for the relationship between a student’s entrance score and their GPA, that is, the differential effect between the two variables is represented by one line fitted for each course. It can be observed that the positive relationship between the variables is stronger or weaker depending on the course and, in general, for negative values of student’s entrance score the course lines dispersion is greater than for positive values. This phenomenon is quantified by the covariance between the intercept and university entrance score slope, which has a negative estimate. Consequently, the respective correlation is approximately –0.4, suggesting that at the course level, the higher the GPA intercept, the lower the coefficient between university entrance score and GPA.
Figure 1. Graph based on final model estimates.
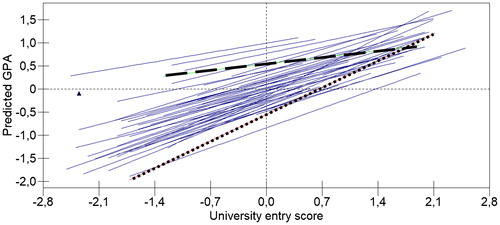
This correlation can be observed in the graph (). As an example, two course lines were highlighted with dashed and dotted lines. The dashed line presents a higher intercept (average GPA) and lower slope (effect of university entrance score on GPA), while the dotted line shows a lower intercept and higher slope. The slope for the dotted line course is higher than the slope for the dashed line course, suggesting a stronger effect on GPA for the dotted course than for the dashed. We need more research on this topic to explore in detail the influence of the curricular prerequisites on the slope of the lines, that is, for the explanation of the degree of the effect of the university entrance score on students’ academic success.
Discussion and conclusion
In this study, we applied VCMs and RCMs to data collected from 1940 Portuguese first-year students enrolled at a public university in 2015/16, considering first-year GPA as a dependent variable. The partitioning of the first-year GPA variance suggests that 66% is accounted for at the student level and 34% at the course level. Part of this variability is due to the differences in the mean of the classification by scientific area of study. When STEM courses were considered as a baseline, it was verified that, on average, the GPA is not different from that in courses in economics and social sciences. However, courses in the humanities and health areas have a statistically higher mean GPA than STEM courses, and law courses tend to present a statistically lower mean GPA than STEM courses. These findings appear to be in concordance with those of Masui et al. (Citation2014), who demonstrated differential grading by field of study, and support the idea that differential grading is possibly induced by departmental norms (Beenstock and Feldman Citation2016).
The estimates obtained suggest that the relationship between university entrance score and GPA at the end of the first year is on average 0.567 per standard deviation and varies randomly across courses after controlling for sociodemographic variables (gender, parents’ education), area of study, and whether it was the first-choice university. The magnitude of the fixed parameter estimate is larger when compared to other marginal effects included in the linear predictor. In addition, the model explains 42% of the GPA variability and 82% at level 2; i.e. it explains 82% of the GPA variability across courses and 21% of the GPA variability at the student level. Our findings corroborate the literature on the predictive power of prior achievement. For instance, Fuller, Wilson, and Tobin (Citation2011) reported that 27.8% of the variance explained was attributable to the precollege indicators. Moreover, our findings suggest that some courses establish stronger conditions for prior knowledge prerequisites than others, with implications for curriculum development. This evidence supports the theoretical model proposed by Alarcão (Citation2000), granting to curriculum a status similar to that granted to the student, teacher or institution.
Our findings also suggest that those students for whom the University of Minho was not their first choice have a lower GPA. The results do not provide evidence at the level of significance of 5% to allow us to say that the first-choice course matters in their academic performance. However, according to the results obtained by Ferrão and Almeida (Citation2018), the admission of the student to their first option programme is important for their persistence over the first year of studies. The estimates presented suggest that the odds ratio in the persistence of students who were admitted in their first option programme is 1.85. This means that the probability of persistence over the probability of dropping out, suspending or transferring is almost twice as high in the group of students who were admitted to the first option course compared to students not admitted in their first choice. Those authors add ‘the conditions of access to higher education, namely the condition underlying the entrance classification, can contribute to the student’s choice being conditioned’ (p. 674).
The statistical model for first-year academic performance shows that the students’ socioeconomic level has influence through the increased motivation of the subgroup of students whose parents have no more than a lower secondary education. This effect seems to represent the willpower of students from socioeconomically disadvantaged groups who were admitted to the university and strive to achieve good results, because good achievement is the requirement for keeping the scholarship. This finding may contribute to the literature on social equity in higher education and to the debate on the motivational component of social status (e.g. Eckland Citation1964; Tinto and Cullen Citation1973; Cantwell, Archer, and Bourke Citation2001) but needs to be confirmed with more cohorts of entrants.
Such results also give quantitative support to the conjecture advanced by Engrácia and Baptista (Citation2018), according to which
children of parents with low schooling who, despite the contrary winds, can finish high school and enter higher education, will be, on average, young people with school performance and levels of resilience above average among students from disadvantaged backgrounds . Therefore, their subsequent performance in higher education is expected to be more comparable to the performance of students from favored socio-economic backgrounds. (p. 18)
To our knowledge, for the first time in Portugal, the results show the advantage in GPA that students of disadvantaged socio-cultural origin have compared to their colleagues, even after controlling for the remaining variables.
We believe that our study constitutes a meaningful contribution to the available research by using microdata from a large sample of first-year students, by considering their schooling trajectory through retrospective data, and by taking into account the hierarchical structure of the data in statistical modelling. However, care should be taken not to generalise the results. The study concerns the entering cohort of 2015/16. Had different cohorts been selected, the results might have been affected. A full investigation of different cohorts was outside the scope of the current study, but it would be very interesting to investigate the sensitivity of these results to new nationwide cohorts of students.
Disclosure statement
No potential conflict of interest was reported by the authors.
Additional information
Funding
References
- Alarcão, I. 2000. “Para uma conceitualização dos fenómenos de sucesso/insucesso escolares no ensino superior.” In Ensino Superior: (In) Sucesso Académico, edited by J. Tavares, and R. Santiago, 13–23. Porto: Porto Editora.
- Almeida, L. S. 2002. Formatar o ensino a pensar na aprendizagem. In Contextos e dinâmicas da vida académica, edited by A. S. Pouzada, L. S. Almeida, and R. M. Vasconcelos, 239–252. Guimarães: Universidade do Minho.
- Almeida, L. S., M. A. Guisande, A. P. Soares, and L. Saavedra. 2006. “Acesso e Sucesso No Ensino Superior em Portugal: Questões de Género, Origem Sócio-Cultural e Percurso Académico Dos Alunos.” Psicologia: Reflexão e Crítica 19 (3): 507–514. https://doi.org/10.1590/S0102-79722006000300020
- Assembleia da República. 2007. “Lei n. 62/2007. Regime Jurídico das Instituições de Ensino Superior.” Diário da República, 174 (1): 6358–6389.
- Baron, J., and M. F. Norman. 1992. “Sats, Achievement Tests, and High-School Class Rank as Predictors of College Performance.” Educational and Psychological Measurement 52 (4): 1047–1055. https://doi.org/10.1177/0013164492052004029
- Beenstock, M., and D. Feldman. 2016. “Decomposing University Grades: A Longitudinal Study of Students and Their Instructors.” Studies in Higher Education 43 (1): 114–133. https://doi.org/10.1080/03075079.2016.1157858
- Berg, M. N. V. D., and W. H. A. Hofman. 2005. “Student Success in University Education: A Multi-Measurement Study of the Impact of Student and Faculty Factors on Study Progress.” Higher Education 50 (3): 413–446. https://doi.org/10.1007/s10734-004-6361-1
- Bryk, A., and S. W. Raudenbush. 1992. Hierarchical Linear Models: Applications and Data Analysis Methods. Thousand Oaks, CA: SAGE Publications.
- Cantwell, R., J. Archer, and S. Bourke. 2001. “A Comparison of the Academic Experiences and Achievement of University Students Entering by Traditional and Non-Traditional Means.” Assessment & Evaluation in Higher Education 26 (3): 221–234. https://doi.org/10.1080/02602930120052387
- Chingos, M. M. 2016. “Instructional Quality and Student Learning in Higher Education: Evidence from Developmental Algebra Courses.” The Journal of Higher Education 87 (1): 84–114.
- Clifton, R. 1997. “The Effects of Social Psychological Variables and Gender on the Grade Point Averages and Educational Expectations of University Students: A Case Study.” Canadian Journal of Higher Education 27 (2/3): 67–90. Retrieved from http://search.ebscohost.com/login.aspx?direct=true&db=eric&AN=EJ559665&site=ehost-live
- Dennis, J. M., J. S. Phinney, and L. I. Chuateco. 2005. “The Role of Motivation, Parental Support, and Peer Support in the Academic Success of Ethnic Minority First-Generation College Students.” Journal of College Student Development 46 (3): 223–236. https://doi.org/10.1353/csd.2005.0023
- Dias, D. 2015. “Has Massification of Higher Education Led to More Equity? Clues to a Reflection on Portuguese Education Arena.” International Journal of Inclusive Education 19 (2): 103–120. https://doi.org/10.1080/13603116.2013.788221
- Dias, D., C. Marinho-Araújo, L. Almeida, and A. Amaral. 2011. “The Democratisation of Access and Success in Higher Education the Case of Portugal and Brazil.” Higher Education Management and Policy 23 (1): 1–42.
- Diseth, Å., S. Pallesen, G. S. Brunborg, and S. Larsen. 2010. “Academic Achievement among First Semester Undergraduate Psychology Students: The Role of Course Experience, Effort, Motives and Learning Strategies.” Higher Education 59 (3): 335–352. https://doi.org/10.1007/s10734-009-9251-8
- Eccles, J. S., and A. Wigfield. 2002. “Motivational Beliefs, Values, and Goals.” Annual Review of Psychology 53 (1): 109–132. https://doi.org/10.1146/annurev.psych.53.100901.135153
- Eckland, B. 1964. “Social Class and College Graduation: Some Misconceptions Corrected.” American Journal of Sociology 70 (1): 36–50.
- Engrácia, P., and J. O. Baptista. 2018. Percursos no ensino superior: Situação após quatro anos dos alunos inscritos em licenciaturas de três anos. Lisboa: Direção-Geral de Estatísticas da Educação e Ciência.
- Farsides, T., and R. Woodfield. 2007. “Individual and Gender Differences in Good and First-Class Undergraduate Degree Performance.” British Journal of Psychology 98 (3): 467–483. https://doi.org/10.1348/000712606X150246
- Ferrão, M. E., and L. S. Almeida. 2018. “Multilevel Modelling of Persistence in Higher Education.” Ensaio: Avaliação e Políticas Públicas em Educação 26 (100): 664–683. https://doi.org/10.1590/S0104-40362018002601610
- Ferreira, C., J. Vidal, and M. J. Vieira. 2014. “Student Guidance and Attention to Diversity in the Processes of Quality Assurance in Higher Education.” European Journal of Education 49 (4): 575–589. https://doi.org/10.1111/ejed.12098
- Fuller, M. B., M. A. Wilson, and R. M. Tobin. 2011. “The National Survey of Student Engagement as a Predictor of Undergraduate GPA: A Cross ‐ Sectional and Longitudinal Examination.” Assessment & Evaluation in Higher Education 36 (6): 735–748. https://doi.org/10.1080/02602938.2010.488791
- Goldstein, H. 2003. Multilevel Statistical Models. 3rd ed. London: Edward Arnold.
- Goldstein, H., W. Browne, and J. Rasbash. 2002. “Partitioning Variation in Multilevel Models.” Understanding Statistics 1 (4): 223–231. https://doi.org/10.1207/S15328031US0104_02
- Johnston, R., D. Manley, K. Jones, R. Harris, and A. Hoare. 2016. “University Admissions and the Prediction of Degree Performance: An Analysis in the Light of Changes to the English Schools’ Examination System.” Higher Education Quarterly 70 (1): 24–42. https://doi.org/10.1111/hequ.12067
- Laforge, M. C. 2003. “Explanatory Style and Academic Performance among College Students Beginning a Major Course of Study.” Psychological Reports 92 (3): 861. https://doi.org/10.2466/PR0.92.3.861-865
- Little, R. J. A., and D. B. Rubin. 2002. Statistical Analysis with Missing Data. 2nd ed. New Jersey: John Wiley & Sons Inc.
- Longford, N. 1993. Random Coefficient Models. New York: Oxford University Press.
- Masui, C., J. Broeckmans, S. Doumen, A. Groenen, and G. Molenberghs. 2014. “Do Diligent Students Perform Better? Complex Relations between Student and Course Characteristics, Study Time, and Academic Performance in Higher Education.” Studies in Higher Education 39 (4): 621–643. https://doi.org/10.1080/03075079.2012.721350
- McKenzie, K., and R. Schweitzer. 2001. “Who Succeeds at University? Factors Predicting Academic Performance in First Year Australian University Students.” Higher Education Research & Development 20 (1): 21–33. https://doi.org/10.1080/07924360120043621
- Ministério da Educação e Ciência. 2014. “Decreto-Lei n.113/2014.” Diário da República, 135(1): 3874–3878.
- Mouw, J. T., and R. K. Khanna. 1993. “Prediction of Academic Success: A Review of the Literature and Some Recommendations.” College Student Journal 27 (3): 328–336.
- O’Connor, M. C., and S. V. Paunonen. 2007. “Big Five Personality Predictors of Post-Secondary Academic Performance.” Personality and Individual Differences 43 (5): 971–990. https://doi.org/10.1016/j.paid.2007.03.017
- Páramo Fernández, M. F., A. Araújo, C. T. Vacas, L. D S. Almeida, and M. S. González. 2017. “Predictors of Students’ Adjustment during Transition to University in Spain.” Psicothema 29 (1): 67–72. https://doi.org/10.7334/psicothema2016.40
- Pike, G. R., and L. M. Rocconi. 2012. “Multilevel Modeling: Presenting and Publishing the Results for Internal and External Constituents.” New Directions for Institutional Research 2012 (154): 111–124. https://doi.org/10.1002/ir
- Pike, G. R., and J. L. Saupe. 2002. “Does High School Matter? An Analysis of Three Methods of Predicting First-Year Grades.” Research in Higher Education 43 (2): 187–207.
- Pintrich, P. R. 2004. “A Conceptual Framework for Assessing Motivation and Self-Regulated Learning in College Students.” Educational Psychology Review 16 (4): 385–407. https://doi.org/10.1007/s10648-004-0006-x
- Poropat, A. E. 2009. “A Meta-Analysis of the Five-Factor Model of Personality and Academic Performance.” Psychological Bulletin 135 (2): 322–338. https://doi.org/10.1037/a0014996
- Portela, M., N. Areal, C. Sá, F. Alexandre, J. Cerejeira, A. Carvalho, and A. Rodrigues. 2008. “Evaluating Student Allocation in the Portuguese Public Higher Education System.” Higher Education 56 (2): 185–203. https://doi.org/10.1007/s10734-007-9097-x
- Rasbash, J., W. Browne, M. Healy, B. Cameron, and C. Charlton. 2014. MLwiN 2.31. Bristol: Centre for Multilevel Modelling, University of Bristol.
- Ray, A., T. McCormack, and H. Evans. 2009. “Value Added in English Schools.” Education Finance and Policy 4 (4): 415–438. https://doi.org/10.1162/edfp.2009.4.4.415
- Richardson, M., C. Abraham, and R. Bond. 2012. “Psychological Correlates of University Students’ Academic Performance: A Systematic Review and Meta-Analysis.” Psychological Bulletin 138 (2): 353–387. https://doi.org/10.1037/a0026838
- Robbins, S. B., K. Lauver, H. Le, D. Davis, R. Langley, and A. Carlstrom. 2004. “Do Psychological and Study Skills Factors Predict College Outcomes? A Meta-Analysis.” Psychological Bulletin 130 (2): 261–288.
- Sackett, P. R., N. R. Kuncel, J. J. Arneson, S. R. Cooper, and S. D. Waters. 2009. “Does Socioeconomic Status Explain the Relationship between Admissions Tests and Post-Secondary Academic Performance?” Psychological Bulletin 135 (1): 1–22. https://doi.org/10.1037/a0013978
- Smith, J., and R. Naylor. 2001. “Determinants of Degree Performance in UK Universities: A Statistical Analysis of the 1993 Student Cohort.” Oxford Bulletin of Economics and Statistics 63 (1): 29–60. https://doi.org/10.1111/1468-0084.00208
- Soares, A. P., A. M. Guisande, L. S. Almeida, and F. M. Páramo. 2009. “Academic Achievement in First‐Year Portuguese College Students: The Role of Academic Preparation and Learning Strategies.” International Journal of Psychology 44 (3): 204–212. https://doi.org/10.1080/00207590701700545
- Tavares, D., O. Tavares, E. Justino, and A. Amaral. 2008. “Students’ Preferences and Needs in Portuguese Higher Education.” European Journal of Education 43 (1):107–122. https://doi.org/10.1111/j.1465-3435.2007.00331.x
- Tavares, O., and J. B. Ferreira. 2012. “Choices and Motivations: The Why and How of Portuguese Students’ Enrolment Choices.” European Journal of Education 47 (2):310–326. https://doi.org/10.1111/j.1465-3435.2012.01527.x
- Tinto, V., & Cullen, J. (1973). Dropout in higher education: A review and theoretical synthesis of recent research. New York: Columbia University. Retrieved from ERIC database. (ED078802).
- Voyer, D., and S. D. Voyer. 2014. “Gender Differences in Scholastic Achievement: A Meta-Analysis.” Psychological Bulletin 140 (4): 1174–1204. https://doi.org/10.1037/a0036620
- Vulperhorst, J., C. Lutz, R. de Kleijn, and J. van Tartwijk. 2018. “Disentangling the Predictive Validity of High School Grades for Academic Success in University.” Assessment & Evaluation in Higher Education 43 (3): 399–414. https://doi.org/10.1080/02602938.2017.1353586
- Wells, R. S., E. A. Kolek, E. A. Williams, and D. B. Saunders. 2015. “How We Know What We Know”: A Systematic Comparison of Research Methods Employed in Higher Education.” Journal of Higher Education 86 (2): 171–195.
- Yorke, M., & Longden, B. 2008. “The first-year experience in higher education in the UK”. Yo k: The Higher Education Academy. Retrieved from www.heacademy.ac.uk