ABSTRACT
The water balance dynamics and runoff components of a tropical forested catchment (46 km2) on the southwestern Pacific coast of Nicaragua were studied combining hydrometry, geological characterization and hydrochemical and isotopic tracers (three-component hydrograph separation). The climatic water balance was estimated for 2010/11, 2011/12 and 2012/13 with net values of 811 mm year-1, 782 mm year-1 and –447 mm year-1, respectively. Runoff components were studied at different spatial and temporal scales, demonstrating that different sources and temporal contributions are controlled by dominant landscape elements and antecedent rainfall. In forested sub-catchments, permeable soils, stratigraphy and steep slopes favour subsurface stormflow generation contributing 50% and 53% to total discharge. At catchment scale, landscape elements such as smooth slopes, wide valleys, deeper soils and water table allow groundwater recharge during rainfall events. Groundwater dominates the hydrograph (50% of total discharge) under dry prior conditions. However, low soil infiltration capacity generates a larger surface runoff component (42%) under wet prior conditions which dominates total discharge. Our results show that forested areas are important to reduce surface runoff and thus soil degradation, which is relevant for the design of water management plans.
Editor D. Koutsoyiannis Associate editor D. Gerten
1 Introduction
Sustainable water management requires the broadest possible hydrological information and reliable predictions in order to face water demand for growing populations, prevent ecosystem degradation and reduce the impact of natural hazards and disasters (Sivapalan et al. Citation2003). Catchment hydrology deeply interweaves with water resources management to ensure life and ecosystem sustainability (Bonell and Bruijnzeel Citation2004, Uhlenbrook Citation2006). Nonetheless, data scarcity in ungauged basins poses a major challenge in achieving this understanding.
Prediction of water quantity and quality requires understanding of runoff generation processes (Bonell Citation1998); and according to Bonell and Bruijnzeel (Citation2004) there has been relatively less research in tropical forests compared to the detailed studies carried out in temperate climates. Runoff generation processes in the tropics are expected to be different from temperate climates due to strong rainfall variability and seasonality. In addition, different soil types and land uses may cause differences between commonly studied temperate regions and poorly investigated tropical areas (Hugenschmidt et al. 2014).
Some examples of studies looking at tropical catchments are also found in literature e.g. Elsenbeer et al. (Citation1995a,b), Mortatti Citation1997, Elsenbeer and Vertessy (Citation2000), Bruijnzeel (Citation2001), Goller et al. (Citation2005), de Araújo and González Piedra (Citation2009), Roa-García and Weiler (Citation2010), Wenjie et al. (Citation2011), and Munyaneza et al. (Citation2012). Works on runoff generation in tropical climate include Chaves et al. (Citation2008), Germer et al. (Citation2009), Zimmermann et al. (Citation2009), Brooks et al. (Citation2010), Germer et al. (Citation2010), Muñoz-Villers and McDonnell (Citation2013), Salemi et al. (Citation2013) and Beck et al. (Citation2013).
Key process research studies in Central America include Genereux (Citation2004), who used environmental tracers in Costa Rica to study inter-basin groundwater transfer; Harmon et al. (Citation2009), who studied hydrochemistry of surface water related to geology in Panama; Westerberg et al. (Citation2010, Citation2011) and Guerrero et al. (Citation2012), who studied precipitation and discharge relationships in a catchment in Honduras, and another extensive work in Honduras to investigate hydrology and hydrochemistry related to water supply (Caballero Citation2012). A significant research output for forest hydrology in Costa Rica is listed by Bonell and Bruijnzeel (Citation2004). Some examples are Calvo (Citation1986), Bruijnzeel (Citation2001), Hölscher et al. (Citation2003, Citation2004). Other works in Guatemala and Panama include Cavelier et al. (Citation1997), Holder (Citation2004) and Niedzialek and Ogden (Citation2012). Much of this work is focused on specific aspects of the hydrologic cycle such as interception, throughfall, and stem flow; or on hydrochemistry and nutrient inputs. However, not much work is found in Central America regarding runoff generation processes (Häggström et al. Citation1990, Caballero et al. Citation2013). Catchment hydrology studies in Nicaragua are rarely found in the literature, e.g. Mendoza et al. (Citation2006).
Notably, Nicaragua is a country with a very modern water resources legislation. The General Law of National Waters (Citation2007) mandates the creation of water resources management plans for each of the 21 catchment areas in the country. However, there has not yet been an official publication of any of these plans. This is probably due to the scarce long-term hydrometeorological data monitoring in the country and other resources-related challenges.
The southern Pacific coastal area of Nicaragua is a zone of great touristic potential and real estate development is taking off quickly. The investigated Ostional catchment is located within this area and has extraordinary coastal and rural touristic potential. Nevertheless, increases in tourism and other related developments will create large stresses on water resources in this region. For instance, the main town water supply is based on a single deep well that already runs at its maximum capacity. Therefore, sustainable development of water resources in the area requires knowledge of water resources availability and understanding of the hydrological system.
The study area provides a typical example of a poorly gauged, tropical forested catchment on the southern Pacific coast of Nicaragua. This catchment provides an opportunity for testing methods to investigate rainfall–runoff processes commonly used in temperate climates in a different hydroclimatic region, as suggested by Burns (Citation2002).This is one of the first works in a forested catchment in the Central American region to use a combined approach of hydrometry, hydrological characterization (based on geology, geomorphology, topography and land use) as well as chemical and isotopic tracers. Therefore, the knowledge gained not only provides information on water resources availability for developing water management plans, but also provides a reference for future studies in similar hydrological settings in the region and intercomparison with other catchments in the world.
The objective of this research was to calculate the climatic water balance for the catchment and to understand the main runoff generation sources and flow paths by applying different hydrochemical and isotopic tracers at different spatial and temporal scales.
2 Study area
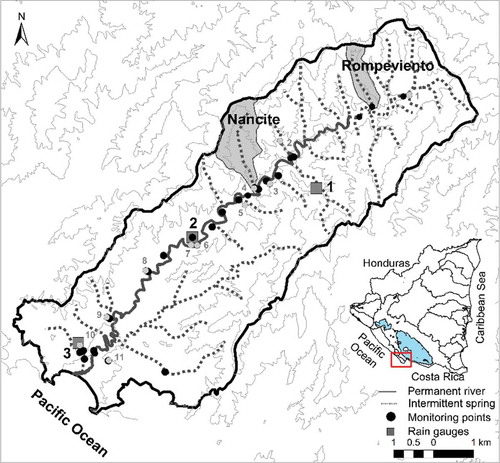
The study catchment is located on the southwestern coast of Nicaragua. It has an approximate area of 46 km2. Two sub-catchments were selected for event-based sampling: Rompeviento (0.8 km2) and El Nancite (1.6 km2). The selection was based on proximity to a rain gauge station and accessibility. Locations are shown in Fig. 1.
According to Holdrige’s classification (Holdridge Citation1967), the area is located in the tropical wet forest life zone. The rainy season starts in May and ends in November. September and October are usually the rainiest months at the Pacific Coast. Usually between July and August there is a 3 to 5 week period known as midsummer drought (MSD) (Magaña et al. Citation1999). Historical climatic data for the period 1965–2007 were available for Rivas station, located 40 km NW of the catchment and at an elevation of 70 m a.s.l. (CIRA Citation2008). The 42-year record registered a mean temperature of 27.1°C, a monthly minimum of 24.2°C registered in February and a monthly maximum of 30.6°C registered in May. Wind direction is predominantly towards the east and average wind velocity is 5 m s-1. Historical mean annual precipitation at Rivas is 1476 mm year-1 and mean pan evaporation was 1976 mm year-1.
Elevation ranges between sea level and 500 m a.s.l. in the northeast. Land use in 2002 was dominated by forest (52%), agriculture (20%) and pasture (28%) (UNA Citation2003). Soil depths vary between 0.9 and 0.5 m and texture is classified as clay-loam and clay (UNA Citation2003). The study area is located in the geologic province of the Pacific Rim, in the Rivas–Tamarindo sub-province. The region developed from sediment deposition during sea regression and transgression. Two geologic formations are present in the area: the Upper Cretaceous Rivas Formation and the Eocene Brito Formation. However, only the Brito Formation is exposed. The Rivas Formation is composed of drab, tuffaceous shale, sandstone, arkose and greywacke (Swain Citation1966). The Brito Formation overlies concordantly the older Rivas Formation. The Brito Formation comprises volcanic breccias, tuffs, shales, limestones and sandstone (Swain Citation1966, Krasny and Hecht Citation1998, Elming et al. Citation2001).
3 Materials and methods
3.1 Hydrological monitoring
The monitoring period spanned from May 2010 to April 2013. Three automated rain gauges (Rain-O-Matic Professional rain gauge from PRONAMIC) were installed to collect rainfall data with a resolution of 0.254 mm. Monitoring sites were selected based on elevation differences and accessibility. Locations are presented in .
Class A evaporation pans were installed at the same locations. The pan evaporation is related to the reference evaporation by an empirically derived pan coefficient depending on site specific conditions such as pan type, land cover in the station, its surroundings, as well as the general wind and humidity conditions. The term reference evaporation is defined as the rate of combined evaporation from a reference surface, with no water shortage. This term allows estimation of total evaporation demands of the atmosphere independently of crop type, crop development and management practices (Allen et al. Citation1998). In our case the pan coefficient was estimated as 0.7. Daily measurements were taken every morning at 7 am.
Missing rainfall and evaporation data were filled in by the normal ratio method. This method estimates missing rainfall at the station under consideration as the weighted average of adjoining stations. The rainfall at each of the adjoining stations is weighted by the ratio of the average annual rainfall at the station under consideration and average annual rainfall of the adjoining station (Paulhus and Kohler Citation1952) using data from the other available stations. Total rainfall and evaporation for the catchment was estimated using the weighted average from the three monitoring stations using Thiessen polygons.
Groundwater levels were measured monthly using a water level meter (Solinst, model 102) in all shallow household wells in the three communities of the catchment for the period of July 2010 to April 2013. The wells in San Antonio and Montecristo are all located near the river (). Well depth in all locations ranges between 4 and 14 m.
Soil infiltration capacity was measured using double ring infiltrometer tests (Rawls et al. Citation1996). Eleven sites were selected along the catchment based on different soil types and slopes; locations are shown in .
Figure 1. Study catchment and selected sub-catchments. Black circles are groundwater level monitoring points for the period 2010–13 and rain gauge locations (1) Monteverde, (2) Montecristo and (3) Ostional. Grey circles are locations of soil infiltration tests. Topographic contour resolution is 100 m.
River discharge was estimated by developing a rating curve through the area–velocity method (Buchanan and Somers Citation1969). Velocity was measured using a flow meter from Global Water FP111. Frequent measurements (218 in total) were performed at the catchment outlet in the Ostional town starting in May 2010. River stage was monitored using a Schlumberger diver, range 10 m, DI501. Data were recorded every 30 min. Barometric pressure was recorded at the same interval and period to compensate for atmospheric pressure variations using a baro diver, range 1.5 m (Schlumberger 50013, DI501) located in the catchment area.
Attempts to build and update the rating curve for the catchment were made during the study period, but it was not possible to carry out continuous measurements due to technical problems. However, discharge–stage (Q–h) analyses could be performed for nine rainfall–runoff events during 2012. During these events, most of the rating curves yielded a correlation coefficient (R2) of less than 0.2, likely caused by the changing channel morphological conditions during the events. Only two events yielded R2 values above 0.8: an event on 19 October 2012 (R2 = 0.82) and an event on 22 October 2012 (R2 = 0.84), which were used for further event-based analysis in this study.
3.2 Hydrochemical and isotopic sampling
Bulk rain water samples were collected weekly during the rainy season of 2010 from each rain gauge station for isotopic analysis and construction of the local meteoric water line. A total of 80 samples were collected.
Event-based sampling was carried out at sub-catchment scale in 2010 and at catchment scale in 2012. Sampling frequency was 5 min and 15 min for sub-catchment scale events and 20 min for catchment scale events. Electrical conductivity (EC), pH, stream velocity and stage were recorded at each sampling time. Samples were immediately filtered through 0.45-μm glass fibre filters. The samples used for cation (25 mL) analyses were acidified with concentrated H2NO3 to prevent precipitation reactions and cation attachment to the surface of the sample bottle. The samples for anions (50 mL) were stored in non-acidified bottles. Samples for isotopic analyses of δ2H and δ18O were collected in 1 mL glass vials.
In this study, rainfall events were defined as periods of continuous precipitation yielding at least 23 mm d-1. A total of four events were sampled for sub-catchment scale and nine for catchment scale. However, only two and three events, for sub-catchment and catchment scale, respectively, showed a recognizable peak in discharge. The other events were too small to show significant chemical or isotopic changes.
Major cations (Mg2+, Na2+, Mn2+, K+ and Fe2+) were analysed using an inductively coupled plasma-optical emission spectrometer (ICP-OES: Perkin Elmer Optima 3000); while Ca2+ was measured using a flame atomic emission spectroscope (AES: Perkin Elmer AAnalyst 200). The major anions (Cl–, HCO3–, SO42–, NO32–) were measured using an ion chromatography system (IC: Dionex ICS 1000). The calculated ion balance error was between −10% and +10%; samples with higher errors were discarded. Silica (SiO2) was analysed using the molybdosilicate method in a spectrophotometer (Clesceri et al. (Citation1998). The detection limit for the method is 0 to 1.71 mg SiO2/50 ml). The δ2H and δ18O were measured in an LGR liquid water isotope analyser (LWIA). Analytical error for δ2H amounts to ±1‰ and for δ18O to ±0.2‰. All the analyses were performed at the hydrochemical laboratory at UNESCO-IHE in the Netherlands.
3.3 Hydrograph separation
Total runoff was analysed using three-component hydrograph separation as outlined by Hoeg et al. (Citation2000). This method is based on the mass conservation of water and the tracers (Sklash and Farvolden Citation1979). Chemical tracers were used to determine source areas contributing to total runoff and water isotopes were used to determine temporal sources of runoff, as described by other authors (Uhlenbrook et al. Citation2002, Wenninger et al. Citation2004, Munyaneza et al. (Citation2012).
For sub-catchment scale events we were able to use Mg+, Na+ and Cl-. However, at catchment scale we used Cl– and silica for the three-component separation since they behaved more conservatively based on the chemographs, which show highly irregular patterns for other tracers. Capturing the spatial and temporal variability of end-members is difficult, as discussed by other authors (Uhlenbrook and Leibundgut Citation2002, Uhlenbrook and Hoeg Citation2003, Blume et al. Citation2008a, Didszun and Uhlenbrook Citation2008, Bohté et al. 2010, Hugenschmidt et al. 2010). Silica has proven to be an appropriate tracer for hydrograph separations (Hoeg et al. Citation2000, Blume et al. Citation2008a, b, Mul et al. Citation2008, Hugenschmidt et al. Citation2014). Munyaneza et al. (Citation2012) used chloride and silica to perform two-component separations.
Selected end-members for the sub-catchment scale events were surface runoff (event water), based on a bulk rainwater sample collected during one of the events; groundwater, based on average chemical composition of shallow wells during the dry season; and subsurface stormflow, based on a sample from a shallow well (5 m deep) located at the base of the hillslope in the Nancite sub-catchment. The sample was collected after the rainy season, and we assume that this shallow well collects subsurface stormflow from the hillside. A similar assumption was used by Hooper et al. (Citation1990).
Selected end-members at the catchment scale were surface runoff, baseflow and groundwater. The surface runoff end-member is based on the average composition of rainwater. Baseflow is based on river water collected after a 10-day period with an accumulated precipitation of 25 mm in the catchment. Here we use the definition of Dingman (Citation2002) of baseflow, as flow that cannot be associated with a specific event. The small amount of precipitation indicates negligible contributions from event-associated runoff. Groundwater is based on the average composition of shallow groundwater along the catchment during the dry season.
Runoff coefficients were determined for each event based on the ratio of event discharge over total precipitation as discussed by Blume et al. (Citation2007).
4 Results
4.1 Hydrological characterization
Fifteen intermittent and perennial first-order springs were found in the medium and upper part of the catchment (). Flow rates during the dry season vary between 0.005 m3 s-1 and 1 m3 s-1; streams located at the uppermost catchment area have the higher discharge rates.
Catchment geology in the upper catchment area is defined by massive sandstone, overlaid by highly folded and fractured shale and limestone. Stream discharge is sustained by groundwater, as confirmed by the abundance of travertine deposits near the stream headwaters []. Springs occur at the contact between the shale/limestone and the sandstone. We observed in the field that sandstone is less deformed and much less permeable than the shale unit. Therefore, springs occur along the faults in the shale/limestone or at the contact with the less permeable sandstone. Densely distributed joints perpendicular to the fractures in the shale and limestone favour preferential flow.
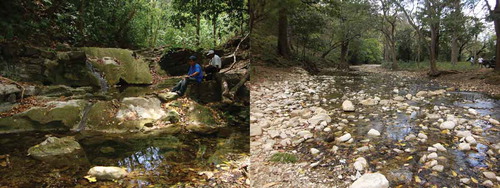
The sub-catchments are narrow V-shaped valleys [(a)], where alluvial deposition only reaches about 1 m in thickness and stream width is between 1 and 2 m. Sandstone streambeds are exposed and highly fractured shale walls (10–20 m) enclose the streams. Population in this area is very scattered and land use is dominated by natural forest. Slopes are very steep, between 20% and 100%.
The lower part of the catchment presents a wide (1 km) alluvial valley [(b)] with an estimated thickness of up to 15 m. Underlying the alluvium, a shale unit of unknown thickness was found (Calderon et al. (Citation2014). Slope is less than 1%. Land use in the lower catchment is a combination of forest, agriculture and pasture.
Soil infiltration capacity values vary between 10 mm h-1 and 50 mm h-1 (). Higher values correspond to the upper catchment area and lower values correspond to the lower part of the catchment.
Table 1. Soil infiltration capacity.
4.1.1 Rainfall and evaporation
Monthly rainfall values are presented for the period of May 2010–May 2013 (). For all stations, rainfall during 2010 was more evenly distributed during the rainy period compared to 2011 and 2012, when large peaks were observed during October ()). Annual rainfall for Ostional, Montecristo and Monteverde was 2049 mm year-1, 2243 mm year-1 and 2083 mm year-1 for 2010; 1636 mm year-1, 2087 mm year-1 and 2358 mm year-1 for 2011; and 1581 mm year-1, 997 mm year-1 and 1094 mm year-1 for 2012, respectively. Rivas station registered 1684 mm year-1, 1893 mm year-1 and 1018 mm year-1 for 2010, 2011 and 2012, respectively.
Figure 2. Climatic water balance for the catchment for the period June 2010 to April 2013. (a) Monthly precipitation (P) for each station. (b) Reference evaporation (Eref) at each station. (c) P–Eref for the catchment based on areal weighted averages and average hydraulic head (h) fluctuations for wells at the three catchment communities.
In all cases, 2012 was a relatively dry year compared to the historical mean annual value (1476 mm year-1). Extremely high values were observed for October 2011, between 1000 mm month-1 and 1300 mm month-1. The reference station Rivas also showed a high value, i.e. 600 mm month-1, the double of the historical mean. A significant spatial variation in rainfall within the catchment was observed. During 2010 the difference in accumulated rainfall between stations varied between 2% and 9%. For 2011 differences were between 12% and 44% and for 2012 between 9% and 36%. In 2012, rainfall was highest near the coast, which indicates the influence of sea evaporation. Peak evaporation values were observed during March 2011 with 170 mm month-1 for the catchment ()).
4.1.2 Climatic water balance
shows the climatic water balance. For all wells during the three years a slow increase in head is observed with the onset of the rainy season. Heads stay high for about 2 months after the end of the rainy season, suggesting groundwater recharge and storage, and then start to gradually fall again.
The rainy season of 2011 was an exception. Since most precipitation was concentrated in October, sudden short rises in the hydraulic heads at the three communities were observed during this month. During 2010 and 2012, we observed a more even distribution of precipitation during the rainy period, which caused a smoother rise and fall in hydraulic heads within a period of two months.
Average groundwater level fluctuations were larger for the lower catchment wells (Ostional), with increases of 33%, 41% and 12% between the dry and wet season for each monitored year. Average increases for the middle catchment wells (Montecristo) were 8%, 11% and 2%. For the upper catchment wells (San Antonio) average increases were the lowest: 2%, 3% and 2% for each year. Fluctuations between wells are larger than within wells. For instance, maximum differences within wells were 9%, 22% and 57% for San Antonio, Montecristo and Ostional, respectively, during the total monitoring time. Differences between wells were 30%, 60% and 80%, for San Antonio, Montecristo and Ostional, respectively.
A net positive balance was estimated for the hydrologic years 2010–11 and 2011–12 with values of 811 mm and 782 mm, respectively. For 2012–13 the balance was negative (−447 mm).
4.2 Rainfall–runoff events
4.2.1 Hysteretic behaviour of solute concentration–discharge relationships
Hysteresis in tracer concentration and discharge relationships was analysed. All tracers yielded similar patterns; therefore, only EC is shown for discussion (). Clockwise hysteresis loops were observed for all events at sub-catchment and catchment events, except for the 22 October event. Clockwise patterns indicate higher concentrations during the rising limb of the events (Burt et al. Citation1983, House and Warwick Citation1998). Counter-clockwise patterns show lower solute concentrations during the rising limb of the hydrograph. Higher concentrations of tracers in the rising limb may indicate a contribution from delayed subsurface runoff, which may show little tracer dilution during storms, as discussed by Burt et al. (1983) and House and Warwick (Citation1998). The 22 October event showed increased concentrations in the falling limb of the hydrograph compared to the initial concentrations. For instance, Ca2+ increased from 43 mg L-1 to 99 mg L-1; Na+ from 6.8 mg L-1 to 15.7 mg L-1; and Mg2+ from 1.98 mg L-1 to 4.4 mg L-1.
Figure 3. Hysteresis in EC–discharge relationships during sub-catchment (a) and catchment (b and c) rainfall–runoff events. Hollow circles represent concentrations during the rising limbs, solid circles represent concentrations during the falling limbs, and arrows indicate time evolution.
4.2.2 Hydrograph separations
End-member compositions for sub-catchment and catchment scale events are summarized in . Open rainfall samples were used to determine surface runoff composition for catchment scale events. Therefore, to account for enrichment caused by throughfall, a theoretical enrichment of 1.4% was assumed for both water isotopes. Isotopic enrichment by throughfall has been reported in forested catchments in Canada (+2.9%), Japan (+2.8%), Germany (+36%) and Costa Rica (+1.4%) (Rhodes et al. (Citation2006, Klaus and McDonnell (Citation2013). We also compared the composition of an open rainfall sample and under-canopy rainfall sample for a sub-catchment event. We found an enrichment of +1.5% in the under-canopy sample with respect to the open rainfall sample.
Table 2. End-member composition for sub-catchment and catchment scale events.
4.2.2.1 Sub-catchment scale
Chemical hydrograph separations for Events 1 and 2 are presented in . Total contributions from subsurface stormflow, groundwater and surface runoff were 50%, 35% and 15% for Event 1, respectively; and 53%, 28% and 19% for Event 2, respectively.
During Event 1 (Rompeviento), subsurface stormflow was almost equal to groundwater discharge and then increased with the peak of the hydrograph. In the case of Event 2 (El Nancite), subsurface stormflow accounted for the total discharge at the beginning of the hydrograph. Groundwater contribution was approximately constant throughout Event 1. Peak groundwater contribution occurred at 11:45, right before peak discharge. At this moment, groundwater discharge decreased and surface runoff increased. A similar behaviour is observed in Event 2. The groundwater contribution was highest during peak discharge at 17:22 and surface runoff peaked when the groundwater contribution decreased.
Isotopic separations using δ18O and δ2H are presented in . Although usually information from δ18O and δ2H is considered similar, we found differences in the results for both sub-catchments. The hydrograph separation based on δ18O determined that in Event 1 the pre-event water contribution was 42% and in Event 2 the contribution was 46%. However, the hydrograph separation using δ2H shows a larger contribution of pre-event water. For Event 1 it is 75% and for Event 2 it is 58%.
4.2.2.2 Catchment scale
Several ions were tested to perform hydrograph separations, but Cl- and δ18O were selected since they behaved more conservatively. presents results for three events. Chemical hydrograph separation for Event 3 (19 October 2012) showed contributions of surface runoff, baseflow and groundwater of 19%, 36% and 45%, respectively. For Event 4 (22 October 2012) contributions in the same order were 32%, 22% and 46% and for Event 5 (25 October 2012) 42%, 38% and 21%, respectively.
Isotopic separations based on δ18O and δ2H are presented in . Similar results were obtained using either water isotope. Pre-event water contributions based on δ18O were 82%, 68% and 70% for Events 3, 4 and 5, respectively. Pre-event water contributions based on δ2H were 84%, 82% and 66% for the same events. Only for Event 4 is the difference between results from δ18O and δ2H large. This result may be caused by a different event type (Lyon et al. (Citation2009). Nevertheless, pre-event water was accounted as the major contributor to total discharge for both isotopes.
4.3 Runoff coefficients
Runoff coefficients were low (). The largest value was estimated for Event 2. In the case of sub-catchment events, rainfall intensity was below the highest infiltration capacity of the soils (50 mm h-1). For catchment scale events, rainfall intensity was above the infiltration capacity of soils at the lower catchment area (10 mm h-1).
Table 3. Summary of rainfall-runoff events. Runoff coefficients are based on δ18O hydrograph separations.
5 Discussion
The climatic water balance was positive for the hydrologic years 2010–11 and 2011–12, but it was negative for 2012–13. However, we observed baseflow during the dry season 2012/13 []. Therefore, we infer that groundwater storage sustained river discharge during dry months. Unfortunately, it was not possible to estimate the catchment water balance continuously, due to technical problems related to the construction of the gauging station and the rating curve. Therefore, we were not able to separate groundwater stored in the system and groundwater discharged as baseflow leaving the catchment to the Pacific Ocean.
Analysis of hysteretic patters shows a small shift between the rising and falling limb of the Rompeviento sub-catchment event. Since a simple mix of two end-members would result in an almost collinear EC–discharge relationship (cf. Sklash and Farvolden Citation1979), the small shift suggests that a two-component model is appropriate to explain total runoff composition for this event. However, a larger shift was observed in the relationship between EC and Na+ as well as EC and Cl-. Differences in the hysteresis patterns between EC and selected ions indicate different conservative behaviours and thus different transport or reaction processes, as discussed for instance by Hoeg et al. (Citation2000). Therefore, a three-component hydrograph separation was also used for this event.
The remaining events show a larger shift between rising and falling limbs of the hysteresis loops. This suggests that total runoff composition cannot be explained by a simple two-component hydrograph separation, as discussed by others (Sklash and Farvolden Citation1979, House and Warwick Citation1998, Hoeg et al. Citation2000).
5.1 Sub-catchment scale
Hydrograph separations at sub-catchment scale indicate that rainfall infiltrates quickly into the thin soils of the hillslopes activating subsurface stormflow. We did not observe surface runoff during these events. Macropores from the roots of the abundant vegetation, and probably insect and animal burrows, favour infiltration over surface runoff despite the steep slopes. Subsurface stormflow occurs at the contact between the permeable soil and the less permeable shale/limestone rocks, as we observed in the field. Thus, subsurface stormflow is probably delivered to the stream through the soil matrix and macropores/pipes processes as discussed by others (McDonnell Citation1990, Bonell Citation1993, Weiler et al. Citation2006). Detailed process examination was beyond the scope of this study, as this would need more intense small scale investigations including soil moisture patterns.
Groundwater discharge is activated when rainfall percolates beyond the soil layer, probably causing a rise in the water table, which is already near the streambed (<1 m b.g.l.). At this point subsurface stormflow decreases and groundwater becomes a larger contributor to total runoff. Although the riparian zone in these sub-catchments is only about 4 m wide, we believe that the shallow water table and the fractures in the shale and limestone (Krasny and Hecht (Citation1998), which may induce preferential groundwater flow, enhance groundwater contributions to total discharge during rainfall–runoff events.
Hydrographs dominated by subsurface runoff components have been also observed in the work of others, which is mostly concentrated in temperate climates (Sklash and Farvolden Citation1979, Wels et al. Citation1991, Cey et al. Citation1998, Genereux and Hooper Citation1998, Didszun and Uhlenbrook Citation2008, Capell et al. Citation2011), but also in tropical semi-arid (Bohté et al. Citation2010, Hrachowitz et al. Citation2011) and humid tropical (Hugenschmidt et al. Citation2010) climates. Although other works in tropical catchments in the Amazonas (Elsenbeer et al. Citation1995a, Elsenbeer and Vertessy Citation2000, Elsenbeer Citation2001), Australia (Elsenbeer et al. Citation1995b) and Puerto Rico (Schellekens et al. Citation2004) reported overland flow as the dominant component of storm runoff.
Differences in the hydrograph separations based on δ18O and δ2H are explained by various sources of errors in the end-member concentrations (cf. Uhlenbrook and Hoeg Citation2003) and analytical errors. However, Lyon et al. (Citation2009) indicate that there are independent variations in sampled precipitation values for both isotopes, which reflect various sources of atmospheric moisture generating rainfall. In our case, the difference in the stable isotope separations may have been caused by the spatial isotopic variability of rainfall, which is not captured by the selected end-member.
5.2 Catchment scale
Hydrograph separations at catchment scale indicate that peak discharge was caused by surface runoff. However, the relative contribution from surface runoff to total discharge was smallest for Event 3. During this event, groundwater was the most important component. For Events 4 and 5 the beginning of the hydrograph is dominated by surface runoff. Baseflow became the dominant component after peak discharge.
The differences in the dominant component are related to antecedent rainfall. Prior to Event 3, there were no large enough rainfall events to produce a significant increase in total discharge. This indicates that the soils were dry enough to infiltrate the rainfall that occurred during Event 3; whereas during Events 4 and 5, soils must have been close to saturation.
The groundwater contribution during Event 3 was the largest during peak discharge and then decreased once the rainfall input ceased. This suggests that infiltration caused a rise in the water table, which must have been already near the river bed to respond quickly to the rainfall event. For Events 4 and 5, the groundwater contribution was delayed with respect to peak discharge. This suggests that the water table had to be replenished before there could be a significant groundwater contribution.
Hydrograph separation based on stable water isotopes indicates that in all events pre-event water was the main component of the hydrograph. Interestingly, during Event 5 there was a shift from pre-event water to event water at 5:00. This result agrees with the chemical separation which indicated dominance of the surface runoff component.
5.3 Runoff coefficients
Small runoff coefficients for sub-catchment events agree with the chemical hydrograph separation, which indicates larger subsurface flow contributions (stormflow and groundwater). However, there is a discrepancy between the δ18O and δ2H results. This discrepancy limits the applicability of the runoff coefficient.
We observed the smallest runoff coefficient at catchment level for Event 3 and somewhat larger for Events 4 and 5. The difference between events agrees with the small surface runoff contribution estimated for Event 3 and the larger contribution of this component to Events 4 and 5. Runoff coefficients estimated a smaller amount of event water compared to the estimated surface runoff (−37%, −34% and −53% for Events 3, 4 and 5).
5.4 Synthesis: conceptual model of runoff generation
Sub-catchments are characterized by steep slopes, thin clayish soils overlying shale/limestone, shallow water table and narrow riparian zone ()). Intermittent springs are formed by (a convergence of) faults and preferential flow of groundwater through perpendicular joints and fissures. Forest is the dominant land use. The dominant runoff component was subsurface stormflow, followed by groundwater and surface runoff. Macropores (fissures, root channels etc.) in clay-shale/limestone slopes may produce rapid water percolation and subsoil drainage (Bogaard et al. Citation2012). Small runoff coefficients (2.8% and 12.98%) also indicate little generation of surface runoff. Separation between event and pre-event water was not conclusive.
Figure 4. Hydrograph separation based on chloride and δ18O for events 1 and 2. Qt: total discharge, Qsr: surface runoff, Qssf: subsurface stormflow and Qgw: groundwater.
Figure 5. Hydrograph separation based on δ18O and δ2H for events 1 and 2. Qt: total discharge, Qe: event water contribution and Qp: pre-event water contribution.
Figure 6. Hydrograph separation based on chloride and δ18O for Events 3, 4 and 5. Qt: total discharge, Qsr: surface runoff, Qb: baseflow and Qgw: groundwater.
Figure 7. Hydrograph separation based δ18O and δ2H for Events 3, 4 and 5. Qt: total discharge, Qe: event water contribution and Qp: pre-event water contribution.
Figure 8. Conceptualization of runoff generation at sub-catchment (a) and catchment scale (b).
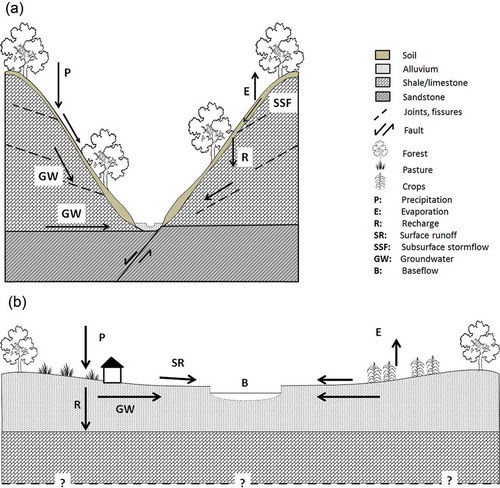
At the catchment scale ()), we find an approximately 1 km wide alluvial valley with an estimated thickness of 15 m (Calderon et al. (Citation2014). Land use is more diverse, including pasture and agriculture as opposed to the forested sub-catchments. At this scale, the composition of total runoff is influenced by antecedent rainfall events. Groundwater dominates in dry soil conditions and surface runoff is the dominant component when soils are (nearly) saturated. This agrees with the dominant pre-event water during drier conditions and event water during wetter conditions. Runoff coefficients also increase (from 0.07% to 1.72%) with antecedent rainfall.
6 Conclusions
The net climatic water balance for the study period was positive. Groundwater recharge from rainfall increases water table levels and maintains baseflow during dry periods. Unfortunately, changing morphological conditions at the river channel impeded continuous estimation of surface water discharge and, consequently, complete water balance dynamics.
Runoff composition changes according to landscape characteristics such as catchment size, slope, geology, stratigraphy and land use. In forested sub-catchments, permeable soils, stratigraphy and steep slopes favour subsurface stormflow generation. At catchment scale, smooth slopes, deeper soils and water table allow groundwater recharge during rainfall events. Total runoff is dominated by groundwater and baseflow under dry prior conditions. However, low soil infiltration capacity generates a larger surface runoff component under wet antecedent conditions.
The combined use of hydrometric tools with chemical and isotopic tracers in an integrated fashion is a novel approach for runoff generation research in tropical regions. Our results show that forested areas are important to reduce surface runoff and, thus, soil degradation. This is relevant for the design of water management plans in the study area.
Acknowledgements
The authors wish to thank the National Autonomous University of Nicaragua (UNAN-Managua) and the Nicaraguan Aquatic Resources Research Center (CIRA-UNAN) which granted the first author a study permit to conduct her PhD research. Also the National Water Authority of Nicaragua (ANA) is acknowledged for providing topographic GIS data. Many thanks to Dr. Jochen Wenninger (UNESCO-IHE) for performing the isotope analysis. Sincere thanks go also to UNESCO-IHE lab staff: Ferdi Bates, Lyzette Robemmont, Peter Heerings, Frank Wiegman and Fred Kruis, who assisted with the hydrochemical analyses.
Disclosure statement
No potential conflict of interest was reported by the authors.
Additional information
Funding
Related Research Data
References
- Allen, R.G., et al., 1998. Crop evapotranspiration. Guidelines for computing crop water requirements-FAO Irrigation and drainage paper 56. FAO, Rome, 300, 6541.
- Beck, H.E., et al., 2013. The impact of forest regeneration on streamflow in 12 mesoscale humid tropical catchments. Hydrology and Earth System Science, 17 (7), 2613–2635. doi:10.5194/hess-17-2613-2013
- Blume, T., Zehe, E., and Bronstert, A., 2007. Rainfall—runoff response, event-based runoff coefficients and hydrograph separation. Hydrological Sciences Journal, 52 (5), 843–862. doi:10.1623/hysj.52.5.843
- Blume, T., Zehe, E., and Bronstert, A., 2008a. Investigation of runoff generation in a pristine, poorly gauged catchment in the Chilean Andes II: qualitative and quantitative use of tracers at three spatial scales. Hydrological Processes, 22 (18), 3676–3688. doi:10.1002/hyp.6970
- Blume, T., et al., 2008b. Investigation of runoff generation in a pristine, poorly gauged catchment in the Chilean Andes I: a multi‐method experimental study. Hydrological Processes, 22 (18), 3661–3675. doi:10.1002/hyp.6971
- Bogaard, T., et al., 2012. Hydrological behaviour of unstable clay‐shales slopes: the value of cross‐disciplinary and multitechnological research at different scales. Hydrological Processes, 26 (14), 2067–2070. doi:10.1002/hyp.9454
- Bohté, R., et al., 2010. Hydrograph separation and scale dependency of natural tracers in a semi-arid catchment. Hydrology and Earth System Sciences Discussions, 7 (1), 1343–1372. doi:10.5194/hessd-7-1343-2010.
- Bonell, M., 1993. Progress in the understanding of runoff generation dynamics in forests. Journal of Hydrology, 150 (2–4), 217–275. doi:10.1016/0022-1694(93)90112-M
- Bonell, M., 1998. Selected challenges in runoff generation research in forests from the hillslope to headwater drainage basin scale. JAWRA Journal of the American Water Resources Association, 34 (4), 765–785. doi:10.1111/j.1752-1688.1998.tb01514.x
- Bonell, M. and Bruijnzeel, L.A., 2004. Forests, water and people in the humid tropics: past, present and future hydrological research for integrated land and water management. Cambridge: Cambridge University Press.
- Brooks, J.R., et al., 2010. Ecohydrologic separation of water between trees and streams in a Mediterranean climate. Nature Geosci, 3 (2), 100–104. doi:10.1038/ngeo722
- Bruijnzeel, L., 2001. Hydrology of tropical montane cloud forests: a reassessment. Land Use and Water Resources Research, 1 (1), 1.
- Buchanan, T. and Somers, W.. 1969. Discharge measurements at gaging stations. Techniques of water-resources investigations of the USGS. Washington, DC, 1–4.
- Burns, D., 2002. Stormflow-hydrograph separation based on isotopes: the thrill is gone ? What’s next?. Hydrological Processes, 16 (7), 1515–1517. doi:10.1002/hyp.5008
- Burt, T., et al., 1983. The natural history of Slapton Ley Nature Reserve XV: hydrological processes in the Slapton Wood catchment. Field Studies, 5 (5), 731–732.
- Caballero, L.A.. 2012. Hydrology, hydrochemistry and implications for water supply of a cloud forest in Central América. (PhD). Cornell University.
- Caballero, L.A., et al., 2013. Evaluating the bio-hydrological impact of a cloud forest in Central America using a semi-distributed water balance model. Journal of Hydrology and Hydromechanics, 61 (1), 9. doi:10.2478/jhh-2013-0003
- Calderon, H., Weeda, R., and Uhlenbrook, S., 2014. Hydrological and geomorphological controls on the water balance components of a mangrove forest during the dry season in the Pacific Coast of Nicaragua. Wetlands, 34 (4), 685–697. doi:10.1007/s13157-014-0534-1
- Calvo, J.C., 1986. An evaluation of Thornthwaite’s water balance technique in predicting stream runoff in Costa Rica. Hydrological Sciences Journal, 31 (1), 51–60. doi:10.1080/02626668609491027
- Capell, R., et al., 2011. Using hydrochemical tracers to conceptualise hydrological function in a larger scale catchment draining contrasting geologic provinces. Journal of Hydrology, 408 (1–2), 164–177. doi:10.1016/j.jhydrol.2011.07.034
- Cavelier, J., et al., 1997. Water balance and nutrient inputs in bulk precipitation in tropical montane cloud forest in Panama. Journal of Hydrology, 193 (1–4), 83–96. doi:10.1016/S0022-1694(96)03151-4
- Cey, E.E., et al., 1998. Quantifying groundwater discharge to a small perennial stream in southern Ontario, Canada. Journal of Hydrology, 210 (1–4), 21–37. doi:10.1016/S0022-1694(98)00172-3
- Chaves, J., et al., 2008. Land management impacts on runoff sources in small Amazon watersheds. Hydrological Processes, 22 (12), 1766–1775. doi:10.1002/hyp.6803
- CIRA. 2008. Disponibilidad actual y futura de los recursos hídricos en la franja costera del municipio de San Juan del Sur (Actual and future water resources availability in the coastal area of the municipality of San Juan del Sur. Managua: Centro para la Investigación en Recursos Acuáticos de Nicaragua.
- Clesceri, L.S., Greenberg, A.E., and Eaton, A.D., 1998. Standard Methods for the Examination of Water and Wastewater. 20th ed.Washington DC: APHA American Public Health Association.
- de Araújo, J.C. and González Piedra, J.I., 2009. Comparative hydrology: analysis of a semiarid and a humid tropical watershed. Hydrological Processes, 23 (8), 1169–1178. doi:10.1002/hyp.7232
- Didszun, J. and Uhlenbrook, S., 2008. Scaling of dominant runoff generation processes: Nested catchments approach using multiple tracers. Water Resources Research, 44 (2), W02410. doi:10.1029/2006WR005242
- Dingman, S.L., 2002. Physical hydrology. 2nd ed. New Jersey: Prentice Hall.
- Elming, S-A., Layer, P., and Ubieta, K., 2001. A palaeomagnetic study and age determinations of Tertiary rocks in Nicaragua, Central America. Geophysical Journal International, 147 (2), 294–309. doi:10.1046/j.0956-540x.2001.01526.x
- Elsenbeer, H., 2001. Hydrologic flowpaths in tropical rainforest soilscapes? A review. Hydrological Processes, 15 (10), 1751–1759. doi:10.1002/hyp.237
- Elsenbeer, H. and Vertessy, R.A., 2000. Stormflow generation and flowpath characteristics in an Amazonian rainforest catchment. Hydrological Processes, 14 (14), 2367–2381. doi:10.1002/1099-1085(20001015)14:14.<2367::AID-HYP107>3.0.CO;2-H
- Elsenbeer, H., Lack, A., and Cassel, K., 1995a. Chemical fingerprints of hydrological compartments and flow paths at La Cuenca, Western Amazonia. Water Resources Research, 31 (12), 3051–3058. doi:10.1029/95WR02537
- Elsenbeer, H., Lorieri, D., and Bonell, M., 1995b. Mixing model approaches to estimate storm flow sources in an overland flow-dominated tropical rain forest catchment. Water Resources Research, 31 (9), 2267–2278. doi:10.1029/95WR01651
- Genereux, D., 2004. Comparison of naturally-occurring chloride and oxygen-18 as tracers of interbasin groundwater transfer in lowland rainforest, Costa Rica. Journal of Hydrology, 295 (1–4), 17–27. doi:10.1016/j.jhydrol.2004.02.020
- Genereux, D.P. and Hooper, R.P., 1998. Chapter 10 – Oxygen and hydrogen isotopes in rainfall-runoff studies A2 – Kendall, Carol. In: Mcdonnell, J.J., ed. Isotope tracers in catchment hydrology. Amsterdam: Elsevier, 319–346. doi:10.1016/B978-0-444-81546-0.50017-3
- Germer, S., et al., 2009. Implications of long-term land-use change for the hydrology and solute budgets of small catchments in Amazonia. Journal of Hydrology, 364 (3–4), 349–363. doi:10.1016/j.jhydrol.2008.11.013
- Germer, S., et al., 2010. Influence of land-use change on near-surface hydrological processes: undisturbed forest to pasture. Journal of Hydrology, 380 (3–4), 473–480. doi:10.1016/j.jhydrol.2009.11.022
- Goller, R., et al., 2005. Tracing water paths through small catchments under a tropical montane rain forest in south Ecuador by an oxygen isotope approach. Journal of Hydrology, 308 (1–4), 67–80. doi:10.1016/j.jhydrol.2004.10.022
- Guerrero, J.-L., et al., 2012. Temporal variability in stage–discharge relationships. Journal of Hydrology, 446–447 (0), 90–102. doi:10.1016/j.jhydrol.2012.04.031
- Häggström, M., et al., 1990. Application of the HBV model for flood forecasting in six Central American rivers. Sweden: SMHI Norrköping.
- Harmon, R.S., et al., 2009. Geochemistry of four tropical montane watersheds, Central Panama. Applied Geochemistry, 24 (4), 624–640. doi:10.1016/j.apgeochem.2008.12.014
- Hoeg, S., Uhlenbrook, S., and Leibundgut, C., 2000. Hydrograph separation in a mountainous catchment ? combining hydrochemical and isotopic tracers. Hydrological Processes, 14 (7), 1199–1216. doi:10.1002/(SICI)1099-1085(200005)14:7<1199::AID-HYP35>3.0.CO;2-K
- Holder, C.D., 2004. Rainfall interception and fog precipitation in a tropical montane cloud forest of Guatemala. Forest Ecology and Management, 190 (2–3), 373–384. doi:10.1016/j.foreco.2003.11.004
- Holdridge, L.R., 1967. Life zone ecology. Rev. ed. Costa Rica: Tropical Science Center.
- Hölscher, D., et al., 2003. Nutrient fluxes in stemflow and throughfall in three successional stages of an upper montane rain forest in Costa Rica. Journal of Tropical Ecology, 19 (05), 557–565. doi:10.1017/S0266467403003614
- Hölscher, D., et al., 2004. The importance of epiphytes to total rainfall interception by a tropical montane rain forest in Costa Rica. Journal of Hydrology, 292 (1–4), 308–322. doi:10.1016/j.jhydrol.2004.01.015
- Hooper, R.P., Christophersen, N., and Peters, N.E., 1990. Modelling streamwater chemistry as a mixture of soilwater end-members—an application to the Panola Mountain catchment, Georgia, USA. Journal of Hydrology, 116 (1–4), 321–343. doi:10.1016/0022-1694(90)90131-G
- House, W.A. and Warwick, M.S., 1998. Hysteresis of the solute concentration/discharge relationship in rivers during storms. Water Research, 32 (8), 2279–2290. doi:10.1016/S0043-1354(97)00473-9
- Hrachowitz, M., et al., 2011. On the value of combined event runoff and tracer analysis to improve understanding of catchment functioning in a data-scarce semi-arid area. Hydrology and Earth System Sciences, 15 (6), 2007–2024. doi:10.5194/hess-15-2007-2011
- Hugenschmidt, C., et al., 2010. Hydrochemical analysis of stream water in a tropical, mountainous headwater catchment in northern Thailand. Hydrology and Earth System Sciences Discussions, 7 (2), 2187–2220. doi:10.5194/hessd-7-2187-2010
- Hugenschmidt, C., et al., 2014. A three-component hydrograph separation based on geochemical tracers in a tropical mountainous headwater catchment in northern Thailand. Hydrology and Earth System Sciences, 18 (2), 525–537. doi:10.5194/hess-18-525-2014
- Klaus, J. and McDonnell, J.J., 2013. Hydrograph separation using stable isotopes: review and evaluation. Journal of Hydrology, 505 (0), 47–64. doi:10.1016/j.jhydrol.2013.09.006
- Krasny, J. and Hecht, G., 1998. Estudios hidrogeológicos e hidroquímicos de la Región del Pacífico de Nicaragua (Hydrogeologic and hydrochemical studies of the Pacific Region of Nicaragua). Managua: INETER.
- Ley General de Aguas Nacionales. Ley No. 620 (General Law of National Waters. Law No. 620) 2007. Managua.
- Lyon, S.W., Desilets, S.L.E., and Troch, P.A., 2009. A tale of two isotopes: differences in hydrograph separation for a runoff event when using δD versus δ18O. Hydrological Processes, 23 (14), 2095–2101. doi:10.1002/hyp.7326
- Magaña, V., Amador, J.A., and Medina, S., 1999. The midsummer drought over Mexico and Central America. Journal of Climate, 12 (6), 1577–1588. doi:10.1175/1520-0442(1999)012<1577:TMDOMA>2.0.CO;2
- McDonnell, J.J., 1990. A rationale for old water discharge through macropores in a steep, humid catchment. Water Resources Research, 26 (11), 2821–2832. doi:10.1029/WR026i011p02821
- Mendoza, J.A., Dahlin, T., and Barmen, G., 2006. Hydrogeological and hydrochemical features of an area polluted by heavy metals in central Nicaragua. Hydrogeology Journal, 14 (6), 1052–1059. doi:10.1007/s10040-006-0098-0
- Mortatti, J., et al., 1997. Hydrograph separation of the amazon river using 18O as an isotopic tracer. Scientia Agricola, 54, 167–173. doi:10.1590/S0103-90161997000200009
- Mul, M.L., et al., 2008. Hydrograph separation using hydrochemical tracers in the Makanya catchment, Tanzania. Physics and Chemistry of the Earth, Parts A/B/C, 33 (1–2), 151–156. doi:10.1016/j.pce.2007.04.015
- Muñoz-Villers, L.E. and McDonnell, J.J., 2013. Land use change effects on runoff generation in a humid tropical montane cloud forest region. Hydrology and Earth System Sciences, 17 (9), 3543–3560. doi:10.5194/hess-17-3543-2013
- Munyaneza, O., Wenninger, J., and Uhlenbrook, S., 2012. Identification of runoff generation processes using hydrometric and tracer methods in a meso-scale catchment in Rwanda. Hydrology and Earth System Sciences, 16 (7), 1991–2004. doi:10.5194/hess-16-1991-2012
- Niedzialek, J.M. and Ogden, F.L., 2012. First-order catchment mass balance during the wet season in the Panama Canal Watershed. Journal of Hydrology, 462–463 (0), 77–86. doi:10.1016/j.jhydrol.2010.07.044
- Paulhus, J.L. and Kohler, M.A., 1952. Interpolation of missing precipitation records. Monthly Weather Review, 80, 129–133.
- Rawls, W., et al., 1996. Hydrology handbook. Vol. 28. New York: American Society of Civil Engineering.
- Rhodes, A.L., Guswa, A.J., and Newell, S.E., 2006. Seasonal variation in the stable isotopic composition of precipitation in the tropical montane forests of Monteverde, Costa Rica. Water Resources Research, 42 (11), W11402. doi:10.1029/2005WR004535
- Roa-García, M. and Weiler, M., 2010. Integrated response and transit time distributions of watersheds by combining hydrograph separation and long-term transit time modeling. Hydrology and Earth System Sciences, 14 (8), 1537–1549. doi:10.5194/hess-14-1537-2010
- Salemi, L.F., et al., 2013. Land-use change in the Atlantic rainforest region: consequences for the hydrology of small catchments. Journal of Hydrology, 499 (0), 100–109. doi:10.1016/j.jhydrol.2013.06.049
- Schellekens, J., et al., 2004. Stormflow generation in a small rainforest catchment in the Luquillo Experimental Forest, Puerto Rico. Hydrological Processes, 18 (3), 505–530. doi:10.1002/hyp.1335
- Sivapalan, M., et al., 2003. IAHS Decade on Predictions in Ungauged Basins (PUB), 2003–2012: Shaping an exciting future for the hydrological sciences. Hydrological Sciences Journal, 48 (6), 857–880. doi:10.1623/hysj.48.6.857.51421
- Sklash, M.G. and Farvolden, R.N., 1979. The role of groundwater in storm runoff. Journal of Hydrology, 43 (1–4), 45–65. doi:10.1016/0022-1694(79)90164-1
- Swain, F., 1966. Bottom sediments of lake Nicaragua and lake Managua, Western Nicaragua. Journal of Sedimentary Research, 36 (2), 522–540.
- Uhlenbrook, S., 2006. Catchment hydrology—a science in which all processes are preferential. Hydrological Processes, 20 (16), 3581–3585. doi:10.1002/hyp.6564
- Uhlenbrook, S. and Hoeg, S., 2003. Quantifying uncertainties in tracer-based hydrograph separations: a case study for two-, three- and five-component hydrograph separations in a mountainous catchment. Hydrological Processes, 17 (2), 431–453. doi:10.1002/hyp.1134
- Uhlenbrook, S. and Leibundgut, C., 2002. Process-oriented catchment modelling and multiple-response validation. Hydrological Processes, 16 (2), 423–440. doi:10.1002/hyp.330
- Uhlenbrook, S., et al., 2002. Hydrograph separations in a mesoscale mountainous basin at event and seasonal timescales. Water Resources Research, 38 (6), 31-1–31-14. doi:10.1029/2001WR000938
- UNA, 2003. Actualización del estado del recurso suelo y capacidad de uso de la tierra del municipio de San Juan del Sur. Managua: Universidad Nacional Agraria.
- Weiler, M., et al., 2006. Subsurface Stormflow. In: Anderson, M.G., ed. Encyclopedia of hydrological sciences. New York: John Wiley & Sons.
- Wels, C., Cornett, R.J., and Lazerte, B.D., 1991. Hydrograph separation: a comparison of geochemical and isotopic tracers. Journal of Hydrology, 122 (1–4), 253–274. doi:10.1016/0022-1694(91)90181-G
- Wenjie, L., et al., 2011. Runoff generation in small catchments under a native rain forest and a rubber plantation in Xishuangbanna, southwestern China. Water and Environment Journal, 25 (1), 138–147. doi:10.1111/j.1747-6593.2009.00211.x
- Wenninger, J., et al., 2004. Experimental evidence of fast groundwater responses in a hillslope/floodplain area in the Black Forest Mountains, Germany. Hydrological Processes, 18 (17), 3305–3322. doi:10.1002/hyp.5686
- Westerberg, I., et al., 2010. Precipitation data in a mountainous catchment in Honduras: quality assessment and spatiotemporal characteristics. Theoretical and Applied Climatology, 101 (3–4), 381–396. doi:10.1007/s00704-009-0222-x
- Westerberg, I., et al., 2011. Stage-discharge uncertainty derived with a non-stationary rating curve in the Choluteca River, Honduras. Hydrological Processes, 25 (4), 603–613. doi:10.1002/hyp.7848
- Zimmermann, A., Zimmermann, B., and Elsenbeer, H., 2009. Rainfall redistribution in a tropical forest: spatial and temporal patterns. Water Resources Research, 45 (11), W11413. doi:10.1029/2008WR007470
Appendix A
Geology and landscape characteristics of the study area.
Figure A1. Travertine deposits encountered during the dry season 2011 at the headwaters of the catchment.
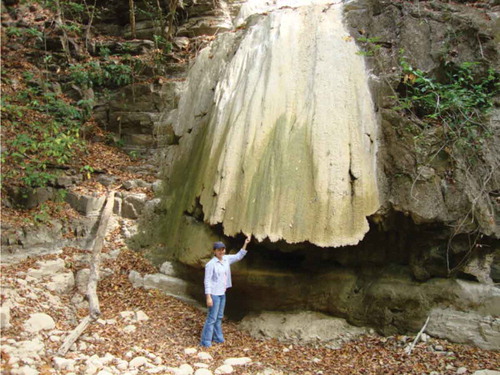
Figure A2. Different landscape characteristics at sub-catchment (a) and catchment (b) level.
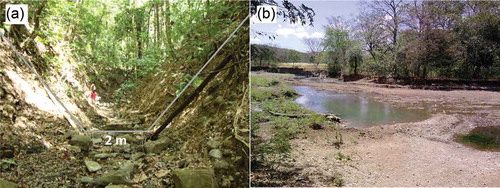
Figure A3. River baseflow during dry season 2012 in the upper catchment area.