
ABSTRACT
Hydro-meteorological drought was assessed with respect to climate change over an estuary catchment Vu Gia-Thu Bon in Central Vietnam, which economy is dependent on agriculture. The fully-distributed hydrological model MIKE SHE was used to simulate river flow over the study region for the period 1991–2010. Drought were assessed using the Standardized Precipitation Index and the Standardized Runoff Index. The future climate was studied using the regional climate model Weather Research and Forecasting by downscaling an ensemble of three global climate models – CCSM3.0, ECHAM5 and MIROC-medium resolution over current (1961–1990) and future climates (2011–2040), under the A2 emissions scenario. The results suggest that, despite hotter and wetter future climate, the area is likely to suffer more from severe and extreme droughts, increasing about 100% in the median range for drought characteristics. Thus, there is a need for proper adaptation and planning for water resources management in this region.
EDITOR:
ASSOCIATE EDITOR:
1 Introduction
The Intergovernmental Panel on Climate Change (IPCC) Fifth Assessment Report (AR5) (IPCC 2013) states that the global mean surface temperature has increased since the late nineteenth century and the decade of the 2000s has been the warmest. It also reports that it is “virtually certain” that maximum and minimum temperatures over land have increased on a global scale since 1950. With respect to precipitation, the latest climate projections indicate that increases in precipitation extremes related to the monsoon are very likely in most regions of the world, especially Southeast Asia. Rainfall increases may be up to 40% by the end of the century over many regions of Southeast Asia, while some areas may also see decreases (IPCC (Intergovernmental Panel on Climate Change) Citation2013). Increased heating from global warming may not cause droughts but it is expected that when droughts occur they are likely to set in quicker and be more intense (Trenberth et al. Citation2013). Precipitation extremes (too much or too little rain) may also increase in intensity over many regions in response to warming climates (Kharin et al. Citation2007, Lenderink and Van Meijgaard Citation2008). A study by Dai (Citation2012) also suggested the likelihood of severe and widespread droughts in the next 30–90 years over many land areas, resulting from either decreased precipitation and/or increased evaporation.
Drought is a natural phenomenon having harsh consequences on lives and ecosystems, and is defined as a “prolonged absence or marked deficiency of precipitation” (Trenberth et al. Citation2013). Several researchers have studied the impact of global warming on drought patterns (Al-Qinna et al. Citation2011, Liu et al. Citation2012, Sienz et al. Citation2012). According to the classification by Dai (Citation2011), there are three types of drought: meteorological, hydrological and agricultural. Meteorological drought is a period of months to years with below-normal precipitation; hydrological drought occurs when river streamflow and water storages in aquifers, lakes or reservoirs fall below long-term mean levels; and hydrological drought develops more slowly because it involves stored water that is reduced but not replenished. Lack of rainfall often triggers hydrological droughts (Dai Citation2011). The two most popular drought indices used to assess meteorological and hydrological drought are the Standardized Precipitation Index (SPI) and the Standardized Runoff Index (SRI).
The hydrological model used in this paper is MIKE SHE, developed by the Danish Hydraulics Institute (DHI). The MIKE SHE model has been used for analysis, planning and management of a wide range of water resources, and environmental and ecological problems related to surface water and groundwater. MIKE SHE has full capability of simulating the hydrological systems in coastal areas, globally. Leach and Moore (Citation2015) applied MIKE SHE to model the hillslope throughflow temperature in a coastal forested catchment. Dai et al. (Citation2010) evaluated the MIKE SHE model for a forested watershed on the South Carolina coastal plain, USA. Sahoo et al. (Citation2006) calibrated the MIKE SHE model to predict flash floods in a mountainous region over a coastal area in Hawaii. Thompson et al. (Citation2004b) applied this model to simulate the hydrology in coastal wet grassland in southeast England and reported good results in simulating surface flooding, groundwater and flow in the channel.
Lying in the northern part of Southeast Asia, Vietnam has a long coastline of about 3300 km. Because of its geographical position, in the tropical monsoon season, the country experiences annual storms inducing flooding during summer, with about 70–80% of rainfall occurring during this period. During winter and spring, drought occurs in many other parts of Vietnam. Being an agriculturally dependent country, Vietnam is highly vulnerable to climate change and is not well adapted yet to cope with extreme changes. Only a small number of scientific studies have been carried out to assess the impacts of climate changes in Vietnam. Khoi and Suetsugi (Citation2014) studied the climate and land-use change using the Mann-Kendall trend test on observed data over the Be River catchment (Vietnam). They found positive changes in annual streamflow and sediment load stronger than land-use change. In another study, for the same river basin, Khoi and Suetsugi (Citation2012) applied statistical downscaling and found an increase in annual temperatures of 1 to 2.9°C and −4 to 0.7% changes in annual precipitation, corresponding to a change in streamflow of −6% to −0.4%. In our recent studies, we have focused on dynamical downscaling over Vietnam (Raghavan et al. Citation2016) and applied the downscaled outputs to assess the hydrological response over some river basins in Vietnam, such as the Da River basin in a transboundary region (Vu et al. Citation2016); the Sesan River basin in the central highlands (Vu et al. Citation2012, Citation2015); and recently over the same Vu Gia–Thu Bon river basin (Vo et al. 2016a, 2016b). In many cases, we found that the river flow increases during the flood season, which affects agriculture and people’s livelihoods. However, we have not studied in detail the severity of the dry-season low flow, which impacts on the water resources and the environment. Therefore, this study is probably one of the first to study the application of drought extent over a coastal river basin in Vietnam with application of a regional climate model.
The remainder of the paper is structured as follows: Section 2 describes the in situ and gridded data used in the study; Section 3 explains the models and methodology; Section 4 presents the results; and a discussion is presented and conclusions made in Section 5.
2 Study region and data
2.1 Study region
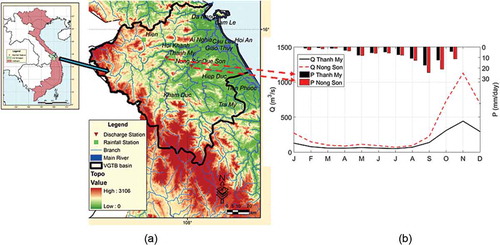
The study region, the Vu Gia–Thu Bon (VGTB) basin, is a river system joined by two main rivers: the Vu Gia and Thu Bon ()). The watershed area of the Vu Gia River formed by the control station Thanh My is 1850 km2, with an annual average discharge of about 120 m3/s. Similarly, the Nong Son watershed in the Thu Bon River forms an area of about 3150 km2, and the annual average discharge is approx. 270 m3/s (more than twice that at Thanh My, due to its larger catchment area). The combined watershed area of the VGTB basin is about 10 350 km2. This region has complex topography, with narrow mountainous land upstream on the western side and a flat estuary at the downstream end to the east. Located in a tropical monsoon climate region with an influence of easterly winds from the ocean that bring moisture inland, this region experiences relatively warm winters, dry summers and a strong monsoon, with typhoons lasting from September to December, which also coincides with the rainy season (Souvignet et al. Citation2013). The total annual rainfall ranges from 2000 to 4000 mm/year and about 65–80% of the annual rainfall occurs during the rainy season. The annual cycle of precipitation and river runoff at Nong Son and Thanh My stations is shown in ). During the dry period (January–August), drought is very common.
Figure 1. (a) Rainfall and two river gauging stations, with river network in study region. (b) Annual cycle of precipitation and river runoff at Thanh My and Nong Son stations for the period 1991–2010.
The VGTB region relies heavily on agriculture, especially rice production. After the strong El Niño years in 1991 and 1997, and mild El-Niño episodes during 1994 and 2002 (Vu et al. Citation2013), this area suffered severe to extreme drought conditions that resulted in a decline of rice production (Nguyen et al. Citation2005). There have been quite a number of studies about severe flooding over the VGTB river system, as well as central Vietnam, locally and internationally (Fink et al. Citation2013, Souvignet et al. Citation2013, Khoi and Suetsugi Citation2014, Nam et al. Citation2014, Vo and Gourbesville 2016, Vo et al. 2016). However, no single research has focused on the drought situation for this river basin, given the very long dry spell over the dry season. Drought has already had significant impacts on agricultural production in this area.
Therefore, this study focuses on quantifying the impact of climate change using information from regional climate models (RCMs) to characterize the drought events using streamflow drought indices over the VGTB river basin. The output of the study, which shows the variations of drought characteristics at future time scales, might be a useful contribution to policy makers and stakeholders for devising adaptive measures.
2.2 Meteorological and hydrological data
In situ daily precipitation data for the period 1991–2010 from 15 rainfall stations in the VGTB basin were used in the study. This dataset was obtained from the Institute of Meteorology, Hydrology and Environment (IMHEN), Ministry of Natural Resources and Environment (MONRE), Vietnam. The network of raingauge stations in the VGTB basin is sparse, about one station for every 700 km2. The daily rainfall data were aggregated to monthly rainfall for calculating the meteorological drought index, SPI.
Evapotranspiration data form an important input to the hydrology model. There are a few popular methods that estimate potential evapotranspiration (PET), such as the Penman-Monteith (PM) method (Monteith Citation1965, Allen Citation1986), the Priestley-Taylor method (Priestley and Taylor Citation1972) and the Thornthwaite method (Thornthwaite Citation1948). Although the PM method is highly recommended to compute evapotranspiration for the study area (Vu et al. Citation2008), it requires many input data, such as daily mean temperature, wind speed, relative humidity and solar radiation. In another study, the Thornthwaite and PM methodologies have been compared as inputs to the Palmer Drought Index Severity (PDSI) in a study by van der Schrier et al. (Citation2011). These authors concluded that both methods produce similar PDSI values in terms of correlation, regional averages and trends, and in terms of identifying extremely dry or wet months. Due to weather variable limitations in the RCM output, in this study, we utilized the Thornthwaite method to estimate PET, as this approach only requires average temperature (Thornthwaite Citation1948). The baseline and projected PET are, therefore, estimated accordingly. The R package SPEI (Begueria and Vicente-Serrano Citation2013) was used to compute PET using monthly mean temperature based on the Thornthwaite approach.
The daily river discharge at Thanh My gauging station (Vu Gia catchment) and Nong Son gauging station (Thu Bon catchment) for the above period was also obtained from IMHEN. This served as calibration and validation datasets for the hydrological model MIKE SHE. The monthly data aggregated from the daily runoff were used as an input for constructing the hydrological drought index, SRI. Locations of the rainfall and river gauging stations are displayed in Figure 1(b).
2.3 Spatial data input for MIKE SHE model
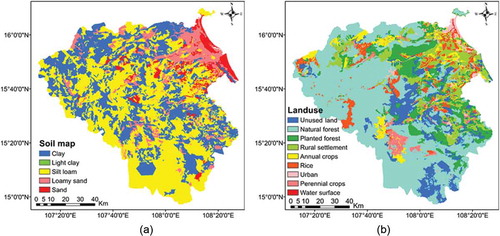
The spatial input data required for the MIKE SHE model consist of a digital elevation model (DEM) ()), which was taken from the US National Aeronautics and Space Administration (NASA) Shuttle Radar Topography Mission (SRTM) 3 arcsecond (approx. 90 m), in which digital elevation data were obtained on a near-global scale to generate the most complete high-resolution digital topographic database of the Earth (Farr and Kobrick Citation2000). The land-use and soil maps were obtained locally from the Ministry of Agriculture and Rural Development, Vietnam (). The input data are defined with nine types of land use and five types of soil () and (b)).
Figure 2. Distribution of (a) soil (b) land use over the Vu Gia–Thu Bon basin.
2.4 Gridded precipitation dataset
In order to assess the rainfall data at the spatial scale, this study used a gridded observational dataset – APHRODITE (Asian Precipitation Highly Resolved Observational Data Integration Towards Evaluation of water resources data). According to Vu et al. (Citation2012), this dataset has good agreement with in situ data over the central highland region of Vietnam, which is the neighbour of the VGTB basin. The APHRODITE dataset was considered for this study to overcome the limitation of not having sufficient station data over the study region. The APHRODITE dataset was developed by the Research Institute for Humanity and Nature and the Meteorological Research Institute of Japan. It provides 0.25° resolution information on rainfall and surface temperature over monsoonal Asia at a daily time scale for the period 1961–2007. The APHRODITE dataset was created primarily with data obtained from raingauge observation networks. The basic algorithm was adopted in Xie et al. (Citation2007). More information can be found in Yatagai et al. (Citation2012).
3 Models and metrics
3.1 Regional climate model: Weather Research and Forecasting (WRF)
Developed at the National Center for Atmospheric Research (NCAR) in the USA, the WRF model is suitable for a broad spectrum of applications across scales ranging from metres to thousands of kilometres. The model incorporates advanced numeric and data-assimilation techniques, multiple nesting capabilities and numerous state-of-the-art physics options. Additional information can be obtained from http://www.wrf-model.org.
The WRF model used in this study, at a spatial resolution of 30 km, was initialized on 00Z 1 January 1960, and the simulation was continued until 18Z 31 December 1990. The WRF model was first driven by the reanalysis data ERA40 (European Reanalysis 40 years) as lateral boundary conditions for the baseline period 1961–1990. The first year of WRF model simulations was run as spin-up time. The physical parameterizations used are the Grell cumulus scheme (Grell Citation1993), the Thomson microphysics scheme (Thompson et al. Citation2004a), the Yonsei University planetary boundary layer scheme (Hong and Pan Citation1996), the Rapid Radiative Transfer Model (RRTM) for longwave and shortwave radiation, and the four-layer soil moisture and temperature Noah Land Surface model (Chen and Dudhia Citation2001). Gridded observation and station data were used for model validation for the baseline period. These are high-resolution (0.5°) monthly datasets for precipitation and temperature developed at the Climatic Research Unit (CRU) at the University of East Anglia, UK (New et al. Citation1999, Citation2000, Mitchell and Jones Citation2005), and the 0.25° daily precipitation APHRODITE dataset as mentioned Section 2.4. Daily station data for precipitation and temperature were also obtained from stations in Vietnam. A detailed discussion on the performance of the WRF model over Vietnam can be found in one of our earlier studies (Raghavan et al. Citation2016). The WRF model was subsequently driven by three global climate models (GCMs), the Community Climate System Model (CCSM) version 3.0, the Max Planck Institute ECHAM5 and the Japanese GCM MIROC medium resolution (medres) for both the baseline (current) (1961–1990) and future climates (2011–2040), forced under the IPCC A2 future greenhouse gas emissions scenario. For simplicity in reading, the simulations of the WRF model driven by the GCMs CCSM, ECHAM and MIROC are referred to in this paper as WRF/CCSM, WFR/ECHAM and WRF/MIROC, respectively. The ensemble of these three GCMs provides an uncertainty range of the future climate, as well as representing different climate sensitivities.
3.2 Hydrological model: MIKE SHE
The hydrological model used in this study is the fully-distributed model MIKE SHE, developed by the Danish Hydraulics Institute, DHI. The MIKE SHE model covers the major processes in hydrological cycles and includes evapotranspiration, overland flow, unsaturated flow, groundwater flow, channel flow and their interactions. Each of these processes can be represented at different levels of spatial distribution and complexity, according to the goals of the modelling study (Butts et al. Citation2004). The representation of catchment characteristics and input data is provided through the discretization of the catchment horizontally into an orthogonal network of grid squares. Within each grid square, the vertical variations in soil and hydro-geological characteristics are described in a number of horizontal layers with variable depths. In this study, precipitation and computed reference evapotranspiration are the two main weather variables used as inputs to the MIKE SHE model for both baseline and climate projection.
The MIKE SHE model calibration employed all available components, such as overland flow, river and lake, unsaturated and saturated flow. This described the most accurate hydrological cycle in the VGTB catchment. Calibration was carried out to find an optimal set of parameter values that simulate the behaviour of the watershed accurately, with particular focus on low flow (Cunge Citation2003, Guinot and Gourbesville Citation2003). Due to the difficulty in calibrating a fully-distributed model that has many components, only a few sensitive parameters were chosen for the calibration process. These parameters were based on sensitivity analysis, which was done manually. The sensitivity analysis quantified the dependent rate of runoff on the change in these parameters. More details on the model calibration process and optimal parameters can be found in Vo and Gourbesville (2016) and Vo et al. (2016).
3.3 Standardized Precipitation Index (SPI)
The SPI is one of the widely known indicators for meteorological drought. It was first introduced by McKee et al. (Citation1993) by analysing historical monthly precipitation. A set of averaging periods is selected on a moving window basis to determine a set of periods of i months (i = 3, 6, 12, 24, 48). Each dataset is fitted to the Gamma distribution function then transformed to the normal distribution for easy comparison between locations. Details on the computation of SPI have been documented in our previous study (Vu et al. Citation2015). The advantage of SPI is that it only requires precipitation data as input, which makes it ideal for areas where data collection is not extensive. The SPI is considered as the most appropriate index for monitoring the variability of droughts as it is easily adapted to local climate, has modest data requirements, and can be computed at almost any time scale (Ntale and Gan Citation2003). The SPI has been suggested for use as a universal meteorological drought index for more effective drought monitoring and climate risk management (WMO 2009). In our previous study, we discussed the limitation of short record length using 15 years of data when computing SPI for the study region of the central highlands of Vietnam (Vu et al. Citation2015). In another study, of Salt Creek watershed in Illinois (USA), Wang et al. (Citation2011) applied 10 years of data to simulate SPI and SRI drought indices. In this study, we applied 20 years of data to formulate the drought indices. The drought classification based on SPI is shown in .
3.4 Standardized Runoff Index (SRI)
The SRI complements the SPI for studying the hydrological aspects of drought. Although SRI and SPI employ similar concepts when based on long accumulation periods, the SRI incorporates hydrological processes that determine seasonal lags in the influence of climate on streamflow. The input for SRI is river runoff. When applied for river runoff in the USA, Shukla and Woods (2008) found that the two-parameter lognormal (LN2) distribution provided a better fit at high extremes than the Gamma distribution (which may perform better at low flow). However, the probability distribution function selected depends on the data series. We did the sensitivity study for this region by applying both Gamma and LN2 distribution functions to calculate SRI. The correlation between two SRIs computed from these two distributions is 0.999 and the RMSE is 0.04 (unitless). As the two distribution functions are very similar in generating the SRI, we chose to follow the Gamma distribution function to calculate the SRI later on. The drought classification for SRI is similar to SPI, as shown in .
Table 1. SPI/SRI drought classification. Adapted from McKee et al. (Citation1993).
In this study, we chose a range of accumulation periods of 1, 3, 6 and 12 months for SPI and SRI computations to assess the meteorological and hydrological droughts.
3.5 Methodology
The fully-distributed hydrological model MIKE SHE was calibrated and validated over a period of 20 years (1991–2010) using 15 rainfall stations and two gauging discharge station at Thanh My and Nong Son. The Nash-Sutcliffe efficiency criterion (NSE) (Nash and Sutcliffe Citation1970) and the coefficient of determination (R2), which is defined by the squared value of the coefficient of correlation according to Bravais-Pearson, were used as the benchmarking indices for the simulation of runoff. In addition, as this study focuses on low flow, we applied two other criteria that emphasize low flow. They are NSE applied to Q0.2 and root mean square error (RMSE) applied to ln(Q). For details of these low-flow indices, readers are referred to Nicolle et al. (Citation2014).
The use of these correlation indices in hydrology is discussed in Krause et al. (Citation2005). The R2 ranges from 0 to 1, in which 1 is the best match. The NSE shows the skill of the estimate relative to a reference and it varies from –∞ to 1 (perfect match). The NSE for Q0.2, therefore, ranges from – ∞ to 1 and the RMSE is best when it is close to 0.
The simulated runoff at Thanh My and Nong Son gauges was used to calculate the SRI. The meteorological and hydrological droughts over the study region were assessed by analysing SPI and SRI and compared against historical records. The MIKE SHE model was then used to derive future runoff from projected rainfall obtained from the climate model simulations, WRF/CCSM, WRF/ECHAM and WRF/MIROC. Projections of SPI and SRI were used to compare against the baseline climate to assess the change in drought for the study region under a changing climate. Two drought characteristics were analysed in this study: (a) the number of drought months (unit: months) and (b) the total drought severity/deficit (unitless, as this is a summation of SPI/SRI values for drought). The drought characteristics were computed for three categories of drought index (as given in ) – moderate (medium) drought, severe drought and extreme drought – for the baseline and as a projection for all 15 in situ rainfall stations and two hydrological gauge stations. To assess the impact of climate change on drought characteristics, the relative anomaly between projection and baseline climate was computed based on the following equation:
where F represents the future climate drought characteristics; P represents the baseline climate characteristics for the RCM; and ⊿ is the relative anomaly (%), which represents the relative change in climate over the period 2011–2040 compared to the baseline climate (1961–1990).
4 Results and discussion
4.1 Hydrological model performance
4.1.1 Model calibration and validation
The MIKE SHE hydrological model was calibrated on the period 1991–2000 and validated on 2001–2010. shows the calibration and validation results at the two gauging stations at both daily (a1) and (b1)) and monthly scales (a2) and (b2)). The calibrated NSE and R2 for Nong Son station at the daily scale were 0.81 and 0.83, respectively, higher than those at Thanh My station (0.79 and 0.80); similar results were derived from the validation process. This is taken as a good fit indicator for performance, as such values have been obtained for hydrological modelling at the daily time scale for rainfall information. In a similar calculation for the monthly time scale, the goodness-of-fit tests showed a good match, with corresponding values of around 0.9. The values of these indices are given in (a).
Table 2. Goodness-of-fit tests for low flow in calibration and validation periods in the MIKE SHE model: (a) R2 and NSE on Q; and (b) RMSE on ln(Q) and SE on Q0.2.
Figure 3. Calibration (1991–2000) and validation (2001–2010) of the MIKE SHE model at (a) Thanh My station and (b) Nong Son station at (1) daily and (2) monthly scales.
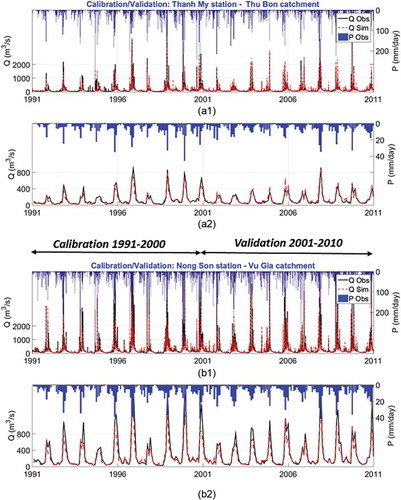
In addition to the goodness-of-fit measures for river flow, we validated the model based on the goodness of fit for low flow using NSE on Q0.2 and RMSE on ln(Q). The validated monthly NSE on Q0.2 values for Thanh My and Nong Son stations are 0.85 and 0.92, respectively, indicating a good fit. The RMSE for validated monthly ln(Q) also showed a good fit, with values of 0.30 and 0.27, respectively. Detailed test results for both daily and monthly scales are shown in (b). The monthly results were subsequently used to compute drought indices for further analysis in the study.
4.1.2 Flow duration curve
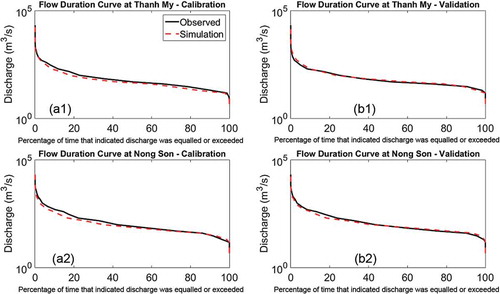
The flow duration curve (FDC) is a cumulative frequency curve that shows the percentage of time during which specified discharges were equalled or exceeded in a given period (Searcy Citation1959). The FDCs of Thanh My and Nong Son gauging stations are displayed in for calibration and validation periods at the daily scale. The high (Q5) and low flows (Q95) are represented by the flow values that are exceeded 5% and 95% of the time, respectively. By using the FDC, the hydrological model simulation (dashed line) is able to show the distribution of high and low flows compared with the observed station data (solid line). The Q5 and Q95 were captured well by the model, which suggests that the MIKE SHE hydrological model was able to simulate flood and low flow well.
Figure 4. Flow duration curve for (a) calibration and (b) validation periods of the MIKE SHE model at (1) Thanh My station and (2) Nong Son station at the daily scale.
4.2 Historical drought
4.2.1 Hydrological drought
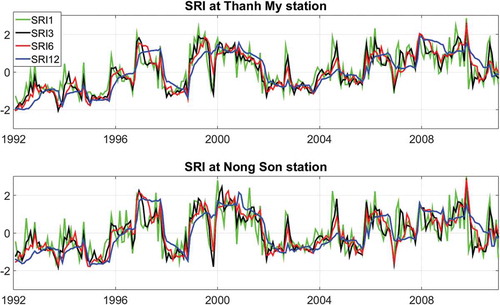
displays the time series of SRI using the accumulation of 1, 3, 6 and 12 months for the period 1991–2010 using simulated runoff at Nong Son and Thanh My gauging stations. When the time periods are small (1, 3, 6 months), the SRI values are frequently above or below zero. However, when the time is increased to 12 months, the SRI responds more slowly to changes in streamflow. There are fewer negative SRI values, and, as well as being positive, they are longer in duration. The dotted line at the threshold value of –1 was used to identify moderate drought, as classified in . The simulated SRI clearly identified the severe droughts in 1992, 1994, 1998 and 2002, and the very wet (flood) years of 1997, 2001 and 2009.
Figure 5. Simulated SRI with 1-, 3-, 6- and 12-month accumulation periods for (a) Thanh My station and (b) Nong Son station.
4.2.2 Meteorological drought
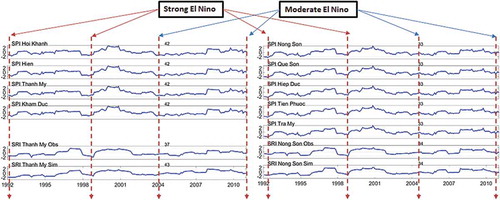
presents the computation using 12-month SPI and SRI at upstream rainfall stations and two discharge gauging stations in the Vu Gia and Thu Bon catchments, respectively. The time axis is from 1992 to 2010 because the first 12 months are used for initialization, hence the SPI/SRI values start from 1992 instead of 1991 for the 1991–2010 period. The SPI-12 at all upstream stations and SRI-12 at the corresponding river gauging station follow similar patterns, which identify similar drought and wetness periods. The numbers above each time series plot indicate the number of drought months that have SPI/SRI ≤ –1, or drought classification of moderate to extreme. In ), for Thanh My gauging station, the SPI of the five upstream rainfall stations (Nong Son, Que Son, Hiep Duc, Tien Phuoc and Tra My) has 33 moderate to extreme drought months, which is fewer than those of Thu Bon catchment (42 months on average). This infers that Thu Bon basin has a longer meteorological drought, of about 11 months, for the study period as compared to Vu Gia basin. Similarly, the SRI simulated at Thanh My station gives a lower number of severe to extreme drought months (34) compared to Nong Son station (43 months). This indicates that Thu Bon catchment has longer drought, in general, compared to the Vu Gia catchment. The interesting feature to note here is that all these drought events occur about a year after the strong El Niño hit Vietnam (strong El Niño in 1991 and 1997, moderate El Niño in 2002 and 2009), as shown in . Both SPI and SRI agreed on the timing and magnitude of the events in these years.
Figure 6. Simulated SPI and SRI for upstream rainfall stations and runoff gauging station: (a) Thanh My–Vu Gia basin and (b) Nong Son–Thu Bon basin. See text for explanation.
4.2.3 Comparison of drought indicators
shows the correlation value between SPI and SRI for all accumulation periods (1, 3, 6 and 12 months). The differences between the indices increase as the accumulation period decreases, with SPI to SRI correlations dropping from 0.93 for the 12-month period to 0.90, 0.85 and 0.80 for the 6-, 3- and 1-month periods for Thanh My station ((a)). This is because, when applied for shorter accumulation periods, the SRI is less variable from month to month than the SPI due to the retention of soil moisture that regulates runoff (McKee et al. Citation1993). The correlation for all accumulation periods between SPI and SRI is given in , with correlations higher than 0.7 indicated in bold type. The lowest correlation at Thanh My station is 0.38 for SPI-1 and SRI-12. A similar correlation value of 0.31 was observed at Nong Son for the same pair ((b)).
Table 3. Correlation table for all accumulation periods of SPI and SRI for Thanh My and Nong Son. Bold values indicate correlation higher than 0.7.
4.2.4 Spatial distribution of meteorological drought
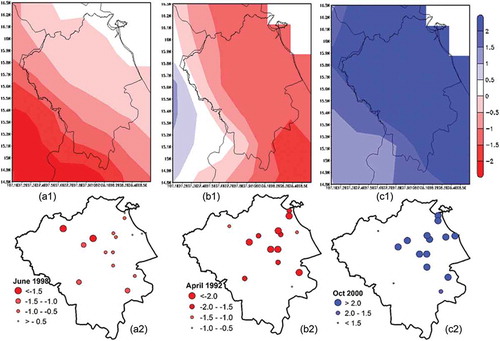
It is also very important to assess drought at spatial scales when the local station network is sparse. The spatial distribution of SPI for the two most extreme drought events in June 1998 and April 1992 (after the two strong El Niño years in 1997 and 1991) and the wettest event in October 2000 are assessed using both gridded observation data (APHRODITE) and rainfall station data (). According to SPI characterization by APHRODITE, the distribution of the drought event in June 1998 (a1)) decreased in magnitude from inland to ocean (southwest to northeast), while it suggested the opposite in April 1992 (b1)), with an increase in droughts from northeast to southwest. The patterns are clearer when looking at the in situ scale as the coarse resolution of 25-km gridded data in APHRODITE does not show enough details. a1) shows two severe droughts (SPI < −1.5) at stations further inland and more mild drought close to the Vietnam East Sea. In contrast, a2) shows more extreme drought (SPI < −2) near the sea, reducing towards the land (SPI ranges from −1.5 to −2). The very wet event in October 2000 is shown in ), with most of the stations near the East Sea having SPI >2 while some stations have SPI < 1.5. This suggests a good agreement between the gridded data of APHRODITE (c1)) and station data (c2)).
Figure 7. Spatial distribution of drought and wetness at selected time frames: (a) June 1998, (b) April 1992, (c) October 2000, using (1) APHRODITE and (2) station data.
4.3 Future climate projections
The future climate projections derived from the downscaled climate model scenarios are shown () as anomalies between the future climate (2011–2040, scenario A2) and the baseline climate (1961–1990). a1), (b1) and (c1) shows the annual precipitation anomaly (%) for the climate models. All three models suggest an increase in annual rainfall up to 20%, with slight decreases (<5%) shown by WRF/MIROC in the upstream of the VGTB basin. Among these models, WRF/ECHAM has the highest anomaly increase spatially, followed by WRF/CCSM. The WRF/MIROC model displays the least change in annual rainfall. The three models exhibit the same pattern, with a lower anomaly over the western side (inland) and a higher anomaly at the eastern side (ocean). a2), (b2) and (c2) displays the absolute temperature change (°C) between the projected and the baseline climates. WRF/ECHAM (b2)) has the lowest climate sensitivity, which indicates a lower change (~0.7°C), while WRF/CCSM (a2)) presents the highest absolute anomaly of approx. 1°C. Similar patterns among all three models are found for temperature anomalies, with the land temperatures (western side) being higher than ocean (eastern side of the domain).
Figure 8. Spatial anomaly of future climate with respect to baseline for (a) WRF/CCSM, (b) WRF/ECHAM and (c) WRF/MIROC, with (1) precipitation relative anomaly, Δ (%) and (2) temperature absolute anomaly (°C). Anomaly (Δ, %) of dry/wet season between future streamflow with respect to baseline 1961–1990 for (a3) Thanh My and (b3) Nong Son river gauging stations.
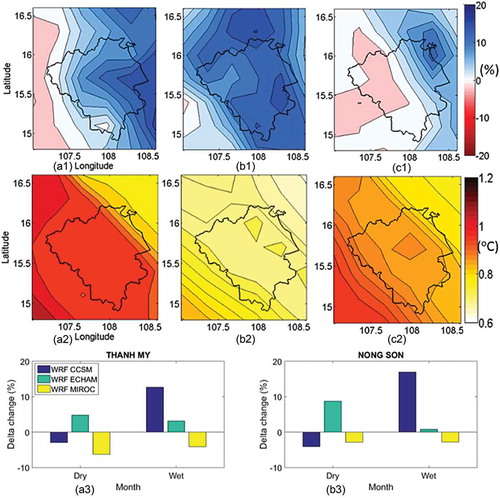
Despite an overall increase in the annual precipitation and temperature, the streamflow anomaly shows a mixed trend under climate change. a3) and (b3) displays the dry/wet season delta change (%) in streamflow projection for the three downscaled climate models. From the streamflow anomaly shown in a3) and (b3), one can compare the three different patterns from the three climate models, as follows: (1) WRF/ECHAM shows a very wet scenario, showing an increasing streamflow for both dry and wet seasons at the two gauging stations; (2) WRF/MIROC indicates declining streamflow for both seasons at Thanh My and Nong Son; and (3) WRF/CCSM displays a marginal decrease in streamflow anomaly during the dry season and a large increase (10–20%) during the wet seasons, for the two studied stations. It is, therefore, likely that the region might experience a hotter and wetter climate in the future, but what needs to be answered is whether it would suffer more droughts during the dry season. The meteorological and hydrological drought characteristics are discussed in the next section.
4.4 Future drought projection
The future drought conditions were assessed by the drought classification, as specified in . Only the moderate, severe and extreme droughts for both SPI and SRI were analysed in this study. The SPI for 15 rainfall stations and the SRI for two discharge gauging stations were calculated for the baseline period 1961–1990 and the future climate period 2011–2040 (under the A2 emissions scenario) using the WRF/CCSM, WRF/ECHAM and WRF/MIROC simulations bi-linearly interpolated to station scale. Each station is bounded by four grid points; hence, the bi-linear interpolation approach was utilized to compute the rainfall value at the station, based on the four closest grid points. There are two drought characteristics to be assessed: (a) the total number of drought months, and (b) the total drought severity (summation of corresponding SPI/SRI values that belong to medium, severe and extreme drought categories). The anomaly (%), which is the marginal difference between baseline and future climate period meteorological drought characteristics, was computed for 15 rainfall stations and is displayed as box plots in and for characteristics (a) and (b), respectively. The change (Δ) in drought characteristic computed from the hydrological drought SRI values of Thanh My and Nong Son stations, is also displayed as points in the same plots. Because Δ (%) has been computed, positive (negative) values of Δ indicate an increasing (decreasing) trend (towards an increasing number of drought months or drought severity).
Figure 9. Box plots of Δ change (%) in number of drought months between future climate (2011–2040) under A2 scenario and baseline (1961–1990) for (a) medium, (b) severe and (c) extreme meteorological drought. Circles (blue) represent Thanh My and diamonds (red) Nong Son hydrological drought. The lower/upper bounds of the box plots cover the 25th and 75th percentiles of the 15 rainfall stations with the medians or 50th percentile displayed as horizontal lines in the middle of the box plots.
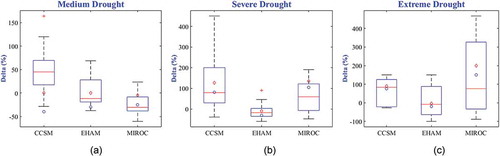
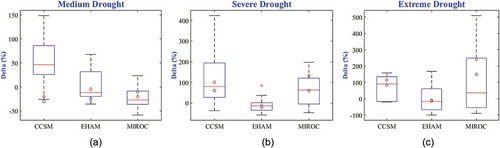
Figure 10. Box plots of Δ change (%) in drought severity between future climate (2011–2040) under A2 scenario and baseline (1961–1990) for (a) medium, (b) severe and (c) extreme meteorological drought. See for explanation.
The analyses suggest that there is a marginal increase in the number of drought months at a large number of rainfall stations for meteorological drought in the future climate compared to the baseline (for WRF/CCSM), as displayed in )–(c). The median increasing rates in the number of drought months are 50%, 100% and 100%, respectively, as seen from WRF/CCSM meteorological drought analyses. The WRF/ECHAM box plot shows a median value of 0 (%), which indicates that the number of drought months does not change in the future. The WRF/MIROC box plot has a reduction in the number of medium droughts ()), but it shows substantial increases in severe drought and reaches the maximum anomaly for extreme drought ()). Showing an increase of up to 300% (third quartile range of box plot) for the extreme meteorological drought category, WRF/MIROC seems to be the driest model. The hydrological drought by SRI – represented by circles and diamonds for Thanh My and Nong Son, respectively, for each climate model output – shows a similar trend to the meteorological drought.
At a quick glance, there is not much difference in the box plots for and , which show the change (Δ) in drought severity, due to similar computations in drought characteristics. Thus, the drought severity follows a similar pattern to that of the number of droughts.
In a nutshell, despite not much difference in the medium drought characteristics, the severe and extreme drought categories suggest an increasing trend in both the number of drought months and drought severity (WRF/CCSM and WRF/MIROC), as well as a minor decreasing trend (WRF/ECHAM). Although there is an overall increasing annual rainfall trend, drought characteristics during the dry season suggest harsh climate change impacts on local water resources.
5 Conclusions
This paper attempted to study both meteorological and hydrological droughts under climate change conditions in the Vu Gia–Thu Bon (VGTB) basin in Central Vietnam, based on standardized precipitation and runoff indices (SPI and SRI), respectively. The SRI was assessed from the output of the fully-distributed MIKE SHE model calibrated for the VGTB basin, while the SPI was based on rainfall station data. The results indicate that the SPI has a higher correlation with SRI when the accumulation period is increased. An interesting finding is that the extreme drought events are related to the strong El Niño, as these events normally occur a year after El Niño. This study used an ensemble of three global climate models, CCSM3.0, ECHAM5 and MIROC-medium resolution, under the A2 emissions scenario, downscaled by the WRF regional climate model for the immediate future climate, 2011–2040. The climate projections derived from RCM downscaling indicate significant increases in both mean temperature and annual precipitation over the study region, with decreasing streamflow projections during the dry season and increases during the wet season over the VGTB basin. The projected meteorological and hydrological drought were characterized by the SPI and SRI values, which indicate an increase in the number of drought months and in drought severity under severe and extreme drought categories. This is especially applicable for drought events when the severe and extreme drought characteristics increase more than 100% under climate projections.
The current study is limited to three climate models under one emissions scenario over the ensuing decades in the future; however, it opens the research direction towards using larger ensembles of both regional and global climate models under different climate scenarios. This possible future work could give a better picture of the future drought situation over the VGTB basin. It is hoped that such a large number of realizations from both climate and hydrological models might improve the confidence in the findings.
Acknowledgements
The authors would like to sincerely thank the editor, associate editor and reviewers for their comments which helped to improve the quality of the paper.
Disclosure statement
No potential conflict of interest was reported by the authors.
References
- Allen, R.G., 1986. A Penman for all seasons. Journal of Irrigation and Drainage Engineering, 112 (4), 348–368. doi:10.1061/(ASCE)0733-9437(1986)112:4(348)
- Al-Qinna, M.I., et al., 2011. Drought analysis in Jordan under current and future climates. Climatic Change, 106 (3), 421–440. doi:10.1007/s10584-010-9954-y
- Begueria, S. and Vicente-Serrano, S., 2013. Package ‘SPEI’, Version 1.6. Available from: https://cran.r-project.org/web/packages/SPEI/SPEI.pdf [Accessed March 2017]
- Butts, M.B., et al., 2004. An evaluation of the impact of model structure on hydrological modelling uncertainty for streamflow simulation”. Journal of Hydrology, 298 (1–4), 242–266. doi:10.1016/j.jhydrol.2004.03.042
- Chen, F. and Dudhia, J., 2001. Coupling an advanced land surface–hydrology model with the Penn State–NCAR MM5 modeling system. Part I: model implementation and sensitivity. Monthly Weather Review, 129, 569–585. doi:10.1175/1520-0493(2001)129<0569:CAALSH>2.0.CO;2
- Cunge, J.A., 2003. Of data and models. Journal of Hydroinformatics, 5, 75–98.
- Dai, A., 2011. Drought under global warming: A review. Wiley Interdisciplinary Reviews: Climate Change, 2, 45–65. doi:10.1002/wcc.81
- Dai, A., 2012. Increasing drought under global warming in observations and models. Nature Climate Change, 3, 52–58. doi:10.1038/nclimate1633
- Dai, Z., et al., 2010. Bi-criteria evaluation of the MIKE SHE model for a forested watershed on the South Carolina coastal plain. Hydrology and Earth System Sciences, 14, 1033–1046. doi:10.5194/hess-14-1033-2010
- Farr, T.G. and Kobrick, M., 2000. Shuttle radar topography mission produces a wealth of data. Eos, Transactions, American Geophysical Union, 81 (48), 583–585. doi:10.1029/EO081i048p00583
- Fink, M., et al., 2013. Distributed hydrological modeling of a monsoon dominated river system in Central Vietnam. In: 20th International Congress on Modelling and Simulation (Adelaide, Australia), 1826–1832.
- Grell, G.A., 1993. Prognostic evaluation of assumptions used by cumulus parameterizations. Monthly Weather Review, 121 (3), 764–787. doi:10.1175/1520-0493(1993)121<0764:PEOAUB>2.0.CO;2
- Guinot, V. and Gourbesville, P., 2003. Calibration of physically based models: back to basics?. Journal of Hydroinformatics, 5, 233–244.
- Hong, S.-Y. and Pan, H.-L., 1996. Nonlocal boundary layer vertical diffusion in a medium-range forecast model. Monthly Weather Review, 124 (10), 2322–2339. doi:10.1175/1520-0493(1996)124<2322:NBLVDI>2.0.CO;2
- IPCC (Intergovernmental Panel on Climate Change), 2013. Climate change 2013: the physical science basis. In: T.F. Stocker, et al. eds. Contribution of Working Group I to the Fifth Assessment Report of the Intergovernmental Panel on Climate Change. Cambridge, UK: Cambridge University Press.
- Kharin, V.V., et al., 2007. Changes in temperature and precipitation extremes in the IPCC ensemble of global coupled model simulations. Journal of Climate, 20, 1419–1444. doi:10.1175/JCLI4066.1
- Khoi, D.N. and Suetsugi, T., 2012. Hydrologic response to climate change: a case study for the Be River Catchment, Vietnam. Journal of Water and Climate Change, 3 (3), 207–224. doi:10.2166/wcc.2012.035
- Khoi, D.N. and Suetsugi, T., 2014. Impact of climate and land-use changes on hydrological processes and sediment yield—a case study of the Be River catchment, Vietnam. Hydrological Sciences Journal, 59 (5), 1095–1108. doi:10.1080/02626667.2013.819433
- Krause, P., Boyle, D.P., and Bäse, F., 2005. Comparison of different efficiency criteria for hydrological model assessment. Advanced in Geoscience, 5, 89–97. doi:10.5194/adgeo-5-89-2005
- Leach, J.A. and Moore, R.D., 2015. Observations and modeling of hillslope throughflow temperatures in a coastal forested catchment. Water Resources Research, 51 (5), 3770–3795. doi:10.1002/2014WR016763
- Lenderink, G. and van Meijgaard, E., 2008. Increase in hourly precipitation extremes beyond expectations from temperature changes. Nature Geoscience, 1, 511–514. doi:10.1038/ngeo262
- Liu, L., et al., 2012. Hydro-climatological drought analyses and projections using meteorological and hydrological drought indices: a case study in Blue River Basin, Oklahoma. Water Resources Management, 26 (10), 2761–2779. doi:10.1007/s11269-012-0044-y
- McKee, T.B., Doesken, N.J., and Kleist, J., 1993. The relationship of drought frequency and duration to time scales. In: Proceedings of the eighth conference on applied climate. Boston, MA: American Meteorological Society, 179–184.
- Mitchell, T.D. and Jones, P.D., 2005. An improved method of constructing a database of monthly climate observations and associated highresolution grids. International Journal of Climatology, 25, 693–712. doi:10.1002/(ISSN)1097-0088
- Monteith, J.L., 1965. Evaporation and the environment. In: The state and movement of water in living organisms. (19th Symposium). Cambridge, UK: Cambridge University Press, 205–234.
- Nam, D.H., Udo, K., and Mano, A., 2014. Future fluvial flood risks in Central Vietnam assessed using global super-high-resolution climate model output. Journal of Flood Risk Management, 8 (3), 276–288. doi:10.1111/jfr3.12096
- Nash, J.E. and Sutcliffe, J.V., 1970. River flow forecasting through conceptual models part I—A discussion of principles. Journal of Hydrology, 10 (3), 282–290. doi:10.1016/0022-1694(70)90255-6
- New, M., Hulme, M., and Jones, P.D., 1999. Representing twentieth century space–time climate variability. Part 1: development of a 1961-90 mean monthly terrestrial climatology. Journal of Climate, 12, 829–856. doi:10.1175/1520-0442(1999)012<0829:RTCSTC>2.0.CO;2
- New, M., Hulme, M., and Jones, P.D., 2000. Representing twentieth century space-time climate variability. Part 2: development of 1901-96 monthly grids of terrestrial surface climate. Journal of Climate, 13, 2217–2238. doi:10.1175/1520-0442(2000)013<2217:RTCSTC>2.0.CO;2
- Nguyen, Q.K., 2005. Evaluating drought situation and analysis drought events by drought indices. National Project on Drought Research and Forecast for Centre South and Central Highland of Vietnam and constructing prevent solution. 209 pp. (in Vietnamese).
- Nicolle, P., et al., 2014. Benchmarking hydrological models for low-flow simulation and forecasting on French catchments. Hydrology and Earth System Sciences, 18, 2829–28570. doi:10.5194/hess-18-2829-2014
- Ntale, H.K. and Gan, T.Y., 2003. Drought indices and their application to East Africa. International Journal of Climatology, 23 (11), 1335–1357. doi:10.1002/(ISSN)1097-0088
- Priestley, C.H.B. and Taylor, R.J., 1972. On the assessment of surface heat flux and evaporation using large-scale parameters. Monthly Weather Review, 100 (2), 81–92. doi:10.1175/1520-0493(1972)100<0081:OTAOSH>2.3.CO;2
- Raghavan, S.V., Vu, M.T., and Liong, S.Y., 2016. Regional climate simulations over Vietnam using the WRF model. Theoretical and Applied Climatology, 126 (1–2), 161–182. doi:10.1007/s00704-015-1557-0
- Sahoo, G.B., Ray, C., and de Carlo, E.H., 2006. Calibration and validation of a physically distributed hydrological model, MIKE SHE, to predict streamflow at high frequency in a flashy mountainous Hawaii stream. Journal of Hydrology, 327 (1–2), 94–109. doi:10.1016/j.jhydrol.2005.11.012
- Searcy, J.K., 1959. Flow-duration curves. manual of hydrology: part 2. Low-flow techniques. Washington: US Government Printing Office.
- Shukla, S. and Wood, A.W., 2008. Use of a standardized runoff index for characterizing hydrologic drought. Geophysical Research Letters, 35 (2), 1–7. doi:10.1029/2007GL032487
- Sienz, F., Bothe, O., and Fraedrich, K., 2012. Monitoring and quantifying future climate projections of dryness and wetness extremes: SPI bias. Hydrology and Earth System Sciences, 16, 2143–2157. doi:10.5194/hess-16-2143-2012
- Souvignet, M., et al., 2013. Recent climatic trends and linkages to river discharge in Central Vietnam. Hydrological Processes, 28 (4), 1587–1601. doi:10.1002/hyp.9693
- Thompson, G., Rasmussen, R.M., and Manning, K., 2004a. Explicit forecasts of winter precipitation using an improved bulk microphysics scheme. Part I: description and sensitivity analysis. Monthly Weather Review, 132 (2), 519–542. doi:10.1175/1520-0493(2004)132<0519:EFOWPU>2.0.CO;2
- Thompson, J.R., et al., 2004b. Application of the coupled MIKE SHE/MIKE 11 modelling system to a lowland wet grassland in southeast England. Journal of Hydrology, 293 (1–4), 151–179. doi:10.1016/j.jhydrol.2004.01.017
- Thornthwaite, C.W., 1948. An approach toward a rational classification of climate. Geographical Review, 38 (1), 55–94. doi:10.2307/210739
- Trenberth, K.E., et al., 2013. Global warming and changes in drought. Nature Climate Change, 4, 17–22. doi:10.1038/nclimate2067
- van der Schrier, G., Jones, P.D., and Briffa, K.R., 2011. The sensitivity of the PDSI to the Thornthwaite and Penman-Monteith parameterizations for potential evapotranspiration. Journal of Geophysical Research, 116 (D3), D03106. doi:10.1029/2010JD015001
- Vo, N.D. and Gourbesville, P., 2016a. Application of deterministic distributed hydrological model for large catchment: a case study at Vu Gia Thu Bon catchment, Vietnam. Journal of Hydroinformatics, 19 (2). doi:10.2166/hydro.2016.138
- Vo, N.D., et al., 2016b. Application of the deterministic hydrological model for large catchment case study at Vu Gia–Thu Bon catchment – Vietnam. Journal of Hydro-Environmental Research, 11, 59–74. doi:10.1016/j.jher.2015.11.001
- Vu, M.T., Raghavan, S.V., and Liong, S.Y., 2012. SWAT use of gridded observations for simulating runoff – a Vietnam river basin study. Hydrology and Earth System Sciences, 16, 2801–2811. doi:10.5194/hess-16-2801-2012
- Vu, M.T., Raghavan, S.V., and Liong, S.-Y., 2016. Use of regional climate models for proxy data over transboundary regions. Journal of Hydrologic Engineering, 21 (6), 1–10. doi:10.1061/(ASCE)HE.1943-5584.0001342
- Vu, M.T., et al., 2015. Investigating drought over the Central Highland, Vietnam, using regional climate models. Journal of Hydrology, 526, 265–273. doi:10.1016/j.jhydrol.2014.11.006
- Vu, T.H., Ngo, D.T., and Phan, V.T., 2013. Evolution of meteorological drought characteristics in Vietnam during the 1961–2007 period. Theoretical and Applied Climatology, 118 (3), 367–375.
- Vu, V.N., Do, D.D., and Dang, T.L., 2008. Potential evapotranspiration estimation and its effect on hydrological model response at the Nong Son Basin. VNU Journal of Science: Earth Science, 24, 213–223.
- Wang, D., et al., 2011. Climate change impact on meteorological, agricultural, and hydrological drought in central Illinois. Water Resources Research, 47 (9), W09527, 1–13. doi:10.1029/2010WR009845
- WMO (World Meteorological Organization), 2009. Experts agree on a universal drought index to cope with climate risks. WMO Press Release no. 872.
- Xie, P., et al., 2007. A gauge-based analysis of daily precipitation over East Asia. Journal of Hydrometeorology, 8 (3), 607–626. doi:10.1175/JHM583.1
- Yatagai, A., et al., 2012. APHRODITE: constructing a long-term daily gridded precipitation dataset for Asia based on a dense network of rain gauges. Bulletin of the American Meteorological Society, 93, 1401–1415. doi:10.1175/BAMS-D-11-00122.1