
 ?Mathematical formulae have been encoded as MathML and are displayed in this HTML version using MathJax in order to improve their display. Uncheck the box to turn MathJax off. This feature requires Javascript. Click on a formula to zoom.
ABSTRACT
Increases in human water consumption (HWC) and consequent degradation of the ecological environment are common in arid regions. Understanding the mechanisms behind these processes is important for sustainable development. Analyses of changes in HWC between alternating wet and dry periods are carried out in four arid inland basins in Central Asia and China (Syr Darya, Tarim, Heihe and Shulehe river basins). Based on runoff records, the presence of an asymmetric HWC response is proved (p < 0.01), with an increase in HWC during wet periods and a muted decrease during subsequent dry periods. This behaviour is interpreted by invoking theories from behavioural economics at the individual and community levels. A simple model based on these theories is shown to be able to reproduce the observed dynamics and is used to discuss the importance of strengthening institutional factors for water sustainability.
Editor A. Castellarin; Associate editor H. Kreibich
1 Introduction
1.1 Water scarcity in the Anthropocene
Water scarcity is now affecting every continent of the world. With rapid population growth and economic development, world water consumption has been growing at more than twice the rate of the world population over the past century (FAO Citation2007). Moreover, by 2050, water demand has been projected to further increase by 40% (Eliasson Citation2015). As a result of both poorly managed water resources and degradation of aquatic environments, the problem of global water scarcity has intensified (UNDP Citation2006, Wu et al. Citation2013, Zhou et al. Citation2015).
As it is an anthropocentric concept, water scarcity needs to be seen fundamentally as both a natural and a man-made phenomenon, an emergent feature driven jointly by varying and/or changing climate and socio-economic systems, and the feedback between them (Srinivasan et al. Citation2017). In many cases, water scarcity is primarily caused and/or exacerbated by rapid increase in human water consumption (HWC), which raises the fraction of available but limited freshwater resources to unsustainable levels (Fang and Qiao Citation2005, Samian et al. Citation2015). This causes environmental degradation and loss of biodiversity. For example, in the middle reaches of the Heihe River Basin in northwestern China, HWC has increased immensely due to agricultural expansion, which has caused the dynamics of the Heihe River and its terminal lake to be dominated by artificial river regulation since the 1950s (Cheng et al. Citation2014). According to Li et al. (Citation2010), the fraction of water used by humans kept increasing, and by 1999 annual HWC had reached 4.025 × 10⁹ m3, which was over 93% of the total annual available freshwater resources of 4.342 × 10⁹ m3, and would thus leave just 7% of the freshwater to support downstream riparian ecosystems. In other words, the water system and the environment have been altered drastically by human activity – primarily agricultural development and the associated increase of HWC. As awareness of, and reaction against environmental degradation grow, human societies everywhere have been motivated or forced to undertake remedial actions. In the Heihe River Basin, for example, the government carried out a water reallocation and ecological water diversion project (Cheng et al. Citation2014) in order to cut back on HWC, release more water to the environment, and restore the health of the ecosystem. If the government had not taken such actions, there would have been a high risk of total ecosystem collapse and even human exodus, as happened in the former Soviet Union’s Aral Sea (Cai et al. Citation2003).
1.2 Human–water interactions and hydrological variability
The discipline of socio-hydrology is concerned with two-way feedback between humans and water (Sivapalan et al. Citation2012, Troy et al. Citation2015). From the perspective of socio-hydrology, HWC is both an outcome of human management action and a key indicator of the co-evolution of coupled human–water systems. Depending on the prevailing climatic and socio-economic conditions, the competition for water between human consumption and the needs of the environment can give rise to interesting emergent socio-hydrological dynamics in the long term. The interactions between climatic and/or hydrological variability and human–social processes in respect to water and the environment, operating on a range of time scales, and the resulting emergent dynamics, are key research issues in socio-hydrology (Sivapalan and Blöschl Citation2015). Several manifestations of emergent dynamics have been highlighted in recent socio-hydrological literature. For example, in China, Liu et al. (Citation2014) and Lu et al. (Citation2015) studied the co-evolution of the coupled human–water systems at the millennial time scale in the Tarim and Heihe river basins, respectively. They showed a slow evolution of system characteristics expressed in terms of distinct socio-economic formations and long-term climate changes of the human–water relationship. In eastern Australia, Kandasamy et al. (Citation2014) presented evidence for the occurrence of a century-long phenomenon, called the “pendulum swing”, within the Murrumbidgee River Basin. Increases in HWC as part of agricultural development in the earlier decades was followed by environmental restoration in the later decades. These studies rightfully emphasized the competition of HWC (for agriculture and more generally for human livelihood) and the water needs of the environment over time scales of a century or longer.
Despite the attention given to the study of socio-hydrological phenomena that occur over long (e.g. 100-year) time scales, there remains considerable hydrological variability at intermediate (between inter-annual and inter-decadal) time scales that combine water resource management actions. Sequences of alternating wet and dry periods have been identified in both discharge and precipitation time series in different regions globally (Reason and Rouault Citation2002, Fogt and Bromwich Citation2006, Li and Ma Citation2012, Fischer et al. Citation2013). In many parts of the world, the inter-annual variability is attributed to the El Niño Southern Oscillation (ENSO) phenomenon (Hanson et al. Citation2004). Patterns of inter-decadal variability of observed rainfall have likewise been linked to large-scale atmospheric and oceanic circulation patterns using indices such as the North Atlantic Oscillation (NAO), Tropical Atlantic Variability (TAV) and Atlantic Meridional Overturning Circulation (MOC) (Samuel and Sivapalan Citation2008). On the human side too, it so happens that the intermediate time scale is also the typical time scale of socio-economic development planning, a period over which HWC can change significantly as a result (Constanza et al. Citation2007). The five-year plan and the ten-year programme used to be, and/or still are, typical instruments of economic planning in many countries, including China, India and the former Soviet Union. Despite the presence of hydrological variability and human water management (in part to deal with the variability) at these intermediate time scales, the interaction and feedback in water management as a result of these drivers and the emergent dynamics have not been explored in previous socio-hydrological studies. In this study, we focus on the intermediate time scale of 5–20 years and related emergent dynamics, instead of longer (i.e. millennial and century) and shorter (i.e. intra-annual) time scales.
This study will utilize HWC data as well as data pertaining to natural water availability in four hyper-arid basins in Central Asia and Western China, the Syr Darya River Basin, the Tarim River Basin, the Heihe River Basin and the Shulehe River Basin. In this study, through analysis of the data and further elaboration of the outcomes of the data analysis, we explore three key questions: (1) How does HWC change (and grow) at these intermediate time scales during alternating wet and dry periods? (2) How can we explain and simulate the observed dynamics of HWC at these intermediate time scales through extant theories relating to human behaviour at the individual and community levels? (3) What lessons can be learned from these four case studies for different consequences experienced in diverse river basins around the world in the long term, such as the collapse of the Aral Sea in Central Asia (Cai et al. Citation2003), the near-collapse of the Urmia Lake in Iran (Aghakouchak et al. Citation2015) and the eventual recovery (i.e. pendulum swing) in the Murrumbidgee River Basin in eastern Australia (Kandasamy et al. Citation2014)? In this way, we hope to deepen our understanding of the competition for water between human livelihood and ecosystem health, and in this way enrich the field of socio-hydrology.
The remainder of the paper is organized as follows. Section 2 provides an introduction to the four study basins, the data used and their sources, as well as the methods used for data processing and analysis. Section 3 contains the results of the analysis for each study area, including what we believe are emergent human responses to intermediate-scale hydrological variability. Section 4 discusses possible theoretical explanations for the emergent human–water system behaviour observed in the four case studies, as well as a broad analysis framework and model to understand and simulate the dynamics of HWC. Using this framework, we discuss possible explanations for the different consequences of coupled human–water interactions in diverse river basins of the world. The paper then concludes with a summary of the outcomes of the study, implications for sustainable water management in arid basins, and a discussion about topics and questions that need further research.
2 Study areas, data and methodology
2.1 Study areas
The Syr Darya, Tarim, Heihe and Shulehe river basins are four large inland arid basins in Asia, all of which experience a typical continental climate. shows the geographical locations, general river systems, terminal lakes and discharge gauge stations of the four basins. The magnitudes of mean annual runoff are in the order of 1000, 100, 10 and 1 m3/s in the four basins, respectively. Other basic information, including source areas and terminal lakes, is listed in . Generally, the common features of these inland basins are: (a) river flow is fed mainly by snow and glacier melt and, to an extent, by precipitation in upstream mountainous areas; (b) river flow is extracted for human consumption in the plain oases located downstream of the source, which is favourable to human settlement and agricultural development; and (c) the remnants of the river flow end up in a terminal lake or eventually disperse into a desert.
Table 1. Geographic information and data for the study areas, including the monitoring stations in the upstream and downstream, the data series and length, and the data sources
Figure 1. Map of the study areas showing the Syr Darya River in Central Asia, and the Tarim, Heihe and Shulehe river basins in Northwest China. The general river systems, terminal lakes and discharge stations of the four basins are indicated
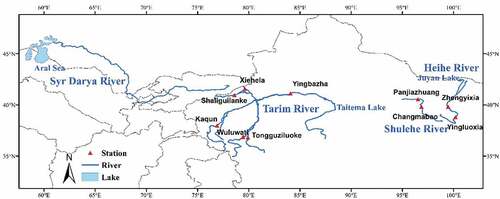
Specifically, the source of the Syr Darya River is in the Tianshan Mountains and it feeds a terminal lake, the Aral Sea. The water level in the Aral Sea remained at a relatively stable level before the 1960s (Cretaux et al. Citation2013); however, the average inflow has decreased sharply since the 1960s due to increasing water withdrawals for irrigation, which has caused the consequent shrinkage of the Aral Sea. The shrinkage and eventual separation of the Aral Sea in 1987 and its ecological and environmental deterioration, referred to as the “Aral Sea Crisis”, is one of the most serious eco-catastrophes of the 20th century.
The Tarim River Basin is fed by tributaries that originate in the Tianshan and Kunlun mountainous areas of northwest China. It is the largest inland basin in China. The change in human socio-economic systems within this basin have also been significant: both human population and irrigation areas have increased by five and four times, respectively, from the 1950s to the 2000s (Ye et al. Citation2006). Due to human activities, several hydrological stations along the main stream of the Tarim River have seen a significant decline of runoff, although precipitation has somewhat increased in the source area (Xu et al. Citation2006). As a result, the terminal Taitema Lake fell dry in 1972, and the lower reaches of the river, some 458 km long, also known as the “Green Corridor”, which extends from Qiala to Taitema, faced serious vegetation degradation.
The Heihe River Basin is the second largest inland basin of China. Its source is in the Qilian Mountains and it flows into the terminal Juyan Lake, which disappeared after the 1990s. With an average annual precipitation of 62–156 mm, the Heihe River Basin also faces severe water shortages and environmental problems; it has witnessed the most rapid development of agriculture since the 1970s.
Finally, the Shulehe River Basin is the third largest inland basin in China, and is located in the Hexi Corridor, as is the Heihe River Basin. The Shulehe River also originates from the Qilian Mountains and is recharged by meltwater from glaciers and snow, springs and precipitation (Guo et al. Citation2015). With the increase in population and irrigated farmlands, water resources within the basin have been exploited extensively, and the lakes and wetlands in the lower reaches of the river have diminished, or disappeared altogether (Guo et al. Citation2015).
2.2 Data and sources
indicates the data used in this study. The data for Syr Darya River have been extracted from Cai et al. (Citation2003); they have a record length of 40 years (1959–1998). Specifically, the flows for 1959–1988 were obtained from Glantz (Citation1999) and flows for 1989–1998 were obtained from V. Chub, Uzbekistan Main Hydrometry (personal communication 2000). For the Tarim River, data for 1958–2012, with a record length of 55 years, were obtained from the Xinjiang Tarim River Basin Management Bureau. Discharges of five independent mountain exit gauge stations on the river tributaries listed in were added together to represent the upstream discharge (UD) for the Tarim River Basin. The difference between flows measured at the five upstream stations and at the downstream Yingbazha Station represents the HWC in this basin, which is not impacted by the water diversion project to points further downstream. The time series data for the Heihe River were obtained from the Heihe River Basin Management Bureau, and have a record length of 57 years (1956–2012). The upstream and downstream stations are Yingluoxia and Zhengyixia, respectively (), and the majority of the irrigation areas lie between these two stations. The data for Shulehe River for 1961–2015 were obtained from the Shulehe River Basin Management Bureau. The upstream Changmabao station and the downstream Panjiazhuang station have long data series, which were used in this study. To our knowledge, the datasets used herein are the longest accurate measured datasets in the four basins, which gives us confidence in our analysis. We hope future research will assemble longer data series from more arid and hyper-arid basins to test the outcomes of this study and to undertake more detailed analyses.
2.3 Proxies for hydrological condition and HWC
In the study areas, as mentioned before, the discharge of rivers is mainly due to precipitation, snowmelt and glacier melt in mountainous areas; due to high evaporative demand and low precipitation, almost no runoff is generated in the oasis areas. In other words, the volume of precipitation and snow/glacier melt in headwaters determines how much water is available for HWC. In this case, UD can be used as a proxy for the hydrological condition for the whole basin. As explained by Tang et al. (Citation2006), water withdrawal from rivers and groundwater sustain HWC in the oasis areas, and groundwater is replenished by rivers and irrigation water, while part of the irrigation water returns to the river. In these hyper-arid basins, HWC is much larger than non-human water consumption, such as evapotranspiration and leakage losses. Based on the principle of water balance, the difference in discharge between upstream and downstream stations in a river approximately represents HWC, as long as groundwater exploitation accounts for only a small fraction of HWC. According to Xia et al. (Citation2013), water diverted from Syr Darya River for HWC accounted for 77% of the surface flow in the period 1986–1999, while supply for HWC accounted for 69% of the surface flow in the Tarim River (Deng Citation2009), 89% of the surface flow in the Heihe River (Li et al. Citation2010) and over 70% of the surface flow in the Shulehe River (Ding et al. Citation2001). Groundwater accounted for 5.7% of the HWC in the Tarim River in 2005 (Deng Citation2009), 13.4% in the Heihe River in 1999 (Li et al. Citation2010) and 7.5% in the Shulehe River in 1999 (Ding et al. Citation2001). When the upstream stations are located in the mountain exit areas and downstream stations are below the oasis areas, the difference in discharge between upstream and downstream stations can reasonably represent HWC, diverted for agricultural, domestic and industrial uses. This approach is similar to approaches adopted by Ye et al. (Citation2006) to analyse long-term changes in HWC in the Tarim River Basin, and by Li et al. (Citation2010) to estimate HWC in the Heihe River Basin.
In summary, as explained in Section 2.2, HWC in the Syr Darya River Basin is the difference in discharge between upstream and downstream stations; that in the Tarim River Basin is estimated as the difference between total flow in mountain exit stations and the discharge at Yingbazha station; that in the Heihe River Basin is estimated as the difference in discharges between the Yingluoxia and Zhengyixia stations; and in the Shulehe River Basin HWC is estimated as the difference in discharge between Changmabao and Panjiazhuang stations.
2.4 Partitioning into sequences of wet and dry periods and analysis methods
Patterns of hydrological wet and dry periods are common and complex in all four study areas (Boomer et al. Citation2000, Zhang et al. Citation2003, Nezlin et al. Citation2004, Xu et al. Citation2006, Liu et al. Citation2014). The partition of the observed time series into intermediate-term wet and dry periods is based on recognition of ENSO-like periods in previous studies (Reason and Rouault Citation2002, Li and Ma Citation2012), which explored relationships between ENSO and hydrological variables. Since the causes of the wet/dry patterns are complex, a partitioning based purely on ENSO-like periods is not accurate in the specific study area. There are some studies that divide the time series based on just the calendar, such as Li et al. (Citation2010), who divided the time series of the Heihe River Basin discharge into 10-year blocks, which is a hydrologically unsupported method. In this study, in order to examine how HWC changes during wet and dry periods, we divided the data series so that average UD during wet and dry periods were significantly different. Specifically, we defined a period length of 5–20 years to focus on intermediate-scale variability and calculated the standard deviation of averages for each period under different partitions; we then chose the partition with the maximum standard deviation, and later adjusted the partition to be consistent with local economic and social development periods. In this way, the chosen partition would have relatively large differences between wet and dry periods, while also reflecting the known socio-economic dynamics. It should be noted that, if the average UD of a period was lower than both the previous and subsequent periods, it was regarded as a dry period. In contrast, it was recognized as a wet period if the average UD was higher than both contiguous periods. The details of this method are as follows.
For each basin, n is the length of the data series, and the resulting time series are specified as: . The time series is then divided into m periods, leading to the set of all partitions
, where the minimum and maximum period lengths are 5 years and 20 years, respectively. This gives rise to the partial sum:
: =
and average over the kth period:
: =
. We then maximize the variance of the m averages, i.e.
, where
. With this,
becomes the partitioning of the complete time series into sequences of wet and dry periods, where
is the length of the kth period.
To study how HWC changes during wet and dry periods, we calculated normalized UD, , and normalized HWC,
, where
is the annual mean UD during the kth period,
is the average difference of discharge between upstream and downstream (i.e. HWC) of each period, and
is the average UD of the basin over the entire record. The changes in
and
are defined as
and
. If
, UD increases, and the basin turns into a relatively wet period, and if
, UD decreases, and the basin turns into a relatively dry period. If
, HWC increases, and if
, HWC decreases. The ratio
thus reflects how HWC responds to the hydrological condition. The Wilcoxon rank sum test was used to identify whether the way HWC responds to the hydrological condition was different during alternating wet and dry periods. This is a nonparametric test to determine whether two samples come from the same population against an alternative hypothesis (Wilcoxon et al. Citation1970).
3 Results
3.1 Syr Darya River in the Aral Sea Basin
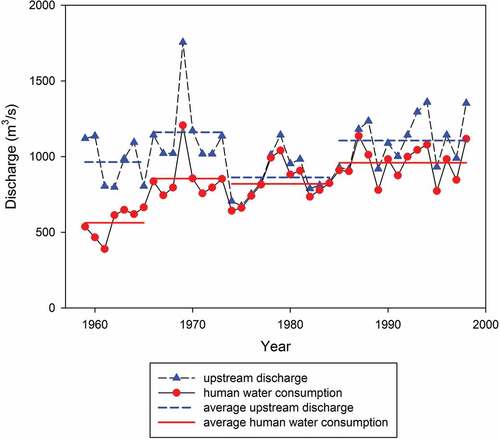
shows the dynamics of UD and HWC in the Syr Darya River Basin (part of the Aral Sea Basin). The UD time series indicates that the basin experienced four wet and dry periods since the 1960s. The first period of 1959–1965 was relatively dry, and in the successive wet period of 1966–1973, UD was 20% higher than in the previous period, and correspondingly HWC increased by 52%. According to Micklin et al. (Citation2014), the years 1961–1970 saw a great expansion of irrigated areas. The average withdrawal for irrigation grew by 35% compared to previous decades, which is consistent with our findings. However, in the subsequent much drier period of 1974–1984, the UD decreased significantly, yet HWC decreased only a little, much less than UD. Xia et al. (Citation2013) also reported that the average water withdrawal in the Aral Sea Basin showed no drop in 1971–1985 compared to the previous few years. This caused a reduction of discharge to the Aral Sea and the water level started to decrease rapidly, at the rate of 0.7 m per year, during this period (Micklin et al. Citation2014). However, in another wet period of the Syr Darya dataset, after 1985, which has a similar average UD to the wet period of 1966–1973 (1106.3 and 1160.8 m3/s, respectively), the HWC shows a fast increase again, significantly higher (12%) than during the previous wettest period of 1966–1973. Thus, HWC in the Syr Darya River clearly shows different adaptive responses to intermediate-scale variability of UD during wet and dry periods. A relatively sufficient water supply during the wet periods of 1966–1973 and 1985–1998 stimulated an increase in HWC. The wet period of 1966–1973 “deceived” people and helped conceal the crisis. During the dry period of 1974–1984, HWC showed little decrease and ecological water consumption was the first to be cut back. Finally, after the last dry period of 1974–1984, the Aral Sea shrank sharply and split into two small lakes in the late 1980s.
Figure 2. UD and HWC for the period 1959–1998 in the Syr Darya River. The data series are divided into four periods: 1959–1965, 1966–1973, 1974–1984 and 1985–1998
3.2 Tarim River
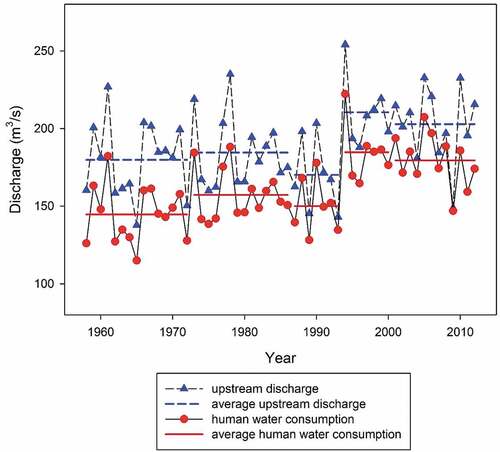
As shown in , for the Tarim River, the time series data for the period 1958–2012 was divided into five periods based on the hydrological variability of UD. The first period (1958–1972) was relatively dry, and in the following wetter period of 1973–1986, the average UD increased slightly by 2.6%. However, corresponding average HWC increased by 8.6%: the increment of HWC is more than triple the increment of UD. In the drier period of 1987–1993, average UD dropped by 7.8%, while average HWC dropped by only 4.6%. Additionally, both being relatively dry periods, although the UD of 1987–1993 was less than that of 1958–1972, the average HWC of 1987–1993 was higher than during the previous dry period. Average UD increased dramatically – by 23.7% – during the wet period of 1994–2000, and HWC increased by 23.2% as well. This wet decade experienced a rapid increase in cultivated area compared to 1987–1993, which exceeded 400 ha per year on average (Yong Citation2012). However, in the last dry period of 2000–2012, when UD dropped by 3.7%, average HWC only decreased by 2.8%. The cultivated area still increased, although the increase rate slowed down during this period (Yong Citation2012). Compared to the Syr Darya River, hydrological variability within the Tarim River Basin was less, excluding the period between 1994 and 2012. However, HWC responded differently again during wet and dry periods. Comparing adjacent periods, the periods with increasing UD would cause HWC to increase in larger proportion than periods with decreasing UD, e.g. the wet periods of 1973–1986 and 1994–2000 both saw faster growth of HWC than UD. The UD in the Tarim River Basin experienced several wet and dry periods, while the HWC increased, which reduced water flow to the lower reaches of the Tarim River and, ultimately, caused the Taitema Lake to disappear.
Figure 3. UD and HWC for the period 1958–2012 in the Tarim River. The data series are divided into five periods: 1958–1972, 1973-–1986, 1987–1993, 1994–2000 and 2001–2012
3.3 Heihe River
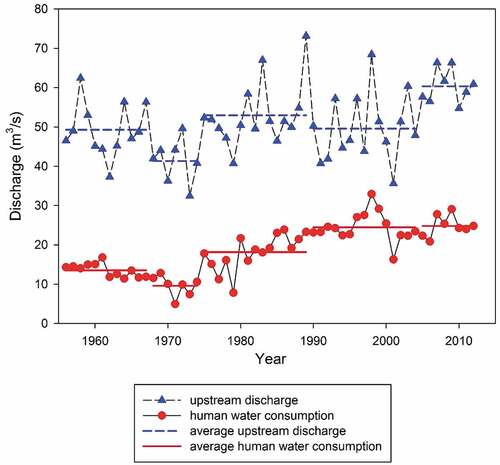
Based on the UD of the Heihe River Basin, the time series was divided into five periods, as shown in . In the period between 1968 and 1974, average UD dropped by 16.2%, as compared to the former wet period of 1956–1967. The HWC dropped by 28.9%, accounting for 49.3% of the reduction in UD. However, when average UD increased by 28.3% in the third period of 1975–1989, average HWC rebounded by 89.6%, accounting for 73.5% of the increment of UD. Compared with the adjacent dry period of 1968–1974, HWC increased by a higher ratio in the wet period of 1975–1989. The expansion of irrigated area in 1975–1989 was also much more rapid than before (Li et al. Citation2010). In the 1990s, average UD dropped by 6.4%, yet HWC increased by 34.1%, and severe desertification occurred in the period (Li et al. Citation2010). In the last wet period, from 2005 to 2012, average UD increased by 21.8%, while HWC only increased by 1.6%, which was more restrictive than the former wet period and could be explained by the establishment of the Heihe River Basin Management Bureau in 2000 and the ecological restoration plan (Cheng et al. Citation2014, Lu et al. Citation2015). Through the alternation of several wet and dry periods, the ratio of HWC to UD shows a remarkable growing trend until the last period, indicating that HWC is the last to be cut back during drought periods, at the expense of the ecosystem in downstream areas of the Heihe River Basin.
Figure 4. UD and HWC for the period 1956–2012 in the Heihe River. The data series are divided into five periods: 1956–1967, 1968–1974, 1975–1989, 1990–2004 and 2005–2012
3.4 Shulehe River
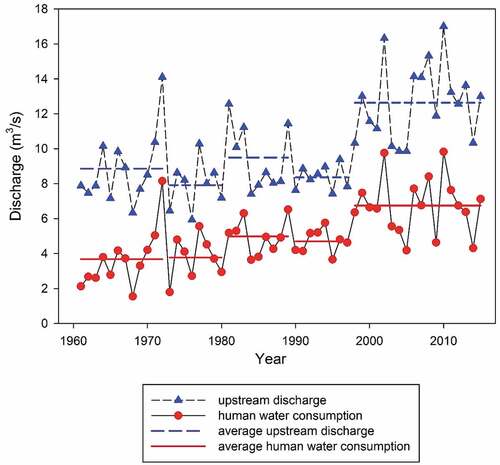
As shown in , the time series data were also divided to five alternating wet and dry periods. In the period 1973–1980, average UD decreased by 11.2% compared to 1961–1972, while average HWC showed no decrease. However, for the wet period of 1981–1989, average HWC surged by 31.6% when average UD increased by 20.3%. According to remote sensing data, the area of cultivated land increased rapidly in the 1980s in the middle reaches of the Shulehe River Basin (Qi et al. Citation2014). During the dry period in 1990–1997, when average UD dropped by 11.6%, average HWC only dropped by 6.0%. Although the expansion of cultivated area in the period 1990–1997 slowed down compared to 1981–1989, serious degradation of vegetation occurred in the Shulehe River Basin (Qi et al. Citation2014). In the last period of 1998–2015, average UD reached a high level of 12.6 m3/s, and average HWC increased sharply again by 42.6%, which is consistent with the rapid expansion of cultivated area after 2000 (Qi et al. Citation2017) accompanied by the influx of over 75 000 immigrants (Qi et al. Citation2014). Since the 1960s, the relatively wet periods, including 1981–1989 and 1998–2015, witnessed rapid expansion of cultivated area and an increase in average HWC, while the relatively dry periods, including 1973–1980 and 1990–1997, experienced slow reclamation yet no significant drop in average HWC.
Figure 5. UD and HWC for the period 1961–2015 in the Shulehe River. The data series are divided into five periods: 1961–1972, 1973–1980, 1981–1989, 1990–1997, and 1998–2015
3.5 HWC dynamics
As shown in , when is positive and a wet period occurs,
will be positive too, except for the period marked by * in for the Heihe and Shulehe river basins, when water consumption increased while water inflow from upstream decreased. When
is negative and a dry period occurs,
will be negative as well. The positive value of
can reflect the response of HWC to hydrological variability. For each basin, the ratios
for the wet periods are always larger than those for contiguous dry periods. Taking the Syr Darya River as an example, the period 1974–1984 is a relatively dry period, and the value of
is 0.119, whereas it has values of 1.485 and 0.575, respectively, for earlier and later wet periods. In particular, if we exclude the period marked ** in for the Heihe River Basin, when humans started to take action to restore ecosystem health (Lu et al. Citation2015), the values of
for wet periods are significantly higher than those for dry periods, according to the Wilcoxon rank sum test (p < 0.01) (Wilcoxon et al. Citation1970). This is a broad-level indication that, in all four basins, humans respond differently to wet and dry periods. According to the results from the different cases and our statistical analysis, we can summarize the key results as follows:
HWC responds consistently to UD at the intermediate scale. Increasing UD induces people to increase HWC (e.g. irrigate more land), while HWC may drop in dry periods, as reflected in the positive values of
in most periods.
HWC responds to increasing UD strongly, with a higher value of
Table 2. Statistical analysis of the study areas, where is the average UD and
is the average HWC of each period. See text for explanation of * and **
In other words, the response of HWC to UD is asymmetric during wet and dry periods, which is the most important message coming out of the data analyses in all four basins. Humans take actions to offset negative effects of climate variability on socioeconomic development, and always choose to cut down ecological water and maintain HWC during dry periods. In our calculations we did not include possible groundwater exploitation, due to limited data. But some areas, especially the Heihe River Basin, have experienced over-exploitation of groundwater since the 2000s (Li et al. Citation2010). If we also take groundwater exploitation into account, the asymmetric response of HWC to UD that was observed during the wet and dry periods is likely to be even more pronounced. A more detailed analysis of water balance including groundwater extraction is left to future work when more data become available.
4 Discussion
4.1 Asymmetry of HWC during wet and dry periods
We begin this section with a summary of the observed response common to all four arid river basins, which have agriculture-based economies. Given the relatively abundant water resources in wet periods, socio-economic motivations drive water demand up through the expansion of irrigated land area, and investments in technology and labour. This inspires an intermediate-term scale economic boom, with HWC expanding quickly. In the subsequent dry period, with human demand already raised during the previous wet period, the inertia (water demand) of the expanded economic needs leads to maximizing possible utilization of the now reduced water supply. The result is that HWC now tracks the previously expanded demand, and is difficult to be cut back in proportion to the reduced water supply. With the onset of another wet period, the above dynamic repeats itself.
The net result is a positive spiral (with respect to water consumption and the economy), with demand going up in spurts during wet periods and water consumption keeping track during dry periods. However, since there is no net increase in the water supply, unless new sources of water are introduced, while the economy might continue to grow in spurts, less and less water is left to the environment as a result.
The situation in the four basins is similar to what is happening in the Central Valley of California in the USA: a thriving agricultural economy supported by increasing HWC. When a major drought hit, farmers tried to keep their benefits due to considerable investments already made in wet years. This, along with increased global demand for their products, drove them to over-exploit groundwater and contributed to an acceleration of aquifer depletion and other forms of environmental degradation (Marston et al. Citation2015, Marston and Konar Citation2017). The dynamics of water demand after droughts, modelled as a “rebound effect” in California, also reflect the asymmetry of HWC (Gonzales and Ajami Citation2017). Clearly, this is not sustainable in the long term, and the system is liable to collapse eventually without corrective measures.
This is indeed what happened in the Aral Sea, as discussed previously, and also in the Maya civilization (Kuil et al. Citation2016). According to Kuil et al. (Citation2016), the Maya civilization acquired the capability to construct reservoirs (i.e. a form of technology), which enabled their society to accommodate larger human populations (e.g. labour) and expanded economic activities; these in turn brought benefits so long as rain continued to fall. However, when the rains failed periodically, as in a series of prolonged droughts, the heavy dependence of the Mayan society on the rainwater supply drove the system to dispersal and collapse, a phenomenon known as “path dependence” (Kuil et al. Citation2016). Similarly, the Tarim, Heihe and Shulehe river basins also came close to the point of collapse, and only recovered through massive government interventions (Cheng et al. Citation2014, Liu et al. Citation2014).
Here, we define the dynamics of HWC as the adaptive response of human beings, which could be active or passive. Particularly during dry periods, for instance, HWC may both decrease because of reduced access to available water resources, which is a passive response, and decrease because of a shift to other crops (Marston and Konar Citation2017) or to water-saving technology, which is an active response. According to the results described above for the four basins, the adaptive response was clearly asymmetric between the wet and dry periods. This leads us to ask, what is the reason for the asymmetry in the HSC, leading to a positive spiral of economic growth and agricultural water consumption, at the risk of driving the system to collapse? Possible explanations for the asymmetry are discussed in the following section.
4.2 Alternative explanations for the asymmetry
The observed dynamics of HWC in the four study basins represents the collective behaviour of a community of human beings. Humans balance their own needs for water and the needs of the environment, which can be regarded as the driving forces underpinning the dynamics of HWC. The benefits humans obtain from water resources can simply be divided into two types: one is direct and certain economic benefits, including agricultural, industrial and domestic benefits, while the other is indirect and uncertain ecological benefits. The uncertainty here arises from the limits of scientific knowledge regarding the benefits derived from water left for the environment (Cabral et al. Citation2016), including the uncertainty about the tipping point of water resources use, beyond which disastrous consequences for both the environment and human well-being will occur (Dannenberg et al. Citation2011). We will discuss two theories about decision making under uncertainty as explanations for the asymmetry, one at the individual level, i.e. “prospect theory” (Kahneman and Tversky Citation1979), and at one at the community level, i.e. the “threshold uncertainty effect for public goods” (Dannenberg et al. Citation2011).
Traditional economics assumes that humans make decisions on the basis of total expected utility, known as “expected utility theory”. However, another branch of economics, i.e. “prospect theory” in behavioural economics, which explains how agents make decisions under risk (Kahneman and Tversky Citation1979, Tversky and Kahneman Citation1992), posits that humans perceive outcomes as just gains and losses, with loss aversion, rather than as the final states of wealth or welfare, and that people tend to over-react to low probability events and under-react to medium and high probability events by a variety of heuristic procedures, including “availability heuristic” and “representative heuristic” (Tversky and Kahneman Citation1973, Citation1992, Di Baldassarre et al. Citation2017). Accordingly, prospect theory states that, in general, humans tend to be risk averse when facing gains and risk seeking when facing losses under medium and high probability, and how they define gains and losses is relative to their reference points. For our case, at the onset of wet (positive) periods, the reference point is the benefit during the immediate past dry period and is relatively low. Facing the prospect of more water being available, and the likely gains in benefits, humans choose to exploit water fully to obtain a direct benefit with certainty, instead of regulating the increase of HWC and gaining some ecological benefit with uncertainty. Likewise, during dry (negative) periods, the reference point is the benefit in the immediate past wet period and is relatively higher, and humans face losses and are risk seeking. In the four basins, people took actions to offset the effect of decreasing water supply by keeping HWC high, clearly at a cost to ecosystems and the risk of system collapse. In the latter case, the consequence of system collapse and possible ecosystem degradation is no doubt severe, but in the perception of the humans it is indirect and with uncertainty. In other words, humans will not choose to lose directly by regulating and cutting down HWC, because the loss comes with more certainty and humans now are risk seeking. The capability to expand cultivated areas, pump groundwater, construct reservoirs and divert water for irrigation has increased to a higher level, and society takes all these actions to satisfy their water needs. Technology intensifies the capability of humans to act in this way, namely to prefer direct gains with certainty to ecological gains with uncertainty during wet periods, and to prefer indirect loss of ecosystem degradation (or collapse) with uncertainty to direct loss that comes with certainty during subsequent dry periods. If these two kinds of decisions are repeated during alternating wet and dry periods, the economy is likely to grow repeatedly in spurts, accompanied by increasing HWC, and, at the same time, ecological degradation will occur frequently and its accumulation will lead to a situation of possible system collapse. In this way, prospect theory explains the decision making that contributes to the asymmetric HWC response observed during wet and dry periods.
A complementary theory that may explain the observed asymmetry in the study basins is the threshold uncertainty effect for public goods (Dannenberg et al. Citation2011). According to this theory, water resources in the study areas can be seen as public goods. Public goods involve threshold effects, and using these resources beyond a tipping point can have disastrous consequences for the environment and human well-being in general (Lenton et al. Citation2008). Regulating HWC in these arid areas needs cooperation among several agents. Among several experimental studies finding uncertainty to be detrimental to cooperative outcomes (Gustafsson et al. Citation1999, Mcbride Citation2010), Dannenberg et al. (Citation2011) states that threshold uncertainty is harmful for cooperation on public goods. While prospect theory can explain water consumption behaviour at the individual level, the threshold uncertainty effect for public goods can help in understanding the collective behaviour. In our study, the threshold for over-exploitation of water and collapse of ecosystem is uncertain, and hampers individuals in cooperating to regulate their water-use behaviour on water resources. Hence, HWC increases rapidly during wet periods and only slightly decreases during dry periods, as observed in the four study basins. In other words, the combination of mechanisms behind prospect theory, operating at the individual level, and those behind the threshold uncertainty effect, for public goods at the community level, contribute to the asymmetrical dynamics of HWC in arid basins.
4.3 Framework to analyse consequences of human–water interaction
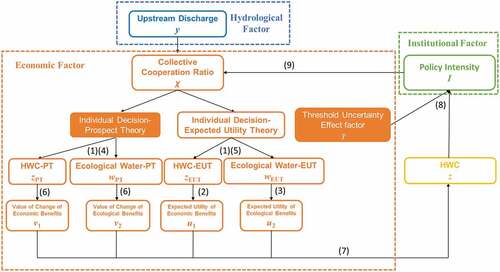
The asymmetrical dynamics of HWC at the intermediate-term scale has been interpreted by two complementary explanations mentioned above. To make this analysis more concrete, we establish a quantitative framework and a simplified model based on the two theories, as shown in . The hydrological factor, i.e. UD , is an external factor determining the volume of water available. For simplicity, the model considers the utility of water consisting of two parts: the utility of HWC
with certainty and probability of 1.0, and the utility of ecological water
with uncertainty and probability of
. The uncertainty has been explained in Section 4.2. Here
and
are HWC and ecological water, respectively, and water balance dictates that:
Figure 6. Conceptual framework to analyse asymmetric dynamics of HWC (numbers indicate equation). Humans make decisions based on expected utility theory and prospect theory on an individual scale. The collective cooperation ratio, χ, represents the extent to which individuals cooperate to make decisions. The institutional factor, , determines χ.
For simplicity, we confine the present discussion of utility to monetary outcomes only. Xiao et al. (Citation2008) explained why the relationship between water consumption and economic yield can be assumed to be quadratic. Following this, we assume that the utility functions for both HWC and ecological water assume quadratic forms with diminishing marginal utility, namely:
Note that, in arid regions, neither nor
should reach or exceed the apexes of the two quadratic functions, i.e. for the range of values of z and w, functions
and
will be chosen to monotonically increase with
and
.
We estimated HWC based on expected utility theory and
based on prospect theory. According to expected utility theory used in traditional economics (see Section 4.2), the utility of an uncertain prospect is the sum of the utilities of all the outcomes weighted by their probabilities. In our case, the total expected utility of HWC and ecological water, namely
, should be optimized:
However, as explained in Section 4.2, prospect theory states that the total value is the sum of utilities of all the outcomes multiplied by their decision weights. Correspondingly, we separate the value into two parts, including the values of gains or losses in the utilities of HWC and ecological water. In this case, the quantity to be optimized is the total value:
where is the gain or loss of the utility of HWC compared with reference to the last period, and
is its value;
is the value of gains or losses in the utility of ecological water compared with reference to the last period, and
is its decision weight. Specifically, the value
in prospect theory is assigned to gains and losses rather than to the final assets (Kahneman and Tversky Citation1979), and the value function represents how humans value gains and losses, which is taken as concave for gains and convex for losses (Tversky and Kahneman Citation1992):
where are risk attitude coefficients,
; λ is loss aversion coefficient and λ > 0. Additionally, in prospect theory, for decision making, the value of each outcome is multiplied by the decision weights
, where
is the probability of outcome. According to Tversky and Kahneman (Citation1992),
<
when
is a high or middle probability, whereas
>
when
is a low probability.
So far, we estimated HWC based on expected utility theory and on prospect theory,
. Compared to expected utility theory, prospect theory results in larger HWC on an individual scale and higher risk of system collapse. However, there is a gap between directly using the theories explaining individual behaviour and simulating collective behaviour. At the community level, not all agents act purely on prospect theory or expected utility theory. When facing UD
, the community needs to cooperate to regulate HWC to achieve optimized collective benefits, i.e. total expected utility, and avoid collapse of system. Generally, the higher the extent of cooperation, the more agents should make decisions based on expected utility theory instead of prospect theory. To simulate a mix of the two theories in action, i.e. HWC
at the community level, we used a collective cooperation ratio χ to represent to what extent individuals cooperate to make decisions based on expected utility theory. Here,
can be negative if cooperation is at a low level:
We simplify policy and management to regulate water use by the policy intensity factor, , which determines the collective cooperation ratio χ. Higher values of policy intensity
represent stricter policy and management, and, to be consistent with collective cooperation ratio χ, policy intensity
can also be negative if policy and management are missing. This approach is broadly consistent with previous approaches adopted in the socio-hydrological literature, but is a step forward as it invokes theories drawn from behavioural economics.
For example, Elshafei et al. (Citation2015) modelled the dynamics behind the observed pendulum swing in an Australian agricultural basin using a community-sensitivity state variable to capture changing community sentiments about economic and ecological utility. According to Elshafei et al. (Citation2015), policy intensity can be affected by normalized ecological and economic utility. Lower ecological utility and higher economic utility can increase policy intensity (Gonzales and Ajami Citation2017), while ecological degradation with economic development can increase humans’ willingness to regulate water use and protect ecosystems, as argued by Elshafei et al. (Citation2014). However, as stated above, the threshold uncertainty effect hampers cooperation at the community level, which is represented by :
where and
are normalized by the initial value of the first period
and
, while
and
indicate the sensitivity of economic utility
and ecological utility
Here
is the sensitivity of cooperation, indicating how much policy intensity
can affect collective cooperation ratio χ.
Based on the data of normalized UD and HWC in , we then built a model to simulate the dynamics of HWC in the four study basins, and calculate policy intensity , which is a key indicator to determine the collective cooperation ratio χ, and the dynamics of HWC. We prescribed the probability of obtaining ecological utility
, risk attitude coefficients
and
, loss aversion coefficient
, and decision weight
based on Tversky and Kahneman (Citation1992), and assigned the value of sensitivity of cooperation
as 1 for simplicity; the parameters are shown in . For the utility function, we unified
and calculated
so that simulated HWC based on expected utility theory for the first period equals observed HWC. The initial value of policy intensity
is assigned as 0, while the sensitivity of ecological utility
, sensitivity of economic utility
, and threshold uncertainty effect factor
are in total three parameters that were calibrated in each basin to minimize the sum of squared errors between the model predictions and historical data. also shows the calibrated parameters as well as average policy intensity
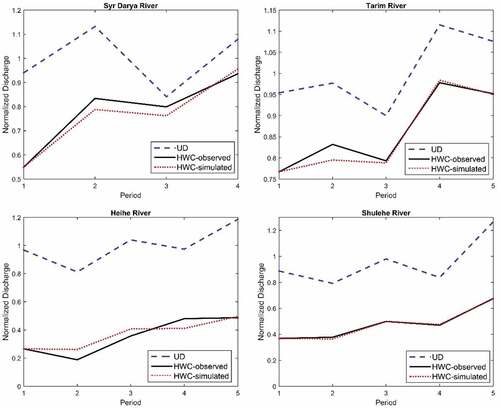
and the Nash-Sutcliffe efficiency (NSE) obtained in the four cases; shows the observed and simulated HWC for each basin. These results indicate that the patterns of asymmetric dynamics of HWC can be well simulated in the four study basins, i.e. relatively rapid increase of HWC in wet periods and slow decrease or even increase in dry periods, while all of the NSE values exceed 0.8. The Tarim, Heihe and Shulehe rivers have larger
than the Syr Darya River, leading to larger χ and relatively smaller increase in HWC during wet periods and thus smaller asymmetry of the dynamics of HWC, as mentioned in Section 3. This accords with the fact that water management in the Tarim, Heihe and Shulehe rivers, under the efficient unified central government of China, is stricter than that for the Syr Darya River, which is now governed by different countries.
Table 3. Parameters for the models in the Syr Darya, Tarim, Heihe and Shulehe river basins, and the Nash-Sutcliffe efficiency coefficient and averaged policy intensity for each basin
Figure 7. Observed and simulated normalized HWC in the four study basins: Syr Darya River, Tarim River, Heihe River and Shulehe River
4.4 Implications for water management
Apart from the four basins in our study, the ultimate consequences arising from the asymmetric dynamics of HWC during multiple alternating wet/dry cycles in different basins will eventually also differ. The Aral Sea and the Maya civilization collapsed in the end. However, the experience in the cases of the Murrumbidgee River Basin in Eastern Australia (Kandasamy et al. Citation2014) and the Lake Toolibin catchment in Western Australia (Elshafei et al. Citation2014) indicates that, under some circumstances, the pendulum can swing back from a total focus on agricultural development to caring for the environment. In these latter two cases, a change in community attitudes triggered community action and government intervention to put the system on a more sustainable path (Wei et al. Citation2017). In the case of the Tarim, Heihe and Shulehe river basins in China, there were massive government interventions to protect the environment, the systems were prevented from total collapse, and they were put on a path towards possible recovery.
Water management decisions are not mere economic decisions. According to Loucks et al. (Citation2005), water resources management is affected by the natural subsystem, economic subsystem and institutional subsystem. Referring again to the framework shown in , decisions regarding HWC and the dynamics of HWC are governed by a coupling of the hydrological factor with economic and institutional factors. The hydrological factor determines the volume of water available, including the nature of its variability. The economic factor determines the decisions humans make regarding, for example, irrigation area, size of the population, and investments in technology, which may form part of an economic–population loop (Elshafei et al. Citation2014) and collectively drive HWC to increase. The institutional factor includes water policies, laws and societal values and management (Sivapalan and Blöschl Citation2015), which help to regulate the increase in HWC. In our framework we took only policy intensity I into consideration.
More broadly, long-term water management in large river basins can be even more complex. As Srinivasan et al. (Citation2016) describe, the institutional basis from which humans make decisions, comprising societal values and norms, can itself evolve in time in response to changing hydrological and socio-economic conditions, including outcomes of past human decisions. Recent socio-hydrological studies have shown that the interactions between humans and nature that become manifest in human decisions about water, e.g. HWC, would ultimately evoke a change in societal values favouring the environment and efforts to restore ecosystem health. The change in values gives rise to emergent behaviour, such as the pendulum swing witnessed in the Murrumbidgee Basin in Australia, driving the socio-hydrological system towards a sustainable balance. However, institutional factors, such as changing societal values and culture (e.g. sensitivity of ecological utility and economic utility in the framework of HWC), evolve at a much slower rate than the economy, and the transition in favour of the environment and away from the economy will not be complete at intermediate or short time scales. The delay is a hidden mechanism that may help us to analyse the dynamics of HWC and thus understand the differences between failure, such as in the Aral Sea, and the “success” in the Murrumbidgee River Basin in Australia. This “delay effect” is a result of the slow pace of change in societal values with respect to the environment. In the four study basins, the economic behaviour has dominated system evolution over intermediate time scales, including the enhanced capability of humans (i.e. higher level of social productive force), which can be interpreted via complementary explanations including prospect theory and threshold uncertainty effect for public goods. However, the institutional behaviour in respect of regulations to protect the environment has not come into force yet because of this delay effect, and therefore has not had an impact on the mechanisms that contribute to the asymmetry in HWC.
Finally, how can the lessons learned from this work be useful for sustainable management, especially agricultural water management in arid landscapes where these challenges are most acute? Humans are now well equipped to exploit every drop of freshwater through the use of sophisticated technologies, in an upward spiral of HWC over the wet and dry cycles of water availability. In this context, due to the delay effect and in the absence of adequate planning, monitoring and regulation, intermediate time scales can be long enough for humans to destroy vulnerable eco-environmental systems through over-exploitation of available water resources. Clearly, humans should overcome such short-termism, and should acquire the capability for long-term management, accounting for hydrological variability and being more protective of the environment. The role of institutions is extremely critical in this regard. One unavoidable conclusion then is that, to avoid the delay effect of institutional factors and the asymmetric response, humans should take actions to balance economic and institutional factors not in a fixed long-term manner, but in a dynamic adaptive manner. This means that humans should restrain the increase in HWC during wet periods, through permitting a change of values to influence management dynamically. During dry periods, humans need to balance water for the environment and society, and again prevent water for the environment being the first to be cut back as supplies decrease. In other words, humans should allow institutional factors to enter management synchronously with economic factors.
5 Summary
The rapid growth of HWC has caused serious ecological degradation in many arid regions, driven by both hydrological variability and socio-economic growth. The intermediate time scale is important in characterizing both hydrological variability and water management. The interactions between economic development, water management and hydrological variability at intermediate time scales have the potential to lead to emergent behaviour, which was the focus of this study. In this paper, we presented results from an integrated socio-hydrological analysis of data collected from four arid river basins, the Syr Darya, Tarim, Heihe and Shulehe river basins. The analyses revealed that estimated HWC for agriculture in all four basins exhibited an asymmetric response to the alternating intermediate-term hydrological wet and dry cycles. During wet periods, abundant water resources inspire an economic boom, and induce rapid growth of HWC. In subsequent dry periods, the expanded economy is maintained through over-exploitation of the now reduced surface water resources, as well as the groundwater resources, and, as a result, HWC does not decrease commensurate to the reduced streamflow.
Discussion of the results indicates that the observed asymmetry in HWC between wet and dry periods can be interpreted at both individual and community levels, i.e. prospect theory and threshold uncertainty effect for public goods. Prospect theory suggests that, during wet periods, humans prefer direct gains with certainty to ecological gains with uncertainty, and accordingly they tend to increase their capacity to exploit as much of the available water for agricultural production as possible. In contrast, during dry periods, humans behave in a way to avoid immediate and certain economic loss through cutting down water consumption at the risk of an uncertain ecological degradation and future system collapse, and thus over-exploit the inadequate water resources. For collective behaviour, threshold uncertainty is harmful for the cooperation on water resources management among agents, which aggravates the asymmetric dynamics of HWC during alternating wet and dry periods. Based on the theories discussed above, we established a framework and simple model to simulate the asymmetric dynamics of HWC. In particular, the Tarim, Heihe and Shulehe rivers in China indicated larger averaged policy intensity than the Syr Darya River, a result that accords with the stricter water management prevailing in the former three basins.
In the absence of any regulatory controls, the net result of the asymmetry is an upward spiral of HWC, degradation of the environment and the possible collapse of the overall system. Whereas economic and social factors, which cause the asymmetric dynamics of HWC, may dominate at intermediate time scales, institutional behaviour that builds on changing human norms and values evolves at a much slower rate than the economy, which we have referred to as a delay effect. The delay effect is a hidden mechanism that permits us to explain or interpret differences in observed overall system dynamics between different river basins, from collapse to near collapse to recovery. The outcomes of this paper call for a new vision for water resources planning and sustainable management that accommodates the dynamic nature of human decision making under uncertainty.
Acknowledgments
The work in the paper was developed within the framework of the Panta Rhei Research Initiative of the International Association of Hydrological Sciences (IAHS).
Disclosure statement
No potential conflict of interest was reported by the authors.
Additional information
Funding
References
- Aghakouchak, A., et al., 2015. Aral Sea syndrome desiccates Lake Urmia: call for action. Journal of Great Lakes Research, 41 (1), 307–311. doi:10.1016/j.jglr.2014.12.007
- Boomer, I., et al., 2000. The palaeolimnology of the Aral Sea: a review. Quaternary Science Reviews, 19 (13), 1259–1278. doi:10.1016/S0277-3791(00)00002-0
- Cabral, R.B., et al. 2016. Unexpected management choices when accounting for uncertainty in ecosystem service tradeoff analyses. Conservation Letters, 10 (4) (2016-10-24). doi:10.1111/conl.12303
- Cai, X., Mckinney, D.C., and Rosegrant, M.W., 2003. Sustainability analysis for irrigation water management in the Aral Sea region. Agricultural Systems, 76 (3), 1043–1066. doi:10.1016/S0308-521X(02)00028-8
- Cheng, G., et al., 2014. Integrated study of the water-ecosystem-economy in the Heihe River Basin. National Science Review, 1 (3), 413–428. doi:10.1093/nsr/nwu017
- Constanza, R., et al., 2007. Sustainability or collapse: what can we learn from integrating the history of humans and the rest of nature? Ambio, 36 (7), 522–527. Available from: https://www.jstor.org/stable/25547806
- Cretaux, J.-F., Letolle, R., and Bergé-Nguyen, M., 2013. History of Aral Sea level variability and current scientific debates. Global and Planetary Change, 110, 99–113. doi:10.1016/j.gloplacha.2013.05.006
- Dannenberg, A., et al. 2011. Coordination under threshold uncertainty in a public goods game. Social Science Electronic Publishing. Available from:: https://papers.ssrn.com/sol3/papers.cfm?abstract_id=1983266
- Deng, M., 2009. Water resource management theory and practice in Tarim River Basin. Beijing, China: Science Press. ( In Chinese).
- Di Baldassarre, G., et al., 2017. Drought and flood in the Anthropocene: feedback mechanisms in reservoir operation. Earth System Dynamics, 8 (1), 225–233. doi:10.5194/esd-8-225-2017
- Ding, H., et al. 2001. The characteristics and some problems in the exploitation and utilization of water resources in the Shulehe River Basin, Gansu Province. Arid Zone Research, 18 (4). doi:10.13448/j.cnki.jalre.2002.01.009 ( In Chinese).
- Eliasson, J., 2015. The rising pressure of global water shortages. Nature, 517 (7532), 522–555. doi:10.1038/517006a
- Elshafei, Y., et al., 2015. A model of the socio-hydrologic dynamics in a semiarid catchment: isolating feedbacks in the coupled human-hydrology system. Water Resources Research, 51 (8), 6442–6471. doi:10.1002/2015WR017048
- Elshafei, Y., et al., 2014. A prototype framework for models of socio-hydrology: identification of key feedback loops and parameterisation approach. Hydrology and Earth System Sciences, 18 (6), 2141–2166. doi:10.5194/hess-18-2141-2014
- Fang, C.L. and Qiao, B., 2005. Optimal thresholds of urban economic development and urbanization under scarce water resources in arid northwest China. Acta Ecologica Sinica, 25 (9), 2413–2422. ( In Chinese).
- FAO, 2007. Coping with Water Scarcity: Challenge of the Twenty-first Century. Rome, Italy: United Nations Food and Agriculture Organization. Available from: http://www.fao.org/nr/water/docs/escarcity.pdf
- Fischer, T., et al., 2013. Hydrological long-term dry and wet periods in the Xijiang River basin, South China. Hydrology and Earth System Sciences, 17 (1), 135–148. doi:10.5194/hess-17-135-2013
- Fogt, R.L. and Bromwich, D.H., 2006. Decadal variability of the ENSO teleconnection to the high-latitude South Pacific governed by coupling with the southern annular mode. Journal of Climate, 19 (6), 979–997. doi:10.1175/JCLI3671.1
- Glantz, M.H., 1999. Creeping environmental problems and sustainable development in the Aral Sea basin. Cambridge, UK: Cambridge University Press.
- Gonzales, P. and Ajami, N., 2017. Social and structural patterns of drought-related water conservation and rebound. Water Resources Research, 53 (3), 10619–10634. doi:10.1002/2017WR021852
- Guo, X., et al., 2015. Stable isotopic and geochemical identification of groundwater evolution and recharge sources in the arid Shule River Basin of Northwestern China. Hydrological Processes, 29 (22), 4703–4718. doi:10.1002/hyp.10495
- Gustafsson, M., Biel, A., and Gärling, T., 1999. Overharvesting of resources of unknown size. Acta Psychologica, 103 (1–2), 47–64. doi:10.1016/S0001-6918(99)00024-4
- Hanson, R.T., Newhouse, M.W., and Dettinger, M.D., 2004. A methodology to asess relations between climatic variability and variations in hydrologic time series in the southwestern United States. Journal of Hydrology, 287 (1–4), 252–269. doi:10.1016/j.jhydrol.2003.10.006
- Kahneman, D. and Tversky, A., 1979. Prospect theory: an analysis of decision under risk. Econometrica, 47, 263. doi:10.2307/1914185
- Kandasamy, J., et al., 2014. Socio-hydrologic drivers of the pendulum swing between agricultural development and environmental health: a case study from Murrumbidgee River basin, Australia. Hydrology and Earth System Sciences, 18 (3), 1027–1041. doi:10.5194/hess-18-1027-2014
- Kuil, L., et al., 2016. Conceptualizing socio-hydrological drought processes: the case of the Maya collapse. Water Resources Research, 52 (8), 6222–6242. doi:10.1002/2015WR018298
- Lenton, T.M., et al., 2008. Tipping elements in the Earth’s climate system. Proceedings of the National Academy of Sciences of the United States of America, 105 (6), 1786. doi:10.1073/pnas.0705414105
- Li, C. and Ma, H., 2012. Relationship between ENSO and winter rainfall over Southeast China and its decadal variability. Advances in Atmospheric Sciences, 29 (6), 1129–1141. doi:10.1007/s00376-012-1248-z
- Li, W., et al., 2010. Water resources regulation and optimal allocation in arid inland basins of northwest China: the case of the Heihe River Basin. Beijing, China: Geological Publishing House. (In Chinese).
- Liu, Y., et al., 2014. Socio-hydrologic perspectives of the co-evolution of humans and water in the Tarim River basin, Western China: the Taiji-Tire model. Hydrology and Earth System Sciences, 18 (4), 1289–1303. doi:10.5194/hess-18-1289-2014
- Loucks, D.P., et al., 2005. Water resources systems planning and management: an introduction to methods, models and applications. Paris, France: UNESCO.
- Lu, Z., et al., 2015. Evolution of the human-water relationships in the Heihe River basin in the past 2000 years. Hydrology and Earth System Sciences, 19 (5), 2261–2273. doi:10.5194/hess-19-2261-2015
- Marston, L. and Konar, M., 2017. Drought impacts to water footprints and virtual water transfers of the central valley of California. Water Resources Research, 53 (7), 5756–5773. doi:10.1002/2016WR020251
- Marston, L., et al., 2015. Virtual groundwater transfers from overexploited aquifers in the United States. Proceedings of the National Academy of Sciences of the United States of America, 112 (28), 8561–8566. doi:10.1073/pnas.1500457112
- Mcbride, M., 2010. Threshold uncertainty in discrete public good games: an experimental study. Economics of Governance, 11 (1), 77–99. doi:10.1007/s10101-009-0069-8
- Micklin, P.P., Aladin, N.V., and Plotnikov, I., 2014. The Aral Sea: the devastation and partial rehabilitation of a great lake. New York, USA: Springer.
- Nezlin, N.P., Kostianoy, A.G., and Lebedev, S.A., 2004. Interannual variations of the discharge of Amu Darya and Syr Darya estimated from global atmospheric precipitation. Journal of Marine Systems, 47 (1–4), 67–75. doi:10.1016/j.jmarsys.2003.12.009
- Qi, J., et al. 2014. The characteristics and driving forces of LUCC in the middle and lower reaches of Shule River Basin. Chinese Journal of Ecology, 33 (8). doi:10.13292/j.1000-4890.2014.0209 In Chinese.
- Qi, J., et al., 2017. Responses of vegetation growth to climatic factors in Shule River Basin in Northwest China: a panel analysis. Sustainability, 9 (3), 368. doi:10.3390/su9030368
- Reason, C.J.C. and Rouault, M., 2002. ENSO-like decadal variability and South African rainfall. Geophysical Research Letters, 29 (13). doi:10.1029/2002GL014663
- Samian, M., et al., 2015. Identifying factors affecting optimal management of agricultural water. Journal of the Saudi Society of Agricultural Sciences, 14 (1), 11–18. doi:10.1016/j.jssas.2014.01.001
- Samuel, J.M. and Sivapalan, M., 2008. A comparative modeling analysis of multiscale temporal variability of rainfall in Australia. Water Resources Research, 44 (7), 663–671. doi:10.1029/2007WR006373
- Sivapalan, M. and Blöschl, G., 2015. Time scale interactions and the coevolution of humans and water. Water Resources Research, 51 (9), 6988–7022. doi:10.1002/2015WR017896
- Sivapalan, M., Savenije, H.H.G., and Blöschl, G., 2012. Socio-hydrology: A new science of people and water. Hydrological Processes, 26 (8), 1270–1276. doi:10.1002/hyp.8426
- Srinivasan, V., Konar, M., and Sivapalan, M., 2017. A dynamic framework for water security. Water Security, 19. doi:10.1016/j.wasec.2017.03.001
- Srinivasan, V., et al., 2016. Prediction in a socio-hydrological world. Hydrological Sciences Journal, 1–8. doi:10.1080/02626667.2016.1253844
- Tang, Q., Hu, H., and Oki, T., 2006. Hydrological processes within an intensively cultivated alluvial plain in an arid environment. Iahs Publication, 302, 134.
- Troy, T.J., et al., 2015. Moving sociohydrology forward: a synthesis across studies. Hydrology and Earth System Sciences, 19 (8), 3667–3679. doi:10.5194/hess-19-3667-2015
- Tversky, A. and Kahneman, D., 1973. Availability: A heuristic for judging frequency and probability. Cognitive Psychology, 5, 207–232. doi:10.1016/0010-0285(73)90033-9
- Tversky, A. and Kahneman, D., 1992. Advances in prospect theory: cumulative representation of uncertainty. Journal of Risk & Uncertainty, 5 (4), 297–323. doi:10.1007/BF00122574
- UNDP, 2006. Human development report 2006. United nations development programme. New York, NY, USA. Available from: http://hdr.undp.org/
- Wei, J., Wei, Y., and Western, A., 2017. Evolution of the societal value of water resources for economic development versus environmental sustainability in Australia from 1843 to 2011. Global Environmental Change, 42, 82–92. doi:10.1016/j.gloenvcha.2016.12.005
- Wilcoxon, F., Katti, S., and Wilcox, R.A., 1970. Critical values and probability levels for the Wilcoxon rank sum test and the Wilcoxon signed rank test. Selected Tables in Mathematical Statistics, 1, 171–259.
- Wu, G., et al., 2013. A dynamic model for vulnerability assessment of regional water resources in arid areas: a case study of Bayingolin, China. Water Resources Management, 27 (8), 3085–3101. doi:10.1007/s11269-013-0334-z
- Xia, Z., et al., 2013. Utilization of water resources in arid area abroad and its lessons. Beijing, China: China Water and Power Press. (In Chinese).
- Xiao, J., et al., 2008. Water production function during the whole growing stage for main crops in China. Chinese Agricultural Science Bulletin, 24 (3), 430–434. ( (In Chinese)).
- Xu, C., et al., 2006. Climate change and hydrologic process response in the Tarim River Basin over the past 50 years. Chinese Science Bulletin, 51 (S1), 25–36. doi:10.1007/s11434-006-8204-1
- Ye, M., Xu, H., and Song, Y., 2006. The utilization of water resources and its variation tendency in Tarim River Basin. Chinese Science Bulletin, 51 (S1), 16–24. doi:10.1007/s11434-006-8203-2
- Yong, H., 2012. Water and soil resources development and utilization in the tarim river basin from the perspective of public management. Beijing, China: Ecomomy and Management Publishing House. (In Chinese).
- Zhang, J., et al., 2003. Impact of climate change and variability on water resources in Heihe River Basin. Journal of Geographical Sciences, 13 (3), 286–292.
- Zhou, S., et al., 2015. Effects of human activities on the eco-environment in the middle Heihe River Basin based on an extended environmental Kuznets curve model. Ecological Engineering, 76, 14–26. doi:10.1016/j.ecoleng.2014.04.020