
 ?Mathematical formulae have been encoded as MathML and are displayed in this HTML version using MathJax in order to improve their display. Uncheck the box to turn MathJax off. This feature requires Javascript. Click on a formula to zoom.
ABSTRACT
To design and review the operation of spillways, it is necessary to estimate design hydrographs, considering their peak flow, shape and volume. A hybrid method is proposed that combines the shape of the design hydrograph obtained with the UNAM Institute of Engineering Method (UNAMIIM) with the peak flow and volume calculated from a bivariate method. This hybrid method is applied to historical data of the Huites Dam, Sinaloa, Mexico. The goal is to estimate return periods for the maximum discharge flows (that account for the damage caused downstream) and the maximum levels reached in the dam (measure of the hydrological dam safety) corresponding to a given spillway and its management policy. Therefore, to validate the method, the results obtained by the flood routing of the 50-year hydrograph are compared with those obtained by the flood routing of the three largest historical floods. Both maximum flow and elevation were in the range of values observed within 37.5–75 years corresponding to the length of the historical record.
Editor R. Woods Associate editor E. Volpi
1. Introduction
To design the spillways of dams with a significant regulation capacity, it is necessary to estimate design hydrographs considering the peak flow, shape and volume, which allow to one perform a risk analysis related to downstream disasters caused, for example, by a hydrological dam failure (Jiménez Citation2000). Once the hydrograph for several return periods is established, the flood routing for a selected size of spillway allows one to calculate the maximum level in the reservoir and the flow released through the control structure is conveyed downstream of the dam to estimate possible damage.
Domínguez and Arganis (Citation2012) pointed out that the statistical estimation of floods that can develop in a catchment is only a tool that is used as a first step; then, it is routed through the reservoir to obtain the design flow rate for the spillway. In other words, the final goal is to estimate return periods for the discharge flow rates and the maximum levels reached in the reservoir related to a given characteristic of the spillway and its management policy. The flow rates determine the magnitude of damage caused downstream, and the maximum storage levels measure the hydrological dam safety, as was also pointed out by Bianucci et al. (Citation2013), Gabriel-Martin et al. (Citation2017), Michailidi and Bacchi (Citation2017) and Sordo-Ward et al. (Citation2017).
Schumann (Citation2017) presented a short characterization of the concept of integrated flood risk management, where the options and concepts in flood risk management are discussed. This author uses a rainfall–runoff model to obtain design hydrographs using synthetic samples of daily rainfall; the peak flow–volume relationship was obtained for a joint return period by considering hazard scenarios of the type AND, OR and Kendall (Serinaldi Citation2015). More details about the hydrograph shape are not given. According to Serinaldi (Citation2015) “The concept of return period in stationary univariate frequency analysis is prone to misconceptions and misuses that are well known but still widespread”, “the concepts of probability of exceedance and risk of failure over a given design life period provide more coherent, general and suitable tools to measure and communicate the risk corresponding to hydrological and geophysical hazards”.
In recent decades, several studies have been performed from a statistical point of view to develop methods to obtain design events related to run-off for dams; for example, regional techniques and rainwater run-off models were used to estimate design hydrographs in ungauged basins (Sui Citation2005). Volpi and Fiori (Citation2012) made an analysis and obtained boundary limits for the selection of pairs of random variables with a bivariate distribution function, given a probability of non-critical joint overflow. Synthetic design hydrographs from unit hydrographs, using bivariate copula functions including analysis of flows and rainfall were done by Genest and Favre (Citation2007), Salvadori et al. (Citation2007), Mediero et al. (Citation2010), Serinaldi and Grimaldi (Citation2011) and Candela et al. (Citation2014).
Salvadori et al. (Citation2016) also pointed out that a hazard scenario is characterized by its specific geometry (the region of values that the bivariate probability distribution can take) and a suitable probability level. Their approach is well suited to cope with the notion of failure probability, a tool traditionally used for design and risk assessment in engineering practice. They support their work in copula theory, but this study does not emphasize the procedure to determine the temporal distribution of the flow rate magnitudes in the hydrograph, once having a pair of peak flow and volume values, given a return period.
According to Domínguez and Arganis (Citation2012) “Some procedures consider the peak flow rate and the volume of the flood on a joint basis. Applying bivariate distribution functions and the use of pairs for the multivariate flood analysis has been recently applied, however, they have limitations in some aspects such as the definition of the most suitable region for the integration of the bivariate distributions and in the inherent subjectivity in the estimation of the duration of the floods, the volume of the maximum historical floods and the shape of the design flood, among others”.
In contrast, Cavalcanti and Reis (Citation2017) proposed the most probable highest hydrograph method by comparing it against the frequency analysis method applying it to two sites in Brazil, they found the main difficulties were in the selection of the duration of the hydrographs. Volpi and Fiori (Citation2014) highlighted that each particular structure has a given return period for its eventual failure in a multivariate environment and it is important to consider several design events. They analyse different peak flow–volume curves, in addition to peak flow–return period curves given a certain volume; they describe the hazard scenarios: AND, OR, Kendall, survival Kendall and Structural type for joint return periods; the aspect of shape and duration of the design hydrograph is not explained in their study.
Hassini and Guo (Citation2017) also investigated the importance of the shape of the design hydrographs and obtained curves of peak flow behaviour as a function of the return period, given the time of concentration in a small urban basin using rainfall run-off models with triangular and trapezoidal unit hydrographs. Tomirotti and Mignosa (Citation2017), obtained synthetic hydrographs for gauged basins, without giving a priori form to the hydrograph but considering the frequency of the flow decay with the duration and the position of the peak flow in the hydrograph.
Genetic algorithms have been successfully used as an optimization technique to estimate parameters of univariate and bivariate functions to determine design floods (Domínguez et al. Citation2009, Preciado et al. Citation2010, Fuentes et al. Citation2015a). The estimation uncertainty in bivariate frequency analysis could be very high (Serinaldi Citation2013); for this reason, the selection of the proper result for design purposes must be carefully reasoned, and flood routing is a useful tool for this purpose.
In the study of Fuentes et al. (Citation2015), the estimation of the duration of a design hydrograph based on the analysis of historical floods is emphasized but the study does not consider optimized factors for all the ordinates of the hydrograph.
This paper presents the update and routing of the design hydrograph for a 10 000-year joint return period of the Luis Donaldo Colosio (Huites) Dam (Ramírez and Aldama Citation2000) with an AND hazard scenario type according to Salvadori et al. (Citation2016). The dam used in this study is located in the state of Sinaloa, Mexico. The information for the design hydrographs calculated in 2009 for this dam was taken as the reference (Domínguez et al. Citation2009). The historical record was refined and new information provided by the Comisión Nacional del Agua (CONAGUA) was considered (see Section 3.1). We obtained a historical record of average daily flow for the period 1942–2016, that is 75 years of information. Taking into account that the hydrograph shapes obtained in previous studies that used bivariate distribution functions – for example, Ramírez and Aldama (Citation2000), who used Hermitian polynomials, or Hiemstra and Francis (Citation1979), who used the Pearson function – led to unimodal hydrographs whose shape differs from that of the historical floods. In this study, a novel procedure is proposed that uses, on the one hand, the results obtained with the bivariate probability distribution function (pdf) to estimate the peak and volume flow of the design flood, and on the other, the UNAM Institute of Engineering method (UNAMIIM) to shape the design hydrograph, with the use of optimized factors applied to the ordinates of the hydrograph.
2. Methodology
This section describes the hybrid method proposed along with the procedures used in each step of its application.
2.1. Hybrid method
The hybrid method proposed takes as initial approach the computation of the hydrograph with the UNAMIIM (Vázquez Citation1995, Domínguez and Arganis Citation2012) described below. It estimates the duration of the hydrograph from the maximum historical flood analysis. In parallel, the value of peak flow and design volume for a joint return period is calculated from a bivariate analysis. To calculate the design flood, the design hydrograph obtained as a first approach with the UNAMIIM is modified as explained later. Additionally, results of flood routing simulations are considered to define the best design hydrograph for different pairs of peak and volume flow values previously selected from the bivariate analysis.
The details of the methods used in combination first to get the peak flow and volume by bivariate analysis, and second, to shape the hydrograph () are described below.
Figure 1. Hybrid method blocks diagram.
2.1.1. UNAM Institute of Engineering method (UNAMIIM)
The UNAMIIM (Vázquez Citation1995, Domínguez and Arganis Citation2012) obtains design hydrographs for different return periods using the historical records of average daily flows as follows.
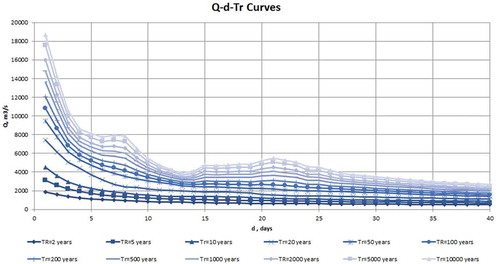
From the historical database, the annual maximum average flows observed for durations (windows of time) of one, two, three, n days, are obtained. For the average maximum flow of each duration, the pdf with the best fit is obtained to compute the maximum flow for different return periods. This procedure allows to construct the flow–duration–return period curves ().
The ordinates of the hydrograph for a selected return period are obtained from the curves (), the ordinate for the day i,
is obtained with the recursive Equation (1) (Vázquez Citation1995, Domínguez and Arganis Citation2012):
where is the individual flow for day i,
is the maximum average flow for day i (from the curve
), and
is the individual flow for day k, where k is an index that goes from duration i – 1 to duration 1.
With the ordinates obtained for the durations with increments of one day up to n days, the shape of the design flood is obtained using the alternating blocks method (Chow et al. Citation1988) which consists in placing from the centre of the hydrograph in an alternate fashion each one the ordinates obtained with Equation (1).
Another way to perform the ordering of the ordinates of the hydrograph is by means of a spectral analysis (Fuentes et al. Citation2015, Dueñas Citation2017) where the maximum historical floods are analysed for n days of duration assuming that the peak flow occurs the same day. Then, the hydrographs are normalized by dividing each ordinate by the peak flow; the average of these fractions is determined by adjusting them from higher to lower to define the position of each bar of a new design hydrograph. Similar procedures are expressed in the studies carried out by Requena et al. (Citation2013) and Yin et al. (Citation2018).
A third way to perform the ordering of the ordinates of the hydrograph is by means of analysis of the average daily flows that gave the maximum average for a time equal to the base time of the flood. For each historical flood, the first position is obtained on the day when the peak flow was present; the second position is selected from the day of higher flow rate to the peak (before or after); and the third position will be again, for the successive days, the largest data and so on, until the entire hydrograph is sorted out. For the 10 largest historical floods, the sum of the squared differences between the ordering of each of these maximum floods with respect to the order of the total register is calculated, and the order that reports the smallest total sum of the squared differences is selected. This order is used to give shape to the design flood from the ordinates of the hydrograph obtained with the UNAMIIM.
It has been objected that the UNAMIIM assumes that the maximum mean flows associated with different durations occur simultaneously and, therefore, the method will lead to an over-dimensioning of the spillway capacity; however, the method is based on the hypothesis that the critical conditions for the spillway (maximum discharge flow rate and elevation of the maximum water level) are associated with a unknown duration in advance so that, when considering all durations, the method incorporates such critical duration.
2.1.2. Analysis of bivariate frequencies
These procedures are useful in studies where it is important to determine the peak flow and volume; the joint pdf of the historical values of peak flow and volume of annual maximum floods is used.
Hydrological variables such as volume and peak flow are commonly best fitted by Gumbel and double Gumbel pdf for most regions of Mexico (Vázquez Citation1995, Domínguez and Arganis Citation2012).
Here we used a method that applies the joint distribution of flow peak and volume (Ramírez and Aldama Citation2000, Domínguez et al. Citation2009, Arganis et al. Citation2013). The joint distribution is represented by:
where FqV is the bivariate distribution function; Fq is the marginal distribution function of the peak flow, Qp, which depends on the parameters a1, c1, a2, c2 and pQp; FV is the marginal distribution function of the volume, V, with parameters a3, c3, a4, c4 and pV, and m is the association parameter related to the cross-correlation coefficient, , of Qp and V (Ramírez and Aldama Citation2000), given by:
If the marginal functions Fq and FV are double Gumbel type (Equations (4) and (5)). The double Gumbel bivariate distribution function consists of 11 parameters that were calculated in this paper by an optimization method based on genetic algorithms (Holland Citation1975, Goldberg Citation1989). The range of values for the calculation can be obtained from the univariate probabilistic analysis of the marginal distributions.
With the bivariate distribution function and a proposed joint design return period (TQpV), as in Equation (6), the volume-peak flow-return period curves are obtained and for the desired return period the combination peak flow and volume is selected based on the criteria that they would generate the most unfavourable outflow for the spillway.
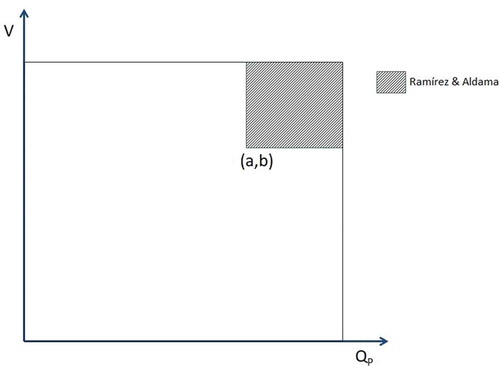
According to Salvadori et al. (Citation2016), “a Hazard Scenario can be conceived as a set containing all the occurrences x classified to be ‘dangerous’ (that is to say, possibly affecting/damaging a given structure) according to some suitable criterion”. Therefore, the region for the joint return period of Equation (6) () corresponds to the shape of a bivariate AND hazard scenario type in which for the occurrence of the event X belonging to the region of population it is necessary that all the variables Xi, with i = 1, 2, …, d, exceed the corresponding thresholds xi.
Figure 2. Ramírez and Aldama joint return period.
2.1.3. Hybrid method for shaping the design hydrograph
In a first stage, the design hydrograph for a specific return period, obtained using the UNAMIIM, is normalized by the peak flow; then the normalized hydrograph is multiplied by the bivariate design peak flow. Subsequently, the volume of the design flood is calculated and if this volume does not coincide with the bivariate design volume, a correction of the ordinates before and after the peak flow is made. The correction is made using factors calculated by optimization (the Solver® tool of MS Excel was used in this paper). The number of factors equals the number of the hydrograph ordinates except the one corresponding to the peak flow.
When the positive factors are multiplied by the ordinates of the hydrograph before and after the peak flow, the area under the hydrograph is equal to the bivariate design volume estimation.
The procedure allows to get a design hydrograph that preserves the shape of the historical floods. It has the peak flow and the volume obtained with the bivariate function in addition to preserve the base time; this condition is not satisfied by other methods (for example, that of Hermitian hydrographs (Ramírez and Aldama Citation2000). The procedure explained here was applied before to the cases of the inflow flood to the Aguamilpa Dam (Arganis Juárez and Preciado Jiménez Citation2017) and to the Infiernillo Dam (Arganis Juárez et al. Citation2017), both located in Mexico, and the design flood shape that resulted was very similar to the historical ones.
2.2. Flood routing (laminating floods)
Flood routing through the reservoir of the dam allows us to estimate the outflow during the occurrence of an inflow along a reservoir, given the initial conditions of storage and knowing the extraction operation rules for the spillway. In this study, we used a numerical flood routing method for reservoirs, which solves the equation of continuity in finite differences and considers a curve of elevation–capacities–spillway discharge (Aparicio Mijares Citation2012).
In this paper, the flood routing is an auxiliary tool for the selection of the most unfavourable inflow floods to the reservoir, knowing the maximum outflow in addition to the maximum water level elevation that would be reached by the reservoir.
2.3. Limitations of the methodology
It should be pointed out that there are different ways to include the instantaneous peak flow of the design floods in the hydrograph, but this is done with an analysis of instantaneous maximum flows that was not made in this study because of the large regulation capacity of the Huites Dam. Therefore, only the maximum flow is presented as if it occurred throughout the day in the central bar of the hydrograph. The procedure to determine the peak flow of the flood can be seen in Domínguez et al. (Citation2015).
The selected flood routing method has the limitation that an appropriate selection of the time increment must be carried out to guarantee the stability in the solution of the numerical scheme.
3. Application
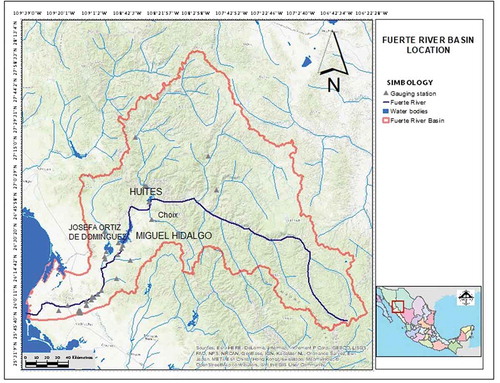
The Luis Donaldo Colosio Dam (also known as Huites), Sinaloa, was built between 1992 and 1995. It is located within the basin of the Fuerte River, in the North Pacific Hydrometric Division, downstream of the Chinipas hydrometric gauge (where the run-off of the Oteros River is measured) and the Tubares gauge (which measures the run-off of the Urique, Batopilas and San Miguel rivers). The dam is part of the dam system of the Fuerte River together with the Josefa Ortíz de Domínguez and Miguel Hidalgo dams (). The reservoir area is approximately 7650 ha, with a flood regulation capacity of 1660 hm3. The dam is made of concrete and is over 160 m high, with the crown length and width of 422 m and 8 m, respectively. The elevations of OMWL (minimum water level), NWL (normal water level) and MWL (maximum water level) are, respectively: 162, 270 and 290 m a.s.l., with capacities to these elevations of 8.20, 2908 and 4568 hm3, respectively (CEMARCOSIN Citation2017). The maximum discharge flow for the overflow spillway (two tunnels) is 22 445 m3/s.
Figure 3. Huites Dam location on the Fuerte River, Sinaloa, México. Source: Institute of Engineering, UNAM.
Institute of Engineering, UNAM.
3.1. Historical data
The daily average flow records of the Huites gauges were obtained from the Surface Water National Data Bank (BANDAS, CONAGUAFootnote1) for the period 1942–1992. For the period from 1993 to 1994, the Huites Dam data were estimated using factors from the gauging station no. 10123 (Tubares) and from 1995 to 2016, the data of average daily flows (75 years of historical data) were estimated from the volumes of income estimated from the operation rules reported by the Comisión Nacional del Agua.
3.2. Hybrid method
3.2.1. UNAMIIM
The UNAMIIM was applied to the maximum historical average flows for durations from 1 to 40 days. When the frequency analysis of the series of annual maximums was performed, the best fitting distribution function was the double Gumbel type for all the durations (see Section 2.1.2), based on the criterion of the lowest standard error.
presents the results of adjusting the double Gumbel pdf to the measured annual maximum average flow for one day, and the parameters of this distribution function are given in . presents the behaviour of the parameters from the double Gumbel functions as the duration increases. The flow–duration–return period curve obtained with this analysis appears in .
Table 1. Parameters of better adjustment for the double Gumbel pdf for the maximum discharge Qp and volume V at Huites Dam, Sinaloa, México.
Figure 4. Results of adjusting the double Gumbel function to the annual maximum mean daily flow Qp for Huites Dam, Sinaloa, México.
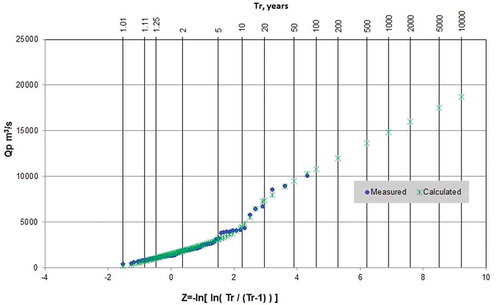
Figure 5. Variation of the double Gumbel function parameters with the duration for the maximum average flows – study of Huites Dam, Sinaloa, México.
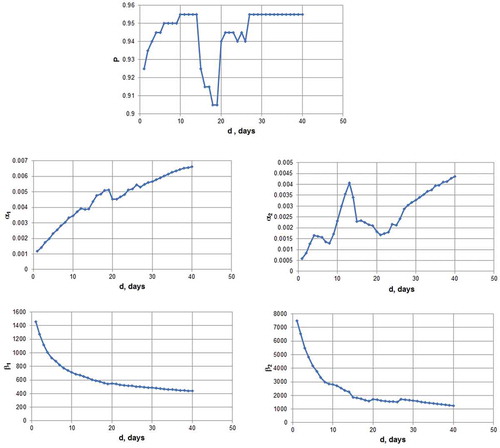
Figure 6. Flow–duration–return period curves by the UNAMIIM approach.
From , the variability of the P parameter is observed as the duration increases; however, it stabilizes for durations larger than 26 days. The α1 parameter has an increasing trend, the α2 parameter varies in cycles of growth and decay, while the β1 and β2 parameters have a logarithmic decreasing behaviour with respect to the duration. Parameter P measures the probability that a maximum annual value comes from the first population, and, in the case of the Huites Dam, its value fluctuates between 0.9 and 0.95. Parameters α1 and α2 are the scale parameters of the first and second populations, respectively, and the variations of α2 are due to the fact that, in the 40 days’ duration, a sequence of events occurs, that is to say the hydrographs are multimodal, as described below.
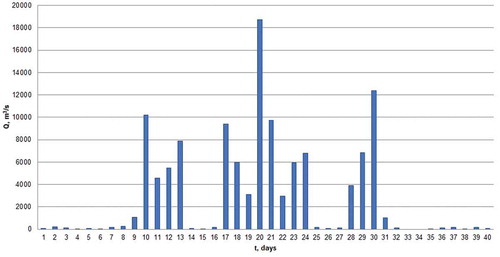
Using the flow–duration data from , the design flood for a return period of 10 000 years was calculated. From the average maximum flows obtained for that return period, the individual flows were determined and, finally, the alternating blocks method was used to shape the hydrograph. The design flood obtained is shown in . The maximum mean daily flow for this flood is Qp = 18 708.11 m3/s and its volume V = 10 216.8 hm3.
Figure 7. Design flood for Tr= 10 000 years based on UNAMIIM alternating blocks, for Huites Dam, Sinaloa, México.
3.2.2. Bivariate method
For the maximum annual floods, maximum mean daily flow series (in m3/s) and flood volumes (in hm3) were obtained. A 40 days base time was considered, as obtained in the study of Domínguez et al. (Citation2009) (taking into account the behaviour of the reservoir after design flood routing). Both series were subject to a frequency analysis with the AX software (Jiménez Citation1996) to obtain the marginal distribution functions of better fit. Both functions were double Gumbel and they describe better the historical population than the Gumbel distribution function. In and these functions are compared graphically with the historical data, and the parameters are presented in .
Figure 8. Results of adjusting the double Gumbel function to the volumes V for Huites Dam, Sinaloa, México.
The parameters of the bivariate function were obtained by the maximum likelihood method from the parameters of the marginal double Gumbel distribution functions, which were utilized as midpoints of the search interval. The association parameter of the bivariate function was obtained by defining as midpoint of the search interval the cross-correlation coefficient of the historical peak flow and volume annual data time series using Equation (3).
The search intervals utilized by the optimizing algorithm for the 11 parameters to be determined in the double Gumbel bivariate pdf are listed in (columns 3 and 5). The optimal solution obtained by the GA considering an initial population of 200 individuals and 5000 iterations is shown in (column 6).
Table 2. Search interval of the parameters of the double Gumbel bivariate distribution function for the genetic algorithm and optimal solution with GA. Huites Dam, Sinaloa, México.
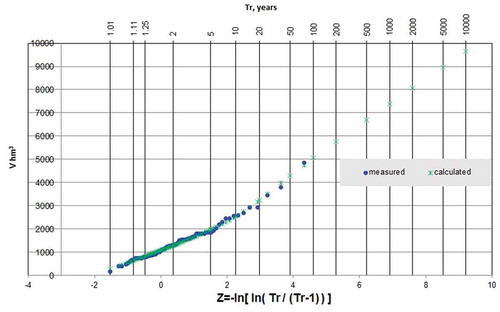
The comparison between empirical probabilities and the bivariate function is shown in . In addition, we contrasted the identity function and the trend line.
Figure 9. Comparison of empirical and calculated double Gumbel bivariate distribution function with respect to an identity function.
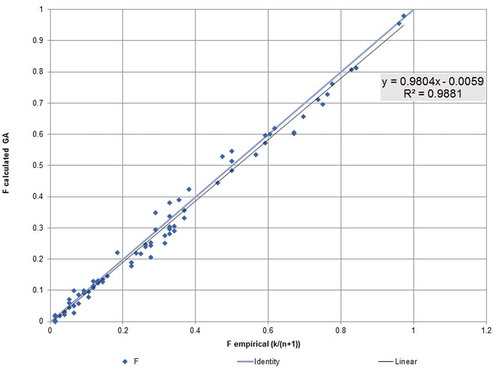
With the estimated bivariate function, the joint return period and peak flow values were set to obtain design volumes. These results helped in the creation of volume–peak flow–return period curves (V–Qp–Tr) ().
Figure 10. Volume–peak joint return period curves by bivariate analysis for the Huites Dam, Sinaloa, México.
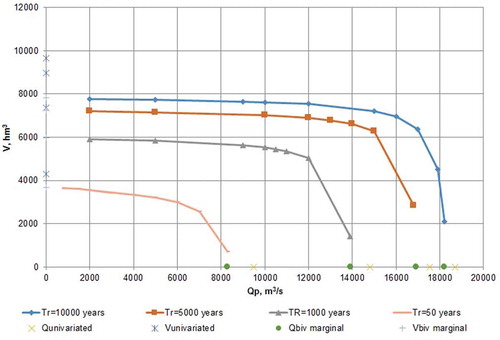
The peak and volume flow values of the marginal functions were also added to the curves of , using univariate analysis and with the parameters obtained from the bivariate double Gumbel distribution function (). These last points give information of the values of peak flow and volume limits that these V–Qp–Tr curves can take.
Table 3. Parameters of double Gumbel marginal functions from bivariate analysis.
shows that, for a given joint return period, there are different combinations of peak Qp and volume flow V that satisfy Equation (6). The choice of the most unfavourable combination makes it necessary to inspect the operation of the spillway by simulating the flood routing. In the case of Huites Dam one pair of Qp and V corresponding to high peak and low volume flows, one of intermediate peak and one of high V were selected to observe their effects; the pair of values of Qp and V that cause the most unfavourable flood, that is maximum storage levels, were selected for a given return period.
3.2.3. Shaping the hydrograph
From the bivariate analysis, for the joint return period of 10 000 years, the pairs of peak and volume flow selected were: (a) Qp = 18 200 m3/s and V = 2112.71 hm3, (b) Qp = 17 000 m3/s and V = 6373.31 hm3 and (c) Qp = 15 000 m3/s and V = 7221.54 hm3.
In contrast, the hydrograph obtained by the IIUNAMM was taken as a basis, normalizing it with respect to its peak flow. The normalized hydrograph was multiplied by the bivariate peak flow and the volume of the flood was obtained.
With optimization via the MS Excel Solver tool, factors affecting the ordinates of the previous hydrograph were obtained (considering a factor equal to one in the peak flow) in order to obtain the volume of the flood obtained with the bivariate analysis.
The hydrograph shapes for the three pairs of values given above are shown in , () and (), respectively.
Figure 11. Design floods for Tr = 10 000 years by the hybrid method for Huites Dam, Sinaloa, México.
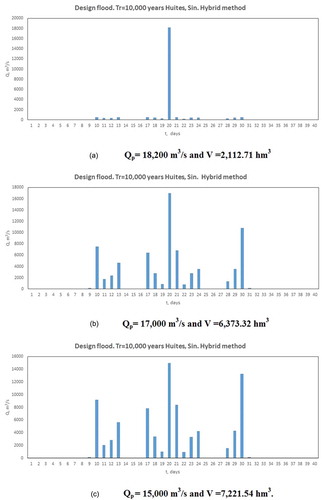
For the first pair of Qp and V, it is observed that it is possible to keep the peak on the same day as the hydrograph obtained with the Institute of Engineering method. However, the consequence is a considerable reduction of the rest of the ordinates due to the low flood volume. With the second and third pairs of Qp and V, the hybrid method preserved both the peak flow and the volume. In addition, the shape is similar to that obtained with the Institute of Engineering method.
3.3. Flood routing
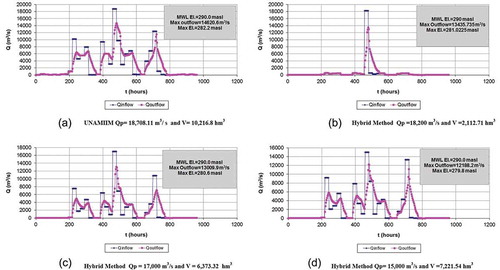
The flood routing was calculated with the hydrograph obtained by means of the UNAMIIM and with the three hydrographs obtained with the hybrid method to get the maximum outflow through the spillway and the maximum water level elevation reached in the reservoir. The case of the UNAMIIM is shown in ) and the cases of the hybrid method in )–().
Figure 12. Flood routing results.
4. Discussion
The flood routing with the hydrographs obtained shows that the most conservative result was obtained with the UNAMIIM for a maximum water level elevation in the reservoir of 282.25 m and a maximum outflow of 14 620.61 m3/s. The following most conservative result corresponds to the case of using the hydrograph of the hybrid method with a large peak and low volume (Qp = 18 200 m3/s and V = 2112.71 hm3), with a maximum water level elevation of 281.02 m and a maximum outflow of 13 435.74 m3/s. In contrast, for the flood with Qp = 17 000 m3/s and V = 6373.32 hm3, the maximum elevation was 280.61 m and the maximum outflow was 13,009.94 m3/s. With a lower flood of Qp = 15 000 m3/s and a lower volume of V = 7221.54 hm3, the maximum elevation that would be reached in the reservoir was 279.77 m, with a maximum outflow of 12 188.20 m3/s.
Considering that the calculation of the design floods has as ultimate purpose the estimation of the hydrological risk of the dam, determined by the maximum level reached by the surface of the water in the dam, and the impact in the floodplains downstream caused by the maximum discharge flow through the spillway (Domínguez et al. Citation2009), the following additional calculations were made:
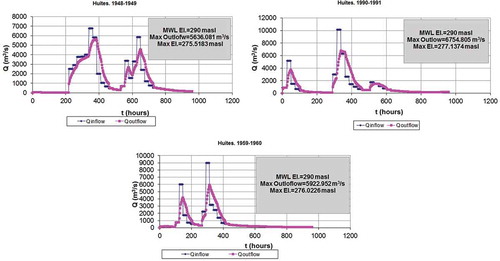
the simulation of the flood routing of the three largest historical flows: the maximum water level elevation and the maximum discharge flow were obtained, as shown in ;
Figure 13. Historical maximum flood routing for Huites Dam.
given that the historical annual dataset has 75 records, the empirical return periods shown in were assigned; and
Table 4. Empirical return period for maximum outflow and water level elevation for historical and design floods. Huites Dam, Sinaloa, México.
the design flood routing obtained for a return period of 50 years was simulated with the method of the UNAMIIM and with the hybrid method proposed in this paper (Qp = 7196.7 m3/s and V = 2565.996 hm3) ( and ).
Figure 14. Flood routing Tr = 50 years by UNAMIIM and hybrid methods (Qp = 7196.7 m3/s and V = 2565.996 hm3).
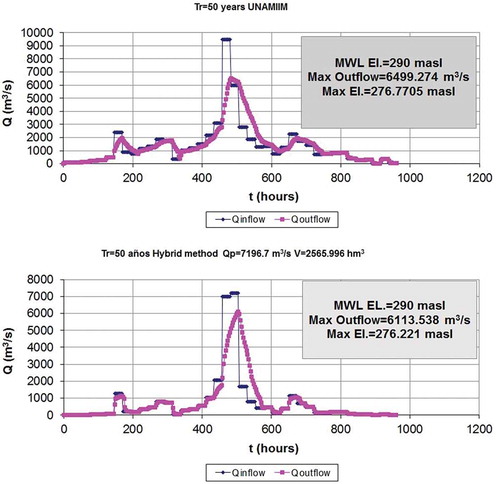
When comparing these last flood routing results with those obtained by simulating the historical floods, it is observed that both the maximum flow and the elevation are in the range of 37.5–75 years. As expected, the flood estimated with the UNAMIIM leads to more conservative results, but is consistent with those obtained with historical floods.
It is suggested to carry out in a future study a more detailed analysis of the probabilistic behaviour of the annual maximum water level elevations that would be attained in the reservoir with the historical record, in order to obtain stronger conclusions regarding the safety of the dam, taking into account the concept of a routed return period (Tdam) as presented by Domínguez et al. (Citation2009) and Requena et al. (Citation2013).
5. Conclusions
For some reservoirs, it is important to consider three characteristics of the design hydrographs: the peak flow, the shape and the volume. For this purpose, in this paper, we proposed a hybrid method that uses the bivariate probability distribution function to consider the calculation of both the peak flow and the volume of design flood, and the UNAMIIM with optimized factors in the ordinates of the hydrograph to obtain the shape of the design hydrograph. The proposed hybrid method was applied to data from the Huites Dam, Sinaloa, in Mexico.
The selection of the appropriate pairs of peak flow and volume from the bivariate analysis depends on the characteristics of the flood routed through the reservoir under analysis. The comparison of the routed flood through the reservoir of the Huites Dam, with the three floods obtained with the hybrid method, indicates that the results associated with high peak and low volume are more conservative compared to those obtained from floods of medium or low peak flows and high volumes.
To validate the results, design hydrographs were estimated for a return period of 50 years. Such hydrographs were routed through the dam to obtain the maximum water level elevation in the reservoir and the maximum outflow. The results of the estimated hydrograph were then compared with the results of the routing of the maximum historical floods, and it was noticed that both maximum flow and elevation are in the range of values observed within 37.5–75 years corresponding to the length of the historical record.
Acknowledgments
We want to thank the Engineer Brenda Rodríguez Hidalgo for help in the formatting of the document.
Disclosure statement
No potential conflict of interest was reported by the authors.
Notes
References
- Aparicio Mijares, F.J., 2012. Fundamentos de Hidrología de Superficie (Surface hydrology fundamentals, in Spanish). México, D.F: Limusa, 303.
- Arganis, J.M.L., Herrera, A.J.L., and Domínguez, M.R., 2013. Determinación de eventos de diseño de funciones bivariadas usando el método de la bisección (Determination of design events of bivariate functions using the bisection method, in Spanish). Ingeniare, 21 (2), 293–300. doi:10.4067/S0718-33052013000200012
- Arganis Juárez, M.L., De Luna Cruz, F., and Preciado Jiménez, M., 2017. Método híbrido para construir hidrogramas de diseño con datos de caudal de pico y volumen (Hybrid method to build design hydrograms with peak and volume flow data, in Spanish). Memorias de las V Jornadas de Ingeniería del Agua JIA, 25 Y 26 de octubre, La Coruña, España, 1–11.
- Arganis Juárez, M.L. and Preciado Jiménez, M., 2017. Determinación de la avenida de diseño de la cuenca total de Aguamilpa con análisis bivariado e hidrogramas normalizados (Determination of the design flood of the total basin of Aguamilpa with bivariate analysis and standardized hydrographs, in Spanish). Memorias del XXIV Congreso Nacional de Hidráulica, AMH, Acapulco, Gro, México, 1–6.
- Bianucci, P., et al., 2013. Risk-based methodology for parameter calibration of a reservoir flood control model. Natural Hazards and Earth System Sciences, 13 (4), 965–981. doi:10.5194/nhess-13-965-2013
- Candela, A., Brigandì, G., and Aronica, G.T., 2014. Estimation of synthetic flood design hydrographs using a distributed rainfall–runoff model coupled with a copula-based single storm rainfall generator. Natural Hazards and Earth System Sciences, 14, 1819–1833. doi:10.5194/nhess-14-1819-2014
- Cavalcanti, D.L.O. and Reis, L.F.R., 2017. Maximum design flow estimates for large basins using the Local Frequency Analysis (LFA) and the Most Probable Maximum Hydrograph (MPMH) methods – a critical analysis. Water Resources Management, 31, 127–141. doi:10.1007/s11269-016-1514-4
- CEMARCOSIN,2017. Available from: http://laipsinaloa.gob.mx/images/stories/CEMARCOSIN/EMBALSES%20FINAL(1).pdf [Accessed 22 April 2019].
- Chow, V.T., Maidment, D.R., and Mays, L.W., 1988. Applied hydrology. New York: McGraw-Hill.
- Domínguez, M.R., et al., 2015. Manual de Diseño de Obras Civiles. Cap. A.1.8 Sección A. Hidrotecnia Tema 1: hidrología. México: Comisión Federal de Electricidad.
- Domínguez, M.R. and Arganis, J.M.L., 2012. Validation of methods to estimate design discharge flow rates for dam spillways with large regulating capacity. Hydrological Sciences Journal, 57 (3), 460–478. doi:10.1080/02626667.2012.665993
- Domínguez, M.R., et al., 2009. Calculation of Bivariate Double Gumbel probability density function via a Genetic Algorithm: application to Huites dam basin. Journal of Flood Engineering (JFE), 1 (1), 293–300. Available from: http://serialsjournals.com/articles.php?volumesno_id=1171&journals_id=281&volumes_id=1069
- Dueñas, P.D., 2017. Estimación de avenidas de diseño para la presa Infiernillo, a partir de métodos estadísticos y espectrales (Estimation of design floods for the Infiernillo dam, based on statistical and spectral methods, in Spanish). Papiit Project. Master‘s Thesis. Posgrado en Ingeniería, Facultad de Ingeniería, UNAM., México.
- Fuentes, M.O., et al., 2015a. Maximización de la función de verosimilitud de distribuciones de probabilidad usando algoritmos genéticos (Maximization of the probability distributions likelihood using genetic algorithms, in Spanish). Revista Ingeniería del Agua, Universidad Politécnica de Valencia, 19 (1), 17–29. doi:10.4995/ia.2015.3225
- Fuentes, M.O.A., et al., 2015. B. Estimate of design hydrographs for the Angostura dam, Sonora, using statistical and spectral methods. Water Resources Management, 29, 4021–4043. doi:10.1007/s11269-015-1043-6
- Gabriel-Martin, I., et al., 2017. Influence of initial reservoir level and gate failure in dam safety analysis. Stochastic approach. Journal of Hydrology, 550, 669–684. doi:10.1016/j.jhydrol.2017.05.032
- Genest, C. and Favre, A.C., 2007. Everything you always wanted to know about copula modeling but were afraid to ask. Journal of Hydrologic Engineering, 12 (4), 347–368. doi:10.1061/(ASCE)1084-0699(2007)12:4(347)
- Goldberg, D.E., 1989. Genetic algorithms in search, optimization & machine learning. Boston, MA: Addison-Wesley Longman Publishing Co.
- Hassini, S. and Guo, Y., 2017. Derived flood frequency distributions considering individual event hydrograph shapes. Journal of Hydrology, 547, 296–308. doi:10.1016/j.jhydrol.2017.02.003
- Hiemstra, L.A.V. and Francis, D.M., 1979. The run hydrograph. In: Theory and application for flood predictions. Pretoria, South Africa: Water Research Commission, 63.
- Holland, J.H., 1975. Adaptation in natural and artificial systems. Ann Arbor, MI: University of Michigan Press.
- Jiménez, E.M., 1996. Programa AX. Área de riesgos hidrometeorológicos (AX program. Area of hydrometeorological risks, in Spanish). México: Centro 14, Centro Nacional de Prevención de Desastres.
- Jiménez, E.M., 2000. Diseño Integral de Vertedores (Integral design of spillways, in Spanish). Master‘s Thesis. División de Estudios de Posgrado, Facultad de Ingeniería, UNAM., México.
- Mediero, L., Jiménez, A., and Garrote, L., 2010. Design flood hydrographs from the relationship between flood peak and volume. International Workshop on Advances in Statistical Hydrology, May 23–25, Taormina, Italy. 1–10. Available from: http://www.risorseidriche.dica.unict.it/Sito_STAHY2010_web/pdf_papers/MedieroL_GarroteL_Jim%E9nezA.pdf [Accessed 23 January 2018]
- Michailidi, E.M. and Bacchi, B., 2017. Dealing with uncertainty in the probability of overtopping of a flood mitigation dam. Hydrology and Earth System Sciences, 21 (5), 2497–2507. doi:10.5194/hess-21-2497-2017
- Preciado, J.M., et al., 2010. Análisis entre escurrimientos y sedimentos históricos en la cuenca del río Apatlaco, mor (Analysis between historical runoff and sediments in the Apatlaco river basin, mor, in Spanish). Revista Aqua-Lac UNESCO-PHI. 2, 39–44. Available from: http://unesdoc.unesco.org/images/0021/002115/211564m.pdf
- Ramírez, A.I. and Aldama, A.A., 2000. Análisis de frecuencias conjunto para la estimación de avenidas de diseño (Joint frequency analysis for estimating design floods, in Spanish). Morelos, México: AMH, IMTA.
- Requena, A.I., Mediero, L., and Garrote, L., 2013. A bivariate return period based on copulas for hydrologic dam design: accounting for reservoir routing in risk estimation. Hydrology and Earth System Sciences, 17, 3023–3038. doi:10.5194/hess-17-3023-2013
- Salvadori, G., et al., 2007. Extremes in nature: an approach using copulas. Vol. 56. Berlin: Springer Science & Business Media.
- Salvadori, G., et al., 2016. A multivariate copula-based framework for dealing with hazard scenarios and failure probabilities. Water Resources Research, 52 (5), 3701–3721. doi:10.1002/2015WR017225
- Schumann, A., 2017. Flood safety versus remaining risks-options and limitations of probabilistic concepts in flood management. Water Resources Management, 31 (10), 3131–3145. doi:10.1007/s11269-017-1700-z
- Serinaldi, F., 2013. An uncertain journey around the tails of multivariate hydrological distributions. Water Resources Research, 49 (10), 6527–6547. doi:10.1002/wrcr.20531
- Serinaldi, F., 2015. Dismissing return periods! Stochastic Environmental Research and Risk Assessment, 29 (4), 1179–1189. doi:10.1007/s00477-014-0916-1
- Serinaldi, F. and Grimaldi, S., 2011. Synthetic design hydrographs based on distribution functions with finite support. Journal of Hydrologic Engineering, ASCE, 16 (5), 434–446. doi:10.1061/(ASCE)HE.1943-5584.0000339
- Sordo-Ward, A., et al., 2017. A parametric flood control method for dams with gate-controlled spillways. Water, 9 (4), 237. doi:10.3390/w9040237
- Sui, S., 2005. Estimation of design flood hydrograph for an ungauged watershed. Water Resources Management, 19, 813–830. doi:10.1007/s11269-005-6812-1
- Tomirotti, M. and Mignosa, P.A., 2017. Methodology to derive synthetic design hydrographs for river flood management. Journal of Hydrology, 555, 736–743. doi:10.1016/j.jhydrol.2017.10.036
- Vázquez, C.M.T., 1995. Procedimiento sistemático para el cálculo de la avenida de diseño en presas con gran capacidad de regulación (Systematic procedure for the calculation of the design flood in dams with great regulation capacity, In Spanish). Master‘s Thesis, DEPFI. UNAM.
- Volpi, E. and Fiori, A., 2012. Design event selection in bivariate hydrological frequency analysis. Hydrological Sciences Journal, 57 (8), 1506–1515. doi:10.1080/02626667.2012.726357
- Volpi, E. and Fiori, A., 2014. Hydraulic structures subject to bivariate hydrological loads: return period, design, and risk assessment. Water Resources Research, 50 (2), 885–897. doi:10.1002/2013WR014214
- Yin, J.B., et al., 2018. Uncertainty analysis of bivariate design flood estimation and its impacts on reservoir routing. Water Resources Management, 32 (5), 1795–1809. doi:10.1007/s11269-018-1904-x