
 ?Mathematical formulae have been encoded as MathML and are displayed in this HTML version using MathJax in order to improve their display. Uncheck the box to turn MathJax off. This feature requires Javascript. Click on a formula to zoom.
ABSTRACT
Floods are the natural hazards that are causing the most deaths worldwide. Flood early warning systems are one of the most cost-efficient methods to reduce death rates, triggering decisions about the evacuation of exposed population. Although previous studies have investigated the effect of human behaviours on evacuation processes, studies analysing a combination of behaviours, flood onset and warning timing are limited. Our objective is to explore how changes on the aforementioned factors can affect casualties. This is done within a modelling framework that includes an agent-based model, a hydraulic model, and a traffic model, which is implemented for the case study of Orvieto (Italy). The results show that the number of casualties is most impacted by people’s behaviour. Besides, we found that a delay of 30 min in releasing the warning can boost the number of casualties up to six times. These results may help managers to propose effective emergency plans.
Editor S. Archfield Associate editor D. Yu
1 Introduction
Over the past 20 years, flooding accounted for 47% of all weather-related disasters, affecting 2.3 billion and killing 157,000 people (CRED and UNDRR Citation2015). In the future, this number is expected to increase, because of global changes such as population growth in flood-prone areas, land-use changes, and extreme rainfall (Doocy et al. Citation2013). Traditionally, flood risk managers have relied on structural measures that are neither sustainable nor flexible in incorporating human and environmental needs. In the last two decades, a gradual paradigm shift has taken place, from structural-only measures to a more holistic and adaptive flood risk management approach (Abebe et al. Citation2019). This shift is changing the way to cope with floods (Thomas and Knüppe Citation2016). Besides, it was found that societies that keep high the flood-risk awareness stand out in their ability to mitigate flood risk and thus flood losses (Scolobig et al. Citation2017, Mard et al. Citation2018, Ridolfi et al. Citation2019). Among the non-structural measures, Flood Early Warning Systems (FEWS) have demonstrated to be cost-efficient in reducing injuries and deaths (Rogers and Tsirkunov Citation2010). FEWS can be used by emergency services to alert and evacuate urbanized areas within hours of anticipation, in case of an imminent flood event (Garcia and Fearnley Citation2012). Moreover, flood emergency plans involving FEWS are useful tools for reducing fatalities, mitigate damage, and facilitate a well-organised evacuation of people at risk to a safe place during a flood event.
Flood evacuation, however, is a very complex and dynamic process where humans interact with their environment leading to additional hazardous conditions (Bernardini et al. Citation2017). For this reason, it is crucial to understand how various human behaviours can affect evacuation mechanisms (Chen et al. Citation2006, Uno and Kashiyama Citation2008). To tackle this issue, numerical tools have emerged to simulate these interactions. Among them, agent-based models (ABMs) provide a framework to represent and understand the coherence and functionality of complex dynamic systems such as a flood evacuation process at different scales and extended times.
Different studies have been carried out to simulate human evacuation and test flood emergency plans using ABM (e.g. Bonabeau Citation2002, Ren et al. Citation2009, Mordvintsev et al. Citation2014, Mas et al. Citation2015, Ismaïl et al. Citation2018, Liu and Lim Citation2018, Zheng et al. Citation2019). In particular, Dawson et al. (Citation2011) developed an ABM for effective flood incident management and policy analysis. Liu et al. (Citation2010) combined a hydraulic model and a multi-agent evacuation model to provide a systematic framework for an adaptive evacuation strategy under life-threatening conditions and demonstrated the impact of facility arrangement on evacuation decision-making. Liu and Lim (Citation2016) proposed an ABM for assessing the optimal shelter location and routing strategy for evacuating households during the 2011 Brisbane flood event. Medina et al. (Citation2016) used ABM to test large-scale evacuation strategies in coastal areas during extreme hydro-meteorological events. Wang et al. (Citation2016) used ABM to investigate how the decision time and the choice of different modes of transportation may affect the mortality rate. Du et al. (Citation2017) developed a dynamic model to simulate the change in individual awareness when exposed to different information sources (e.g. social media) that influence flood evacuation decisions. Similarly, Hitomi et al. (Citation2019) developed an ABM to simulate evacuation responses assuming six different scenarios of evacuation time.
Human behaviour plays a crucial role during an evacuation as it includes a large variety of physical, cognitive, motivational, and social variables (Hofinger et al. Citation2014). For example, Wang et al. (Citation2016) found that in the case of evacuation due to fire alarm in a subway, the most frequent first reaction of those surveyed would be to go and inspect the event. Cheng and Zheng (Citation2018) studied the influence of cooperative behaviour in the evacuation efficiency, finding that a moderately cooperative behaviour led to a higher evacuation efficiency than a type of competitive society.
This work is a contribution to address one of the 23 Unsolved Problems in Hydrology (UPH) identified by the initiative of the International Association of Hydrological Sciences (IAHS, Blöschl et al. Citation2019), as it aims at investigating the interaction between society and flood-related management (Blöschl et al. Citation2019, UPH #21). Although previous research has provided understanding about various evacuation aspects, literature exploring the combined influence of different human behaviours and flood warning timing on the evacuation processes is needed, but at the moment it is limited.
We posed the following research questions, drawn from the methodological gaps in the current literature:
1. How does human behaviour affect flood evacuation processes and casualties?
2. Do time of the day in which the flood warning is issued lead to a different percentage of evacuated people?
3. How does the lead-time impact the number of casualties?
The objective of this paper is, therefore, to contribute to the understanding the effect of behavioural aspects of humans, time of flood occurrence and warning lead time on the potential casualties, using an integrated modelling framework to account for both physical and social aspects of flood evacuation processes.
We investigate different assumptions of human behaviour based on disaster psychology studies (Vorst Citation2010) and analyse the physics of the flood hazard through a two-dimensional hydrodynamic model. These elements are integrated into an ABM, in which the process of evacuation is modelled, using existing traffic models. The framework is tested on various scenarios of timing of flood occurrence and lead-times of the flood warning.
The paper is structured as follows: first, the case study of Orvieto, a population prone to floods in Italy, is described. Then, the methodology is presented, which consists of three parts: first, the description of the modelling approaches for each aspect of the problem, namely the hydrodynamic model, the traffic model, and their integration in the ABM. Second, the definition of the evacuation process, including the behavioural components, the triggers for evacuation, selection of destinations, and the status of the agents at the end of the simulations. Third, the definition of the proposed scenarios to study the effect of behaviour, starting time of the event and lead-time of the warning. Then, the results and discussion section follows, where the outcomes of each scenario are presented and analysed critically. Finally, conclusions and recommendations are provided.
2 Case study
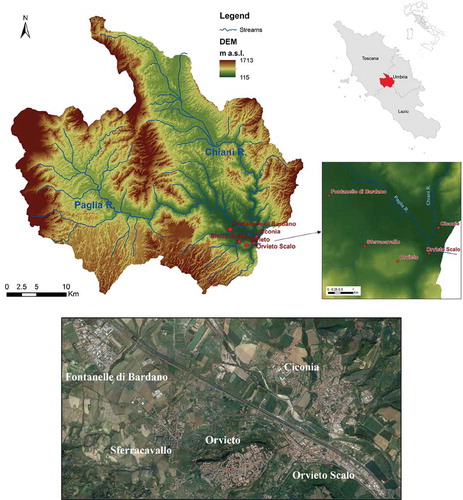
Paglia River is the main tributary of the Tiber River, the second-longest Italian River. It flows from North-West to South-East through three Italian regions, i.e. Tuscany, Latium, and Umbria, with a total length of 85 km. The river originates at Amiata Mount, at 1000 m a.s.l. and drains a catchment of 1350 km2, which has a mean elevation of 443 m a.s.l. In the upstream, the river flow has a torrential regime, with a discharge that varies between 0.3 m3s−1 in summer and 800 m3s−1 in winter, while in the proximity of the Orvieto town, its average discharge equals 11.3 m3s−1. Paglia River receives water from several tributaries, being the most important one the Chiana River, which flows into the Paglia River upstream Orvieto with a length of 40 km and a catchment size of 420 km2 (see ). The Paglia River floodplain is vulnerable to flooding. The river crosses some important national infrastructures, including the highway that connects Naples to Milan, and the high-speed railway line that connects Rome to Florence. Moreover, the valley is highly urbanised, having the towns of Orvieto, Orvieto Scalo, and Ciconia, and also a large industrial area in the river proximity.
Figure 1. Paglia River and the catchment location in Italy (top) and detail of the study area (bottom)
In November 2012, the basin experienced severe storms, with rainfall exceeding a return period of 200 years in most locations, generating extreme water levels that exceeded the level of the river banks. For the first few hours, the floodwaters exhibited high velocity; after that, several flooded areas experienced water stagnation for several days. Orvieto Scalo was among the most affected municipalities, with a total monetary value of damages estimated in the order of EUR 115 million (i.e. 0.6 percentage points of the regional GDP; Menoni et al. Citation2016).
In this flood event, the Civil Protection members undertook flood response actions. For example, during the flood, people were prevented from reaching their workplaces early in the morning by closing the bridge connecting the residential part of the town and the industrial zone, when the risk was already high (Molinari et al. Citation2014).
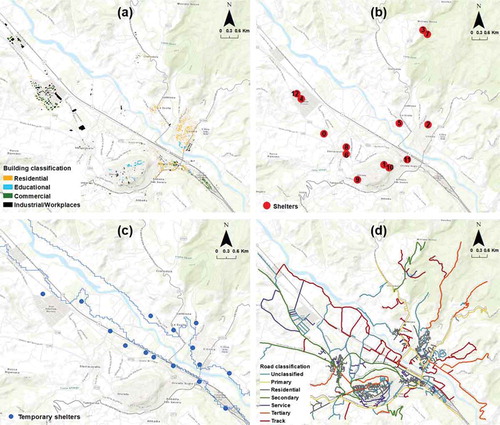
In response to such extreme event, a levee system was designed, built, and inaugurated in May 2017 to protect the settlements of Orvieto Scalo, Ciconia, and the surrounding industrial areas. The levee system was designed to withstand a 200-year flood event. Moreover, the Civil Protection of the Umbria Region built 12 shelters, most of which are distributed in the south-west of the study area (see )). These shelters are nowadays critical facilities, being the main destination of each evacuee during a flood evacuation.
Figure 2. Spatial distribution of the buildings (a), shelters represented with red circles (b), temporary shelters (blue dots) with the maximum flood extent for the 500-year return period event represented as blue line (c), and roads with their classification (d)
3 Methodology
This study aims to analyse the population dynamics and exposure during flood evacuation. The methodology is presented in three parts: firstly, the description of the modelling approaches, namely the hydrodynamic model, the traffic model, and their integration in the ABM; secondly, the definition of the evacuation process, including the behavioural components, the triggers for evacuation, selection of destinations and the status of the agents at the end of the simulations; and finally, the definition of the proposed scenarios to study the effect of behaviour, starting time of the event and lead-time of the warning.
In terms of modelling, this study proposes an innovative framework in which physical and social models are integrated to simulate the interactions among individuals (called agents in ABM), their environment and the hazard through behavioural rules. On the one hand, the physical models considered are the flood model describing the dynamic evolution of a flood event and the traffic model describing the dynamic evolution of the traffic under different levels of congestion. On the other hand, the social model consists of sets of rules implemented in an ABM to simulate the movement of individuals, taking into account the daily activities that people are likely to perform, as well as, their possible behaviour during evacuation according to the disaster psychology theories. In the following subsections, a detailed description of each model is provided.
3.1 Hydrodynamic model
A two-dimensional (2D) hydrodynamic model built-in the Hydrologic Engineering Centre’s River Analysis System (HEC-RAS) software was used to represent the flood wave propagation. The hydraulic model covers 63,811 m2 of floodplain area and approximately 24.4 km of river reach. The digital elevation model (DEM) used in the 2D model has a spatial resolution of 1 m. To avoid prohibitively high computational costs, a 2D mesh with a higher cell size of 10 m and about 367,000 cells was generated. The DEM includes the new embankments that protect Orvieto Scalo and Ciconia from floods of 200-year return period. No embankment breaching was considered in this study, so we assume that flooding could occur only due to overtopping of the levee.
Other main inputs to the 2D model are the upstream and internal boundary conditions expressed as flow hydrographs from river tributaries. The boundary conditions correspond to a 500-year return period flood with a duration of 13 h and 20 min. This duration is critical to simulate flooding in case of embankment overtopping (Mazzoleni et al. Citation2017). The hydrographs of 22 tributaries flowing into the floodplain are considered as boundary conditions in the model. These hydrographs were estimated using a continuous rainfall-runoff model from Brocca et al. (Citation2008, Citation2009) that used a precipitation field generated by coupling the Neyman-Scott Rectangular Pulse model (Cowpertwait et al. Citation1996) with a rank correlation (Iman and Conover Citation1982) to account for the spatial variability of rainfall (Tarpanelli et al. Citation2012). Camici et al. (Citation2011) provide an extensive explanation of the methodology. The downstream boundary condition is assumed to be the normal depth.
Finally, the spatial distribution of Manning’s coefficient was derived from the last CORINE Land Cover dataset (Citation2018), resulting in a range of Manning’s roughness values between 0.04 and 0.06.
As we are aiming to couple the 2D hydraulic model with an ABM for flood evacuation purposes, it is crucial to provide the spatial representation of the flood at different time steps (Michaelis et al. Citation2020). For this purpose, 80 floodwater depths maps with a mapping output interval of 10 min and a 50 m spatial resolution were extracted from the results of the hydrodynamic model and prepared to be used in the ABM.
3.2 Traffic model and route selection
The evacuation process is highly dependent on traffic condition and road capacity (Zhu et al. Citation2018). Therefore, representing the road network within the ABM framework is crucial to determine the total evacuation time, the optimal exit routes, and critical points of congestion. There are three types of approaches for a traffic model based on the scale and level of detail: continuous approach or macro-scale models (suitable for entire metropolitan regions), discrete approach or meso-scale (used for individual roads), and micro-scale models (suitable for individual lanes of road segments) (Hardy and Wunderlich Citation2007). Moreover, hybrid approaches combining both meso-scopic and micro-scopic models are emerging.
In this study, a meso-scopic traffic model based on Banos et al. (Citation2017) is used to ensure simplicity and faster analysis. In this model, the velocity of each vehicle is calculated as:
where is the free-flow speed in a road with no traffic,
is the current concentration of the road, and
is the maximum capacity of the road. This model has three main limitations: (a) it is unsuitable for concentrations that exceed the road capacity; (b) it is largely deterministic with limitation on sources of randomness; and (c) it does not consider the position of other vehicles and thereby resulting in unrealistic situations. To overcome these limitations, the speed of a given vehicle is calculated considering only the traffic between that vehicle and the node of the road ahead. The road is defined as the part of the network between two nodes. In this way,
and
are calculated only for the road segment between the vehicle and the node, and not for the entire road. The concept of randomness is introduced by penalising the speed of the vehicle by a random factor proportional to its speed.
Once the traffic model is implemented, it is important to identify the possible routes that agents may follow to move from their original location to their destinations. In this study, the shortest route is assessed with the Dijkstra’s algorithm (Dijkstra Citation1959), in which a weight is assigned to each road based on the ratio between the road length and the average velocity of the agents on that road. Such weight can represent the cost of travelling between the initial location of an agent and its target. From all the possible routes, the optimal route is the one in which the sum of the road weights has the lowest value.
3.3 Agent-based model
The software GIS Agent-Based Modelling Architecture (GAMA, Taillandier et al. Citation2018) was used to build our ABM because of its capabilities for handling complex environments and its comprehensive Java-based domain-specific language: GAML. The GAMA framework is based on the concepts of classes and objects, their methods, attributes, and relations. For example, a class is referred to as a species in GAMA, which is a container of the same kind of agents. Each species may represent people, houses, roads or institutions, among others. The agents have their attributes (i.e. name, social class, etc.) and perform their methods (actions such as working, driving, etc.). Some of these actions may be triggered by the interactions among species (e.g. deliver a message, visit a neighbour, etc.), which can be defined using behavioural rules. A detailed description of the environment, the definition of the agents and evacuation processes are reported in the following sections.
3.3.1 ABM structure
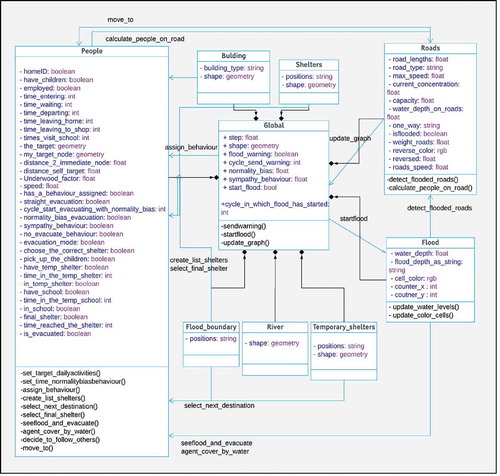
The ABM structure is presented through the Unified Modelling Language (UML) class diagram as presented in . It offers a synthesized view of the classes (species) in the ABM and the relationships among them. The species are represented by boxes with their name, attributes, and behaviours. The symbol before the attribute name indicates its visibility. For all the species, each of the attributes has a minus sign (–) indicating that such attributes are only accessible by the species to which they belong. The plus symbol (+) indicates that the attributes are accessible to all the species and belong to the “global” species. The black arrow pointing to a filled diamond represents a composition relationship between the global species and all the remaining species. This relation means that the rest of the species cannot exist without the global species. The main type of relation between the species is an association, and this is represented by a blue arrow. The name along the arrow indicates the method (behaviour) of one species in which the other species takes part. The population (species “people”) operate a total of 10 operations, followed by the environment (species “global”) that performs three operations, and finally, road network (species “roads”) and flood (species “flood”) that execute two operations each. In this ABM, there is only one dynamic species “people” that executes its behaviour and interacts with other agents of the same species and the other species. Agents from species “roads” and “flood” are static and interact between them. The other remaining species, such as “buildings”, “shelters”, “river”, “temporary shelters”, and “flood boundary”, do not perform any method.
Figure 3. Unified Modeling Language (UML) class diagram of the ABM
3.3.2 Environment
The environment defines the spatial elements of the city such as buildings, shelters, waterways and road networks and represents the spatial limits of the ABM. These spatial data were extracted from OpenStreetMap (OSM). The municipalities of Ciconia, Sferracavallo, Orvieto Scalo, Orvieto and Fontanelle di Bardano are part of the environment, covering an area of approximately 63 km2 (see ). The buildings were classified according to their use, such as residential, commercial, educational, and industrial or workplaces (see )). The residential buildings are located only in Ciconia and Orvieto Scalo, while the rest of the buildings are distributed among all municipalities.
A special type of buildings, relevant for this study, are the shelters. The people are expected to reach them during an evacuation. Also, a few temporary shelters were created in the model assuming that the Civil Protection Department of Umbria would mobilise their volunteers to these temporary shelters to divert people away from the flooded area (see )). The temporary shelters were located just outside of the maximum flood extent for a 500-year return period flood and may act as a command centre for communication between the Civil Protection and the evacuating population.
To describe a realistic movement of the agents on the road network, other basic information such as the number of lanes and their directionality is required. Although information about traffic signals, pedestrian crossings and stops, among others, can also affect the travel time of vehicles, we assume that this information is not relevant during a flood evacuation. The implementation of bidirectional roads was carried out by creating parallel roads from the original OSM source (Bhamidipati et al. Citation2016). In this way, an independent road for each direction was generated, ensuring that the interaction between agents was limited to the agents on the same road. Roads were considered flooded when floodwater depth on the roads was higher than 40 cm. Overlay analysis of the maximum flood extent from the hydraulic modelling indicated that a total of 330 roads were flooded. In the ABM, a penalty was assigned to these roads to prevent the agents to select them as a path to their destination. presents the roads of the network, classified by type and speed limits.
Table 1. Classification of the roads by type and speed limit
The flood maps generated with the hydrodynamic model are the inputs to the ABM to evaluate the effect of a flood on the traffic and the behaviour of the agents. The hydraulic model provides a 50 m x 50 m resolution raster of the flood extent with a time step of 10 min for the entire duration of the flood event, i.e. about 13 h. To optimize the simulation time, the flood extent map was converted to a vector (shapefile) format and translated into a grid that was periodically updated within the ABM.
To facilitate the understanding of the model, the ABM environment was divided into three areas: 1) the area of maximum flood extent (see )) where the flood takes place, and each of the sides out of the Paglia River floodplain (east/left side and west/right side), in which no flooding occurs. This division allows the agents to move to a shelter on the same side of the river where they are located instead of taking a dangerous decision and trying to cross the river during the flood event.
3.3.3 Definition of agents
A total of 1000 agents are considered in the ABM, out of which 668 reside in Ciconia and the remaining 332 in Orvieto Scalo. These agents are grouped by considering two socio-economic characteristics that influence the reasons they move around the city. The sample population is based on the 2018 census and it is summarized in . Although the information about the place where each inhabitant lives is not available, one of the residential buildings of Orvieto Scalo and Ciconia is randomly assigned to each individual as home location.
Table 2. Number of agents used in the ABM, as a representative population for the case study
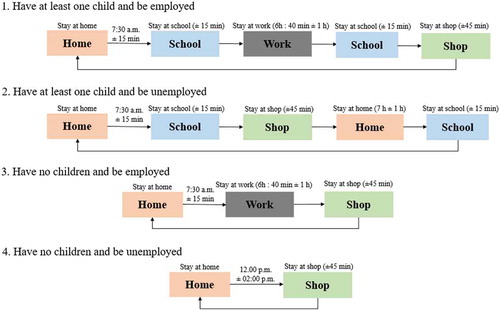
Different approaches are available to differentiate and represent the behaviour of an agent (Leach Citation1994, Vorst Citation2010, Hofinger et al. Citation2014). We adopted the approach suggested by Vorst (Citation2010), who differentiates the agents by “objective” socio-demographic characteristics such as age, sex, employment, household size, etc., information that is essential to define their daily activities. This is important as a flood event occurring during the daytime may affect differently the population than if it occurs overnight. In this study, the daily activities are defined by the boolean attributes “have children” and “employed”. Therefore, we have four types of daily activities based on the four possible combinations of these two attributes. Due to the insufficient information available about the daily routines of the population, synthetic daily routines are generated (see ). These activities are incorporated in the ABM, together with the information related to the starting time of the first activity, the time spent doing each activity and the time of departure from the building to the next activity. All the simulations start at 07:00 h and all the synthetic daily activities are assumed to start at 07:30 h ± 15 min. explains the rationale behind the synthetic daily routines.
Figure 4. Synthetic daily activities of the agents according to their socio-economic characteristics
Although information such as travel patterns, distribution of transport means per activity and number of trips by transportation type could be found in a few sources (e.g. Analysis of National Travel Statistics in Europe by the European Joint Research Centre, Ahern et al. Citation2013), we deliberately did not use this information, as the proportion of displacements by car are more significant than by other means.
3.4 Evacuation process
In this section, the behaviours expected during a flood evacuation are defined. For each behaviour, different aspects such as the reasons that can trigger people to start evacuating, the starting time of the evacuation, the selection of the final destination, and the status of the agent at the end of the simulation are described (see also ).
Table 3. Summary of the evacuation process. FW: flood warning, FO: flood occurrence
3.4.1 Types of Evacuation behaviours
Four different types of “reactions” in the presence of a flood warning that announces an imminent evacuation are considered (). Each agent of the species “people” has one of the four “reactions” ensuring that every agent plays a role in the evacuation. This typology of reactions is informed by common behaviours observed during the warning phase of an evacuation (Leach Citation1994, Vorst Citation2010, Hofinger et al. Citation2014). The main reason for considering these theoretical behaviours is the lack of field data. The Civil Protection Department of Umbria has no available information about the flood risk perception of Orvieto’s population, nor of the population’s reaction during the flood of November 2012. In any case, it is important to mention that the construction of the embankments in 2012 may have generated a sense of false protection in the population, with a consequent change in flood risk perception, which would make the use of this data more uncertain. The four types of behaviours are explained as follows:
Straightforward behaviour refers to the behaviour of an individual who evacuates immediately after the warning is issued. It can also be called “instant or imminent evacuation”.
Normality bias behaviour is characterised by an apathetic behaviour, with lack of initiative and with a denial of the threat, but without being overactive. Agents from this group evacuate at some time after the warning is issued.
Sympathy behaviour refers to the people who lack initiative and decide to follow or imitate the behaviour of other agents.
Indifferent refers to people that do not evacuate when they receive the warning and therefore, they continue doing their current activity.
At the start of each simulation, four lists of agents are randomly initialised, having each agent one type of behaviour in the same simulation. The randomness guarantees that these lists do not always contain the same people across simulations. GAMA allows the possibility to simulate with the same value for the random parameters (e.g. by setting the seed). Therefore, if the same population needs to be tested under different scenarios, the same seed can be used.
Vorst (Citation2010) indicated that during the impact phase of a disaster, on average 10% of the population is dynamic with potential leadership, 75% are apathetic with lack of initiative and 15% are overactive, performing non-effective behaviour. Hofinger et al. (Citation2014) mentioned similar percentages. Based on these studies, the standard base-scenario of the ABM assumes that 10% of the population have straightforward behaviour to represent the 10% with potential leadership of Vorst (Citation2010); 60% have normality bias behaviour and 15% have sympathy behaviour, both to account for the 75% apathetic with lack of initiative; and, finally, 15% is indifferent to represent the non-effective behaviour.
We would like to emphasise that the list of behaviours considered in this study is not exhaustive and other types of behaviour may be identified and simulated. For example, a fifth group may represent “leaders”, i.e. individuals that guide other agents. Also, another type of behaviour may be “panic” which represent people who are out of emotional control.
3.4.2 Triggers for evacuation
We consider three triggers that make people start the evacuation, namely the reception of a flood warning, the visual proximity to a flooded area, and observing others evacuating. The first trigger is when the flood warning is issued and each agent assumes one type of behaviour. The decision to evacuate or not, therefore, depends on this behaviour. In this study, it is assumed that all the agents receive the flood warning simultaneously. The second trigger occurs when the agent is at a distance of 100 m or less from the flood boundaries, once the flood starts. In this case, the agent always evacuates, independently of its assigned behaviour. The third trigger represents persons that start following others when they are evacuating, which is only applicable for agents with sympathy behaviour.
3.4.3 Starting time of evacuation
ABM is useful to analyse the impact of the time in which the agents start to evacuate. Starting times can be simulated by probability distributions such as Rayleigh distribution, which represents the general evacuation curve: a low percentage of the population evacuates at the beginning, and as the evacuation progresses, the percentage increases (Solís and Gazmuri Citation2017).
However, in this study, the starting time of evacuation is linked to the type of behaviour of each agent. For agents with straightforward behaviour, the evacuation starts immediately after the flood warning is disseminated. Agents with normality bias behaviour are divided into two groups: agents located outside the floodplain area, who evacuate randomly within the first 45 min after the flood warning is issued, and agents located inside of the floodplain area who evacuate within the first 20 min after the flood warning. Agents with sympathy behaviour are assigned a probability of 50% to decide to follow another agent who is already evacuating, when more than one agent is evacuating ahead, the agent evacuates. The agent looks only for agents ahead up to a distance of 200 m on their path. Therefore, agents with sympathy behaviour do not have a fixed starting time of evacuation. Finally, the agents with indifferent behaviour only evacuate when seeing the flooding at a distance of 100 m; therefore, their starting time of evacuation is unknown at the beginning of the simulation.
3.4.4 Selection of the destination
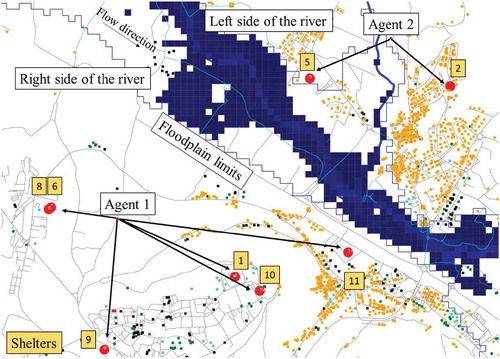
When a flood event happens, the decision of the agent about starting the evacuation and selecting a destination depends on its type of behaviour and initial location. Agents with straightforward behaviour start to evacuate towards a shelter, immediately after receiving the warning. Every agent with this behaviour is assigned a probability of 80% to choose the closest shelter to its current location. It is assumed that the agent is familiar with the area and knows with a high level of confidence where the closest shelter is. Following the same logic, agents only look for shelters on the side of the river where they are currently located when evacuation starts, moving away from the flooded area. For example, Agent 1 in , can decide only to go to a shelter on the right side of the river. If this agent decides to choose the closest shelter, it would select either shelter 6 or 8; if not, it selects another shelter among the ones remaining on the right side. On the other hand, Agent 2 can only select a shelter among those located on the left side of the river, and if it decides to select the closest shelter, then it selects either shelter 2 or 5; if not, it selects one of those remaining on the left side (shelter numbers 3 and 7, not shown).
Figure 5. Selection of shelter by an agent depending of its location. The big red dots are the shelters
Agents with normality bias behaviour delay their evacuation as previously explained. Once they decide to evacuate, part of the population with children pick them up from the school or from the closest location to the school, with a probability of 50%, before leaving together to the shelter. This is supported by the fact that looking for relatives before evacuating themselves is considered altruistic behaviour besides being a common behaviour in an evacuation (Toledo et al. Citation2018). Auld et al. (Citation2012) confirm that adults with one or more children are more likely to make a prior stop compared to those who have no children. The agents only take this decision if the flood warning is issued when the children are at school, and it is assumed that the agent spends 15 min there before leaving together to the shelter. The rest of the population who decides not to pick up their children – because perhaps the school has taken action or because another relative does it, go ahead to a shelter. The selection of the shelter is equal to the one explained for straightforward behaviour. It is assumed that after the flood warning is issued, the Civil Protection acts on the ground, by delimiting the areas to which the population can drive, preventing them from crossing to the other side of the river. This is supported by League (Citation2009) whose study shows that the presence of emergency officials in hazardous areas during a flood may deter people from crossing flooded roads. It is presumed that the agents looking for their children may go to the closest point to the river (temporary shelter), and when realising that crossing the river is not feasible, they will decide to go to a shelter.
Agents with sympathy behaviour continue with their normal activities until they decide to follow the agent evacuating close to them to the same shelter to which this agent is heading. Finally, agents with indifferent behaviour continue with their daily activities and do not change their current destination until they see the flooding (second trigger of evacuation). If an agent decides to evacuate, it selects the closest shelter. In this way, coherently, any agent outside the floodplain area may not cross the river trying to reach either its workplace or its home on the other side of the river.
Agents located in the floodplain area should ensure to get out of the floodplain area. The first step is to go to the closest temporary shelter, where they will spend 15 min before deciding to move forward to the shelter.
3.4.5 Status of the agent at the end of the simulation
An agent could have only one of the following three statuses at the end of the simulation: evacuated, not evacuated or drowned. An agent is considered to be evacuated if it successfully reaches the shelter. An agent is considered with status “not evacuated” if it accomplishes its daily activities without complying with the flood warning. “Not evacuated” indicates agents who decide not to evacuate after receiving the flood warning and who is not affected by the flooding, being capable of finalizing their daily activities without being interrupted by the flood. Finally, an agent is considered to be drowned if it is covered by 1.5 m of water at any time within the simulation. This situation could happen when the flood is faster than the agent trying to reach a safe area.
3.5 Scenarios
To address the research objective of this study, scenarios are proposed to account for different human behaviours during the flood, timing of the flood warning, and flood onset. The scenarios include three variables, namely, (1) percentages of the population with the aforementioned behaviours, (2) the time of the day when the flood occurs, and (3) the lead time of issuing the warning before a flood starts. To evaluate which of these variables affect the evacuation process the most, we developed three scenarios (see ), and several simulations were run to account for the randomness. The following parameters incorporate randomness into the model:
The initial position of the agents
The probability to pick up the children from the school. It is 50% for each agent with normality bias behaviour. There is not enough literature on the topic to select an empirical percentage, thus, we hypothesized a percentage value. Nevertheless, Auld et al. (Citation2012) concluded in their statistical analysis of intermediate stops during evacuation that more than 50% of the intermediate stops made by adults were for picking up family members.
The probability to choose the correct shelter. It is 80% for each agent. This high percentage assume that the inhabitants are familiar with the environment where they live, thus, they know with high probability where the shelter is.
The probability to follow another agent ahead. It is only applicable for agents with sympathy behaviour, and it is 50% for the first agent and 100% when more than one agent is evacuating ahead. We conjectured these probabilities, but a high value ensures that agents can decide to evacuate despite the roads are not crowded with other evacuating agents as the sample size is 1000.
Table 4. Summary of the experimental setup
The detailed demographics and empirical data required to calculate the above-mentioned probabilities was not available. We carefully assumed them, seeking to be as realistic as possible. Further research should investigate the effect of these assumptions.
In all the model runs, the socio-demographic characteristics of the agents were maintained (e.g. employment proportion of people with children), as well as, home location. Nevertheless, the selection of the building to perform the daily activities by the same agent differs between simulations. Effect of the randomness was low due to the small size of model domain about 11 km from east to west and 7 km from north to south with a high concentration of buildings in the narrow old town of the municipalities.
The base scenario considers an event with an onset at 9:00 a.m., for which a flood warning is released 1 h before, and a population with the following proportions of behaviour profiles: 60% normality bias behaviour, 10% straightforward behaviour, 15% sympathy behaviour, and the remainder 15% indifferent behaviour (see sub-scenario 1.1, )
It is worth noting that in Scenario 2 the percentages of the population with straightforward, normality bias and sympathy behaviours were analysed, while changes in the percentages of the population with indifferent behaviour were not studied.
4 Results and discussion
4.1 Scenario 1: changing the time of flood occurrence
This scenario aims to assess the effect of the time of flood occurrence (flood onset). As in the base scenario, the flood warning is issued 1 h in advance from the flood onset. Three sub-scenarios in which the flood occurs are introduced, namely in the morning (sub-scenario 1.1), in the evening (sub-scenario 1.2), and at night (sub-scenario 1.3). The results for each scenario are presented as the cumulative number of people evacuating over time from the moment the flood warning is issued until the time where the evacuation is almost complete (95% of the population evacuated). The large number of people evacuated (95% or more) is because the warning reached all the population, an assumption that seems logical for a small municipality.
shows the cumulative number of people evacuating at a given time for the simulations run for the three sub-scenarios of Scenario 1. The highest number of evacuating agents is observed to happen in two particular periods: as soon as the flood warning is issued (minute 0), and at flood onset (minute 60). Moreover, it can be observed that a few people evacuated within 2 min after the flood warning, due to the short distances (about 300 m) between those agents and the shelters.
Figure 6. Cumulative number of people evacuated over the total population (1000) versus time after the issue of the warning for the three sub-scenarios of scenario 1 (behaviours considered: normality bias 60%, straightforward 10%, sympathy 15% and indifferent 15%). The Flood Warning (FW) is issued at 8 a.m., 5 p.m. and 10 p.m. for the three sub-scenarios, i.e. 1.1 left, 1.2 middle and 1.3 right panels, respectively. The Flood Onset (FO) is one hour after the warning is issued for all three sub-scenarios
In , the first period coincides with the people evacuating straightforwardly, and the second period with the people who decided not evacuate with the flood warning, but who perceived the flood at a distance of 100 m. In the three sub-scenarios, the increments on the number of people evacuating at the flood warning and the flood onset are comparable, therefore, the people with straightforward behaviour does not seem to have had a significant impact on reducing the exposure.
In sub-scenario 1.1 (flood occurring in the morning), as average, three agents drowned and the maximum number of agents in all simulations that move into the shelter after 1:07 h is close to 950. Approximately 7% of the people evacuated just in each of the peaks at the flood warning and flood onset.
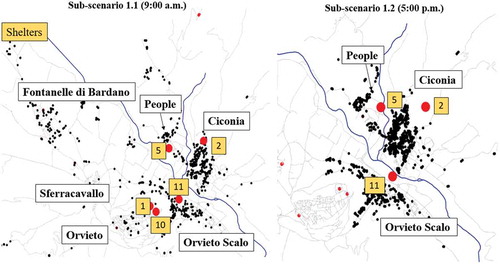
For the sub-scenario 1.2 (flood occurring in the evening), the daily activities of most of the agents had already finished. Although two steep increments of people evacuating after the flood warning and after the flood onset can also be observed, some differences can be noticed. As the flood occurs in the evening, the agents are already at home and it takes less time to them for reaching a shelter (see ). This leads to the result that the first increment of people evacuating after the flood warning in sub-scenario 1.2 is higher than in sub-scenario 1.1, 18% at 8:05 a.m. for sub-scenario 1.1 and 25% at 5:05 p.m. for sub-scenario 1.2. Moreover, this situation could create congestion on some roads between 5:00 p.m. and 6:00 p.m., as people are most concentrated at these rush hours. Nevertheless, the time of evacuating is shorter for more people evacuated in the evening than in the morning, and therefore, fewer people are exposed to the flood. This means that a greater number of casualties could happen if the flood happens at 9:00 a.m. rather than at 6:00 p.m. Overall, it seems easier to complete an evacuation at 6:00 p.m. than at 9:00 a.m. with a lower number of casualties.
Figure 7. Spatial distribution of agents at 9:00 a.m. (left, sub-scenario 1.1) and at 5:00 p.m. (right, sub-scenario 1.2). The small black dots are the agents, and the big red dots are the shelters
Finally, in sub-scenario 1.3 (flood onset at 11 p.m. and warning at 10 p.m.) the evacuation of the entire population finished 1:05 h after the flood warning. The results are very similar to sub-scenario 1.2 due to the location of the agents at their homes and not spatially distributed as for sub-scenario 1.1. In fact, at 11:00 p.m. the population is at home, probably sleeping, and therefore only the homes close to the flood boundaries are affected. However, in reality, it is expected that people at night react slower than in the evening and also have lower visibility. For example, Menoni et al. (Citation2016), referring to the flood in November 2012, stated that: “In the case of Orvieto, the first alert issued ‘not officially’ on Saturday night was left almost ignored until the level of the water started to rise early on Monday morning”. The casualties associated with sub-scenario 1.3 are caused either by the people trying to reach the shelter at the left side of the river or because their home was very close to the floodplain area.
4.2 Scenario 2: changing the proportion of different evacuation behaviours
In this scenario, different proportions of the population characterized by diverse evacuation behaviours are considered. The three proposed sub-scenarios have a change in the proportion of people with normality bias, straightforward and sympathy behaviours. The flood characteristics are taken from the base scenario, with flood onset at 9:00 a.m. and flood warning issued at 8:00 a.m.
For sub-scenario 2.1, where there is 30% of the population with normality bias behaviour and 40% with straightforward behaviour, the continuous movement of people evacuating finishes after 1:05 h from the flood warning issued. After that time, an average of 50 people evacuated over all the simulations for this sub-scenario. The cumulative number of evacuees at each simulation time step is reported in . As it can be seen, the percentage that evacuated straightforwardly after the warning was issued generated the first sharp increase, while a small percentage of people evacuated after the flood onset (60 min later) as shown in the previous scenario. The first increment after the flood warning is four times higher than the one of scenario 1.1 (). Indeed, less than 5 min after the flood warning, nearly the 30% of the population was already safe, against the 7% considered in sub-scenario 1.1 (sub-scenario 1.1 has the same flood warning timing and flood onset of sub-scenarios 2.1, 2.2, and 2.3).
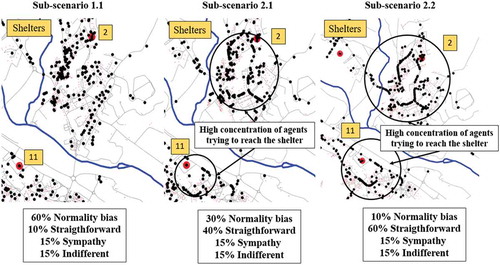
Figure 8. Cumulative number of people evacuated over the total population (1000) versus time after the issue of the warning for the three different sub-scenarios of scenario 2. The flood warning is at 8:00 a.m., the flood is onset at 9:00 a.m. For sub-scenario 2.1, behaviours consist of normality bias (NB) 30%, straightforward (SE) 40%, sympathy (SB) 15% and indifferent (I) 15% (left panel). For sub-scenario 2.2, behaviours consist of NB 10%, SE 60%, SB 15% and I 15% (middle panel). For sub-scenario 2.3, behaviours consist of NB 15%, SE 10%, SB 60% and I 15% (right panel)
The slightly pronounced increment at 16 min corresponds to people with straightforward behaviour reaching safe areas, who were at far distances from the shelter. The total number of people evacuated is similar to sub-scenario 1.1 (approx. 991 agents) as well as the average time to complete the evacuation (approx. 8 h) due to the people’s daily activities. The greatest difference is appreciated in the first sharp increase, and the reason is the difference in the number of people reaching the shelter after the flood warning for both sub-scenarios.
For sub-scenario 2.2, the percentages of population with normality bias behaviour is 10%, and with straightforward behaviour is 60%. The flood evacuation occurs 1:05 h after the flood warning, and in the remaining time until complete the evacuation, i.e. 4:25 p.m., only 46 are evacuated on average. The presented trend is the same as in sub-scenario 2.1, except that about 15% more agents evacuated in sub-scenario 2.2 after the flood warning. Interestingly, the increase of people with straightforward behaviour and the reduction of those with normality bias did not affect the time when the evacuation was completed, nor the evacuated number of people (approximately 8 h and 991 agents, respectively). This is because, as explained above, people that evacuate on their way home from work have a higher impact in this regard. compares the movement of people after the flood warning between sub-scenario 1.1, 2.1, and 2.2.
Figure 9. People trying to reach the shelters at 8:02 a.m. when the percentage of the population with straightforward behaviour is 10% (left), 40% (centre), and 60% (right). The small black dots are the agents, and the big red dots are the shelters
In sub-scenario 2.3, the percentages of population with normality bias behaviour and sympathy behaviour in the base scenario were swapped to maintain the percentages proposed by Vorst (Citation2010). Now, 60% of the population has sympathy behaviour and 15% normality bias behaviour. Meanwhile, the percentages of straightforward and indifferent behaviours were equal to 10% and 15%, respectively. The first peak of people evacuating is similar to the one in sub-scenario 2.1, approximately 30%, but lower than for sub-scenario 2.2 (45%). We found that the increase of people with sympathy behaviour does not have an impact on the number of people evacuating after the flood warning, which remains similar to sub-scenario 2.1. The reason is that the agents tend to follow the ones evacuating ahead with a high probability. Differences are observed when straightforward behaviour increase from 40% (sub-scenario 2.1) to 60% (sub-scenario 2.2). Sympathy behaviour flattens the evacuation curve increasing the population exposure when looking at the number of people evacuating in total, now 6% lower. This is due to two facts: fewer people perform normality bias behaviour and fewer people perceived the flood because their location are far from the flooded area. A higher exposure increases the number of casualties on average to 7, higher than the 2 of sub-scenario 2.1 and 1 of sub-scenario 2.2. It is worth mentioning that in the worst case, the number of casualties showed an increment up to 15. Sympathy behaviour leads to a higher unpredictability in the outcomes than the straightforward behaviour as the agents with this behaviour are not aware of the evacuation time as they depend on others. This is observed in the higher variability of the evacuation curves for different simulations of sub-scenario 2.3 comparing with the other two sub-scenarios 2.1 and 2.2 (). One possible explanation in real-life situations is discussed in Becker et al. (Citation2015). In their review of people’s voluntary behaviours in and around floodwater, Becker et al. (Citation2015) found that one of the causes for people to enter floodwater is to follow others when driving, people experience a social influence to follow others if they had seen cars in front of them crossing the floodwater successfully. This is a negative social influence that reduces their flood risk aversion and makes them underestimate the danger. As a result, the number of casualties increases in comparison to other behaviours (straightforward, normality bias) as demonstrated in these results.
4.3 Scenario 3: changing the lead-time of the flood warning
In Scenario 3, different lead-time values are assumed, while fixing the flood onset at 09:00 h. In particular, sub-scenario 3.1 considers a warning issued 1.5 h before the flood onset, while for sub-scenario 3.2 is 30 min. With this experiment, we wanted to represent the conservative case in which a short lead-time value is available to warn a small municipality of an approaching flood event so that the population can reach safe areas in only a few minutes.
Results for sub-scenario 3.1 show a similar proportion of people reaching the shelters in the first minutes after the warning, as in sub-scenarios 1.2 and 1.3 (see ). Most of the population are at home at the time of the event, and the mean distance to the shelters is lower. The total number of people who evacuated at the end of simulation remained similar to sub-scenario 1.1 as well as the time. However, a reduction in the number of casualties is obtained in this sub-scenario, as a higher lead-time can lead the population to find protection in the opposite side of the river. Therefore, an extra 30 min of warning time in floods occurring in the morning, when people are starting their activities, reduce the average number of casualties from 3 to 0. The additional lead-time does not affect the proportion of people who decide not to evacuate until they see the flood (minute 90).
Figure 10. Cumulative number of people evacuated over the total population (1000) at a given time for the different sub-scenarios of scenario 3 (behaviours considered: normality bias 60%, straightforward 10%, sympathy 15% and indifferent 15%). The flood warning is issued at 7:30 a.m. and 8:30 a.m. for the sub-scenarios 3.1 (left panel) and 3.2 (right panel), respectively. The flood onset is at 9 a.m. for both sub-scenarios
Results of sub-scenario 3.2 (see ) show that the majority of the population evacuate when the flood occurs (minute 30), and not when the warning is issued (minute 0). This is due to the short lead-time between flood warning and onset (30 min). In fact, at the moment of the warning, only people with straightforward behaviour (10%) evacuated. The large number of people evacuating at the flood onset is due to the combination of the evacuation of people with normality bias behaviour and people who evacuated because they observed the flood. For this reason, more people are exposed to the flood and therefore are at risk of death.
A summary of number of evacuees and number of casualties for all sub-scenarios is presented in .
Table 5. Summary of the mean number of evacuees for all sub-scenarios after 5 min of the flood warning (FW) and flood onset (FO) and mean number of casualties (population: 1000)
5 Conclusions
This study analysed the flood evacuation mechanisms at a local scale using an integrated modelling framework of coupled physical and social models consisting of a 2D hydraulic model, a traffic model, and an ABM. In particular, it studies the effect of human behaviours, time of flood occurrence and warning lead time on the potential casualties. Four different types of human behaviours that are likely to be observed during a flood event and that are reported in disaster psychology literature were considered. The methodology was applied to the Paglia River (Italy) for a 500-year return period flood event that overtopped the levee system recently constructed to protect the urbanized area. Data from the case study and the literature review was used to build the modelling framework. Three scenarios representing different time of flood warning, behaviour of people, and time of the flood onset were introduced and analysed. The application of the methodology to the case study of Orvieto provides the following main outcomes:
1. Human behaviour, in terms of the timing to react to a flood warning, is the factor with the most significant impact on the number of casualties. As expected, a small increase in the proportion of people that decides to evacuate immediately (straightforward behaviour) after a flood warning has a significant impact on the number of people successfully reaching a shelter, with the consequent decrease in the number of casualties. Not acting as instructed imitating the behaviour of others (sympathy behaviour) increase the number of casualties.
2. The time to complete the evacuation is mostly affected by the time at which the flood onset occurs. The percentage of people evacuated is approximately 4% higher during the day than during the night. This is because the people complete their daily activities in the city, where the floodplain is located, which makes the exposure lower at night. Similarly, if a flood happens during the evening, the percentage of people who reach the shelters just after the flood warning is about 2.3 times higher than in the morning. This is also reflected in the lower number of causalities in the evening. Therefore, this factor has the highest influence on population exposure.
3. A lead-time of 60 min is enough to ensure the evacuation of the totality of people who decide to evacuate. In contrast, a lead-time of 90 min allows reducing the number of causalities. As expected, dramatic results in terms of casualties are obtained when the warning is delayed by 30 min, as the number of people exposed in the flooded area goes up to 22% of the total population, and this is reflected in the number of causalities, which is increased up to 6 times. In this case, people evacuate because they directly perceive the flood danger and not because they receive a flood warning.
It is important to state the limitations of this study, which need to be addressed in future research. First, different levee failure mechanisms (e.g. piping) should be considered as they may occur during normal flow condition and not only during an extreme event as in the case of overtopping. Second, flood warning communication was assumed to occur only through official channels, whereas in reality, unofficial channels among agents (e.g. telephone, social media) could be active. Nevertheless, in the same line, it is also expected – given the small size of Orvieto Scalo and Ciconia, that all the agents receive the flood warning. Third, the interactions among agents have been simplified, although they can be very complex in reality. We limited these interactions to two basic ones, namely agents following other agents, and the traffic jams. In this regard, also other means of transport should be considered. Finally, this study focused on the population old enough to drive, thus, children or elderly people were excluded.
This study demonstrates that human behaviour during flood evacuation and the proper timing of the flood warning are essential factors for reducing fatalities during extreme events. The results of our study can contribute to the efforts to mitigate flood risk and can be used by water authorities, urban planners, and emergency managers to propose more efficient and effective evacuation plans, position of the shelters, and better timing selection to issue flood warnings. Moreover, our findings can provide some insights into the flood policy of the region, such as flood risk awareness programmes. Enhancing and supporting straightforward behaviours among the population against sympathy behaviours may save lives. The framework presented is flexible, adaptable to new environmental situations, and open to continuous improvements, positioning itself as a tool at the hand of civil protection members to generate case-specific flood evacuation plans.
Supplemental Material
Download PDF (135.1 KB)Acknowledgements
The authors acknowledge the Regione Umbria and the Consorzio per la Bonifica della Val di Chiana Romana e Val di Paglia for the data provided for this study. The authors acknowledge Erhu Du and an anonymous reviewer whose comments and suggestions helped to improve the paper. Part of this research was supported by the European H2020 Project GroundTruth 2.0 (Grant agreement 689744), by the Swedish Research Council FORMAS, and by the Centre of Natural Hazards and Disaster Science (CNDS) in Sweden.
Disclosure statement
No potential conflict of interest was reported by the authors.
Supplementary material
Supplemental data for this article can be accessed here.
Additional information
Funding
References
- Abebe, Y.A., et al., 2019. A coupled flood-agent-institution modelling (CLAIM) framework for urban flood risk management. Environmental Modelling and Software, 111, 483–492. doi:10.1016/j.envsoft.2018.10.015
- Ahern, A., et al., 2013. Analysis of national travel statistics in Europe OPTIMISM WP2: harmonisation of national travel statistics in Europe. Joint Research Centre Technical Reports. Available from: https://publications.jrc.ec.europa.eu/repository/bitstream/JRC83304/tch-d2.1_final.pdf [Accessed 19 Feb 2019].
- Auld, J., et al., 2012. Internet-based stated response survey for no-notice emergency evacuations. Transportation Letters - the International Journal of Transportation Research, 4 (1), 41–53.
- Banos, A., et al., 2017. Multiscale modeling: application to traffic flow. In: Agent-based spatial simulation with NetLogo. Vol. 2, Advanced Concepts, London, UK: Elsevier, 37–62.
- Becker, J.S., et al., 2015. A review of people’s behaviour in and around floodwater. Weather, Climate and Society, 7 (4), 321–332. doi:10.1175/WCAS-D-14-00030.1
- Bernardini, G., et al., 2017. Flooding risk in existing urban environment: from human behavioral patterns to a microscopic simulation model. Energy Procedia, 134, 131–140. doi:10.1016/j.egypro.2017.09.549
- Bhamidipati, S., Van der Lei, T.E., and Herder, P.M., 2016. A layered approach to model interconnected infrastructure and its significance for asset management. European Journal of Transport and Infrastructure Research, 16 (1), 254–272.
- Blöschl, G., et al. 2019. Twenty-three unsolved problems in hydrology (UPH) – a community perspective. Hydrological Sciences Journal, 64 (10), 1141–1158. doi:10.1080/02626667.2019.1620507
- Bonabeau, E., 2002. Agent-based modelling methods and techniques for simulating human systems. Proceedings of the National Academy of Sciences of the United States of America, 99 (3), 7280–7287. doi:10.1073/pnas.082080899
- Brocca, L., et al., 2008. Assimilation of observed soil moisture data in storm rainfall-runoff data. Journal of Hydrologic Engineering, 14 (2), 153–165. doi:10.1061/(ASCE)1084-0699(2009)14:2(153)
- Brocca, L., et al., 2009. Antecedent wetness conditions estimation based on ERS scatterometer data. Journal of Hydrology, 364 (1–2), 73–87. doi:10.1016/j.jhydrol.2008.10.007
- Büttner, G., and Kosztra, B. CLC2018 Technical Guidelines. Based on CLC2006 Technical guidelines (EEA Technical report No 17/2007) and CLC2012 Addendum to the CLC2006 Technical Guidelines (ETC/SIA report). Wien, Austria: Environment Agency, 2017
- Camici, S., et al., 2011. Design soil moisture estimation by comparing continuous and storm‐based rainfall‐runoff modeling. Water Resources Research, 47 (5), W05527. doi:10.1029/2010WR009298
- Center for Research on the Epidemiology of Disasters and United Nations Office for Disaster Risk Reduction, 2015. The human cost of weather related disasters 1995–2015. Brussels, CRED. Available from: https://www.unisdr.org/2015/docs/climatechange/COP21_WeatherDisastersReport_2015_FINAL.pdf [Accessed 01 June 2019].
- Chen, X., Meaker, J.W., and Zhan, F.B., 2006. Agent-based modeling and analysis of hurricane evacuation procedures for the Florida keys. Natural Hazards, 38 (3), 321–338. doi:10.1007/s11069-005-0263-0
- Cheng, Y. and Zheng, X., 2018. Can cooperative behaviors promote evacuation efficiency?. Physica A: Statistical Mechanics and its Applications, 492, 2069–2078.doi:10.1016/j.physa.2017.11.124
- Cowpertwait, P.S.P., et al., 1996. Stochastic point process modelling of rainfall. I. Single-site fitting and validation. Journal of Hydrology, 175 (1–4), 17–46. doi:10.1016/S0022-1694(96)80004-7
- Dawson, R., Peppe, R., and Wang, M., 2011. An agent-based model for risk-based flood incident management. Natural Hazards, 59 (1), 167–189. doi:10.1007/s11069-011-9745-4
- Dijkstra, E.W., 1959. A note on two problems in connexion with graphs. Numerische Mathematlk, l, 269–271. doi:10.1007/BF01386390
- Doocy, S., et al., 2013. The human impact of floods: a historical review of events 1980-2009 and systematic literature review. PLoS Currents Disasters. 2013 Apr 16. Edition 1. doi: 10.1371/currents.dis.f4deb457904936b07c09daa98ee8171a
- Du, E., et al., 2017. Exploring the role of social media and individual behaviours in flood evacuation processes: an agent‐based modelling approach. Water Resources Research, 53 (11), 9164–9180. doi:10.1002/2017WR021192
- Garcia, C. and Fearnley, C.J., 2012. Evaluating critical links in early warning systems for natural hazards. Environmental Hazards, 11 (2), 123–137. doi:10.1080/17477891.2011.609877
- Hardy, M. and Wunderlich, K., 2007. Evacuation Management Operations (EMO) modeling assessment: transportation modeling inventory [online]. Washington, DC, U.S. Department of Transportation. Research and Innovative Technology Administration. Available from: https://www.hsdl.org/?abstractanddid=11255 [Accessed 20 July 2019].
- Hitomi, N., Black, J., and Suenaga, Y., 2019. Investigating the flood evacuation behaviour of older people: A case study of a rural town in Japan. Research in Transportation, Business and Management, 30, 100376. doi:10.1016/j.rtbm.2019.100376
- Hofinger, G., Zinke, R., and Künzer, L., 2014. Human factors in evacuation simulation, planning, and guidance. Transportation Research Procedia, 2, 603–611. doi:10.1016/j.trpro.2014.09.101
- Iman, R.L. and Conover, W.J., 1982. A distribution-free approach to inducing rank correlation among input variables. Communications in Statistics - Simulation and Computation, 11 (3), 311–334. doi:10.1080/03610918208812265
- Ismaïl, S., et al., 2018. Investigating scalability in population synthesis: a comparative approach. Transportation Planning and Technology, 41 (7), 724–735. doi:10.1080/03081060.2018.1504182
- Leach, J., 1994. Survival psychology. London: Palgrave Macmillan UK.
- League, C.E., 2009. What were they thinking? Using YouTube to observe driver behaviour while crossing flooded roads. M.A. thesis, Department of Applied Geography, University of Colorado, 76 pp.
- Liu, X. and Lim, S., 2016. Integration of spatial analysis and an agent-based model into evacuation management for shelter assignment and routing. Journal of Spatial Science, 61 (2), 283–298. doi:10.1080/14498596.2016.1147393
- Liu, X. and Lim, S., 2018. An agent-based evacuation model for the 2011 Brisbane City-scale riverine flood. Natural Hazards, 94 (1), 53–70. doi:10.1007/s11069-018-3373-1
- Liu, Y., et al., 2010. Agent-based flood evacuation simulation of life-threatening conditions using vitae system model. Journal of Natural Disaster Science, 31 (2), 69–77. doi:10.2328/jnds.31.69
- Mard, J., Di Baldassarre, G., and Mazzoleni, M., 2018. Nightlight data unravel how flood protection shapes human proximity to rivers. Science Advances, 4 (8), eaar5779. doi:10.1126/sciadv.aar5779
- Mas, E., et al., 2015. Recent advances in agent-based tsunami evacuation simulations: case studies in Indonesia, Thailand, Japan and Peru. Pure and Applied Geophysics, 172 (12), 3409–3424. doi:10.1007/s00024-015-1105-y
- Mazzoleni, M., et al., 2017. Effects of levee cover strength on flood mapping in the case of levee breach due to overtopping. Hydrological Sciences Journal, 62 (6), 892–910. doi:10.1080/02626667.2016.1246800
- Medina, N., Sanchez, A., and Vojinovic, Z., 2016. The potential of agent based models for testing city evacuation strategies under a flood event. Procedia Engineering, 154, 765–772. doi:10.1016/j.proeng.2016.07.581
- Menoni, S., et al., 2016. Flood damage: A model for consistent, complete and multipurpose scenarios. Natural Hazards and Earth System Sciences, 16 (12), 2783–2797. doi:10.5194/nhess-16-2783-2016
- Michaelis, T., Brandimarte, L., and Mazzoleni, M., 2020. Capturing flood risk dynamics with a coupled agent-based and hydraulic modelling framework. Hydrological Science Journal, 65, 1458–1473. accepted. doi:10.1080/02626667.2020.1750617
- Molinari, D., et al., 2014. Ex post damage assessment: an Italian experience. Natural Hazards and Earth System Sciences, 14 (4), 901–916. doi:10.5194/nhess-14-901-2014
- Mordvintsev, A.S., et al., 2014. Simulation of city evacuation coupled to flood dynamics. Proccedings of the 6th International Conference on Pedestrian and Evacuation Dynamics, PED2012. Springer, 2013.
- Ren, C., Yang, C., and Jin., S., 2009. Agent-based modeling and simulation on emergency evacuation. In: J. Zhou, ed.. Complex sciences. Complex 2009. Lecture notes of the institute for computer sciences, social informatics and telecommunications engineering. Vol. 5. Berlin, Heidelberg: Springer, 1451–1461.
- Ridolfi, E., Albrecht, F., and Di Baldassarre, G., 2019. Exploring the role of risk perception in influencing flood losses over time. Hydrological Sciences Journal, 65 (1), 12–20. doi:10.1080/02626667.2019.1677907
- Rogers, D. and Tsirkunov, V., 2010. Global assessment report on disaster risk reduction: costs and benefits of early warning systems [online]. Washington, DC, World Bank. Available from: http://documents.worldbank.org/curated/en/609951468330279598/Global-assessment-report-on-disaster-risk-reduction-costs-and-benefits-of-early-warning-systems [Accessed 11 May 2019].
- Scolobig, A., et al., 2017. Warning system options for landslide risk: a case study in upper Austria. Resources, 6 (3), 37. doi:10.3390/resources6030037
- Solís, I. and Gazmuri, P., 2017. Evaluation of the risk and the evacuation policy in the case of a tsunami in the city of Iquique, Chile. Natural Hazards, 88 (1), 503–532. doi:10.1007/s11069-017-2876-5
- Taillandier, P., et al., 2018. Building, composing and experimenting complex spatial models with the GAMA platform. GeoInformatica, 23, 229–322.
- Tarpanelli, A., et al., 2012. A simple approach for stochastic generation of spatial rainfall patterns. Journal of Hydrology, 472-473, 63–76. doi:10.1016/j.jhydrol.2012.09.010
- Thomas, F. and Knüppe, K., 2016. From flood protection to flood risk management: insights from the Rhine River in North Rhine-Westphalia, Germany. Water Resources Management, 30 (8), 2785–2800. doi:10.1007/s11269-016-1323-9
- Toledo, T., et al., 2018. Analysis of evacuation behavior in a wildfire event. International Journal of Disaster Risk Reduction, 31, 1366–1373. doi:10.1016/j.ijdrr.2018.03.033
- Uno, K. and Kashiyama, K., 2008. Development of simulation system for the disaster evacuation based on multi-agent model using GIS. Tsinghua Science and Technology, 13 (1), 348–353. doi:10.1016/S1007-0214(08)70173-1
- Vorst, H.C., 2010. Evacuation models and disaster psychology. Procedia Engineering, 3, 15–21. doi:10.1016/j.proeng.2010.07.004
- Wang, H., et al., 2016. An agent-based model of a multimodal near-field tsunami evacuation: decision-making and life safety. Transportation Research Part C: Emerging Technologies, 64, 86–100. doi:10.1016/j.trc.2015.11.010
- Zheng, Y., et al., 2019. Simulation of pedestrians’ evacuation dynamics with underground flood spreading based on cellular automaton. Simulation Modelling Practice and Theory, 94, 149–161. doi:10.1016/j.simpat.2019.03.001
- Zhu, Y., et al., 2018. Hurricane evacuation modeling using behavior models and scenario-driven agent-based simulations. Procedia Computer Science, 130, 836–843. doi:10.1016/j.procs.2018.04.074