
 ?Mathematical formulae have been encoded as MathML and are displayed in this HTML version using MathJax in order to improve their display. Uncheck the box to turn MathJax off. This feature requires Javascript. Click on a formula to zoom.
ABSTRACT
The study assesses the variability and trends of both meteorological and hydrological droughts from 1970 to 2013 in Lake Malawi and Shire River basins using the standardized precipitation index (SPI) and standardized precipitation and evaporation index (SPEI) for meteorological droughts and the lake level change index (LLCI) for hydrological droughts. Trends and slopes in droughts and drought drivers are estimated using Mann-Kendall test and Sen’s slope, respectively. Results suggest that meteorological droughts are increasing due to a decrease in precipitation which is exacerbated by an increase in temperature (potential evapotranspiration). The hydrological system of Lake Malawi seems to have a >24-month memory towards meteorological conditions, since the 36-month SPEI can predict hydrological droughts 10 months in advance. The study has found the critical lake level that would trigger hydrological drought to be 474.1 m a.s.l. The increase in drought is a concern as this will have serious impacts on water resources and hydropower supply in Malawi.
Editor S. Archfield Associate editor not assigned
1 Introduction
Droughts are natural hazards that affect many regions in the world, not limited to (semi-) arid areas. They generally arise due to shortage of water availability, which may result from the interaction of various factors including meteorological, hydrological or water management conditions. However, a comprehensive definition of droughts is difficult to formulate due to the range of possible causes, complex interactions and feedbacks between them, and different impacts on nature, society and the economy. Due to this variety, Svoboda et al. (Citation2012) and Spinoni et al. (Citation2014) distinguish four drought categories ranging from meteorological and hydrological droughts to agricultural and socio-economic droughts. Meteorological drought refers to a lack of rainfall compared to long-term means, while hydrological drought refers to water availability deficits leading to shortages in consumable water resources. Agricultural drought is defined as soil water deficits for crops, and socio-economic drought refers to consequences of water shortages that restrict access to water or to goods and services that rely on the availability of water. Various statistical measures are available that describe the duration, frequency and severity of droughts based on different thresholds and predictors (Mishra and Singh Citation2010).
The Southern African region is frequently affected by water shortages. Rouault and Richard (Citation2005) studied droughts in Southern Africa covering south of latitude 10 degrees South (which covers parts of Malawi) and identified eight severe drought years during the period 1901–1999. Based on the standardized precipitation index (SPI), they found the worst droughts in terms of areal extent covered at the 6-month scale in 1916, 1924, 1933, 1949, 1970, 1983, 1992 and 1995 and at the 2-year scale in 1906, 1933, 1983, 1984, 1992, 1993, 1995 and 1996. They further found an increase in areal drought extension in Southern Africa from the 1970s onwards, and the particularly intensive and extended droughts between 1970 and 1998 were linked to the southern oscillation index (SOI; Richard et al. Citation2001). Similarly, Rouault and Richard (Citation2005) found an increase in the frequency of droughts in Southern Africa beginning in 1980.
Water resources in Malawi highly depend on the hydrology of Lake Malawi and its basin. As the ninth largest lake in the world (in terms of water volume), it is the key water resource and reservoir for hydro-power generation on the Shire River, which originates at the only southern outlet of the lake. The capacity installed and electricity generated at the seven hydropower plants on the Shire River account for 80.2% and 98%, respectively, of the country’s total electricity power (Taulo et al. Citation2015). Because of the utmost importance of Shire River flow for electricity production, lake level fluctuations of Lake Malawi affect lake outflow and thus impact power generation enormously. For instance, the below-normal rainfall seasons of 2014/2015 and 2015/2016 resulted in falling lake water levels and reduced river flows, which decreased power production by more than 50% (ESCOM Citationn.d.). Between 1915 and 1935, outflow from the lake into the Shire River was even totally interrupted (Shela Citation2000), which nowadays would lead to a complete failure in energy supply. As the demand for electricity is increasing, hydropower will maintain its position as the main source of electricity in the short to medium term compared to other energy sources in Malawi. To date, there are plans to invest in more hydropower stations on the Shire River to secure future energy demands (GOM Citation2010, Milleniun Challenge Corporation Citation2015). However, the impacts of climate change-related modifications of the hydrological cycle on hydropower productivity in Lake Malawi and Shire River basins have so far barely been investigated.
In addition to their importance for hydropower production, Lake Malawi and the Shire River supply water to adjoining cities and towns. The lake and river also supply water for irrigation purposes to crop plantations. As such, the recurrence of droughts leads to intensive water rationing in the Shire River basin, as was the case in 2015/2016 (World Bank Citation2017). Also affected by the occurrence of droughts is the fishery industry, which plays a considerable role on both Lake Malawi and the Shire River. Lake Malawi has an extraordinary richness of fish as it contains between 500 and 1000 fish species, and 99% of these are cichlids which are endemic to Lake Malawi (Duponchelle and Ribbink Citation2000). All of these aspects illustrate the economic importance of the lake and the Shire River, and highlight the importance of proper basin management for the availability, sustainability and accessibility of water resources.
The literature reveals that below-normal rainfall amounts in the past have affected the economy of Malawi in various sectors including hydropower generation, hydrology and agriculture (Makoka Citation2008, Pauw et al. Citation2011, Fisher et al. Citation2015). Combined drought and flood effects contribute to a loss of at least 1.7% of Malawi’s gross domestic product (GDP) each year (Pauw et al. Citation2011). From this perspective, the recurrence of droughts might increase the vulnerability of many affected households as it contributes to increases in food shortages, food prices, farm input prices and household business failures (Makoka Citation2008).
Strategies to either reduce the impacts of or enhance resilience to droughts are essential in all sectors, including hydropower generation. However, this requires the full understanding of weather events and their effects on the economy (Pauw et al. Citation2011). For Malawi, several drought studies have focused on drought impacts and adaptation based on drought insurance (Syroka and Nucifora Citation2010), drought-tolerant crops (Fisher et al. Citation2015, Holden and Fisher Citation2015), food security and nutrition (Babu and Chapasuka Citation1997), household vulnerability (Makoka Citation2008) and groundwater management (Calow et al. Citation1997). In addition to Richard et al. (Citation2001) and Rouault and Richard (Citation2005), who investigated meteorological drought dynamics at broad spatial scales, Munthali et al. (Citation2003) identified six drought events during the 20th century in Malawi and attributed five of them to the El Niño Southern Oscillation (ENSO). A link between the Pacific Ocean dynamics and extreme rainfall in Malawi was also found by Jury and Gwazantini (Citation2002), and Jury (Citation2014) attributed floods and drought to large-scale circulation in both the Pacific and Indian oceans. Zuzani et al. (Citation2019) found that the Shire River basin has the potential to experience hydrological droughts due to observed decreasing minima of both rainfall and streamflows.
In this study, we consider drought dynamics of Lake Malawi basin (LMB) and the upper part of the Shire River basin (SRB) from both a meteorological and a hydrological perspective. Using several meteorological and hydrological drought indicators, we study changes in rainfall, temperature and evaporation dynamics as well as lake level variations and their implications for drought occurrence, duration, severity, frequency and intensity in the LMB and SRB. We also seek to identify the relationship between meteorological and hydrological droughts in these socio-economically important regions. The following specific research questions are addressed by this study:
What are the changes in the hydro-meteorological drivers for droughts, and do these impact meteorological drought characteristics in the LMB and SRB?
How does temperature (evaporation) affect meteorological droughts?
How are meteorological and hydrological droughts related to each other in the study area?
2 Study area and data
2.1 Study area
The LMB is located in South-Eastern Africa and shares borders with Malawi, Tanzania and Mozambique (). It covers an area of 125 500 km2, including the lake surface area of 29 600 km2. The LMB lies in the East African Rift Valley where the lake surface is at around 457 m a.s.l. and the land rises from the lake to high plateaus. The highest points of the basin reach elevations of more than 2000 m a.s.l. Much of the land in the basin has experienced massive land-cover changes, from woodlands to mostly cultivated land (Palamuleni et al. Citation2011). For instance, the agricultural land area increased by 18% between 1989 and 2012 in the Shire River upper catchment (Palamuleni et al. Citation2011). The forest cover in LMB decreased from 64% in 1967 to 51% in the early 1990s (Calder et al. Citation1995).
The lake has more than nine major tributaries, and it drains into its only outlet in the south, the Shire River. As such, the lake is the main reservoir for hydropower generation on the Shire River. In size, the Shire River has a catchment area of 23 500 km2 and flows for 401 km before draining into the Zambezi River in Mozambique. The middle Shire, where hydro-power generation takes place, is 80 km long and characterized by deep gorges with steep slopes. The hydraulic gradient of 370 m provides a considerable potential for hydropower generation (Shela Citation2000).
Both the LMB and SRB are dominated by tropical climate throughout the year, with a pronounced rainy season between October and April. The largest rainfall amounts fall between December and April (the maximum mean value in January is 240 mm; ). It is generally dry from June to September, with monthly rainfall below 10 mm on average in this period. Mean annual rainfall ranges from 800 to more than 1800 mm. The LMB shows an east–west gradient with larger rainfall amounts towards the eastern part of the domain, around the lake area ().
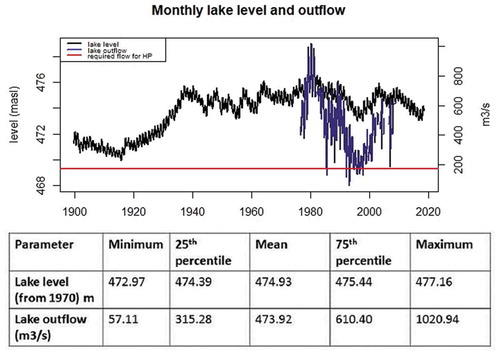
The annual and seasonal variability of lake levels highly affects discharge in the Shire River (), which requires a firm river flow of >170 m3 s−1 for sufficient hydropower generation (Shela Citation2000). High flows occur from January to May, and the lowest flows usually occur in October and November. About 80 km downstream of the outlet at Liwonde (), a barrage was constructed in the 1960s to control water flow for hydro-power generation. The barrage operates only at lake levels between 473.2 and 475.32 m a.s.l. Although the barrage is 80 km downstream from the outlet, the literature indicates that backwater still affects the outflow from the lake so that the lake level is 0.2 m to 0.6 m higher due to the control of the barrage (Drayton Citation1979, Kidd Citation1983, Shela Citation2000). Drayton (Citation1984) and Calder et al. (Citation1995) concluded that changes in lake level are largely attributable to rainfall, and land-use change effects are less significant. The water balance of LMB is given by:
Figure 1. The study area, Lake Malawi and Shire River basins
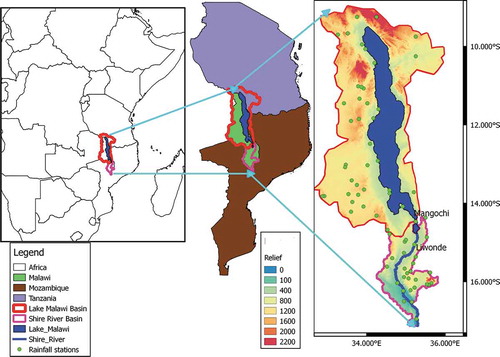
Figure 2. Mean annual rainfall pattern and monthly mean rainfall in Lake Malawi and Shire River basins
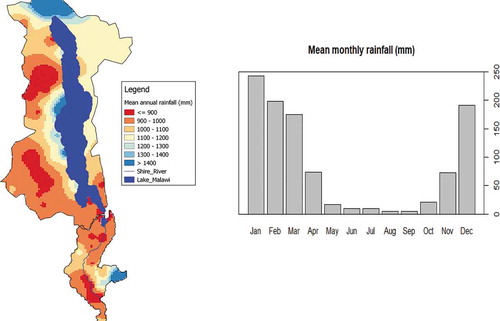
Figure 3. Lake level and lake outflow. Statistical parameters are from 1970 to 2013 for lake level and from 1976 to 2009 for outflow. The red line is the flow required for maximum hydropower generation
where is basin rainfall,
is basin evapotranspiration,
is outflow and
is change in storage, which is mainly expressed by changes in lake level. It is assumed that over longer time scales, the water received in the catchment will be transferred to outflow at the lake outlet at Mangochi (), if it is not lost by evaporation. The water balance of the LMB is mainly driven by rainfall and evaporation since only 16.3–19.5% of the water received in the basin from rainfall is transferred to outflow and the rest is lost by evapotranspiration (Kidd Citation1983, Drayton Citation1984, Neuland Citation1984). Since EquationEquation (1)
(1)
(1) considers the whole lake basin area, changes in lake inflow through the lake tributaries are assumed to be inherently included and reflected among the changes in lake level.
2.2 Data
The climate data utilized in this study was obtained from the Department of Climate Change and Meteorological Services in Malawi. Daily rainfall data from 65 locations in the LMB and SRB (, far right) is used covering the period 1970–2013. Since the LMB covers parts of Tanzania and Mozambique, rainfall data in this region is complemented with gridded 0.5° resolution Global Precipitation Climatology Centre (GPCC) data at four grid points, which was retrieved from the National Center for Atmospheric Research.Footnote1 GPCC rainfall data has been found to reasonably represent rainfall characteristics in this region (Mtilatila Citation2010). Since GPCC is estimated from station data, the quality of its performance increases with the number of stations per grid. For instance, the Pearson correlation between GPCC and station rainfall data in Malawi ranged between 0.82 with one station per grid cell to 0.94 with seven stations per grid cell (Mtilatila Citation2010). The temperature data used in this study is from the Climatic Research Unit (CRU), University of East Anglia, UK.Footnote2 Monthly lake level and daily lake outflow datasets are provided by the Department of Water Resources in Malawi and cover the periods 1899 to 2015 and 1976 to 2009, respectively.
3 Methods
3.1 Meteorological drought estimation (SPI and SPEI)
Several drought indices have been developed in recent years, and all of them aim to quantify drought characteristics in a certain way (Mishra and Singh Citation2010). One of the most commonly used indices to quantify meteorological droughts is the standardized precipitation index (SPI), which is also applied in this study. The SPI was designed by Mckee et al. (Citation1993), and it is used to quantify precipitation excess and deficits over a certain period (usually several months). The estimation of the SPI is based on long-term observation records, which are transformed to a normal distribution after they have been fitted to a probability density function. In turn, the mean and median of the long-term record are zero. The SPI of monthly rainfall can then be interpreted as the number of standard deviations by which a certain monthly rainfall deviates from the long-term mean. Mathematically, the SPI is defined as the difference between monthly precipitation on a given time scale and the mean value
of the entire observation period, divided by the standard deviation, σ:
Long-term precipitation records of at least 30 years are recommended for the estimation of the SPI (Svoboda et al. Citation2012), and in this analysis, the SPI refers to the rainfall record period from 1970 to 2013. The SPI can quantify the precipitation anomalies for various time scales. For the sake of water resources, and also the vastness of LMB, 12 consecutive months or more are preferred in this study.
However, precipitation-based drought indices like SPI neglect the importance of (increasing) temperature effects on drought conditions, since they assume variables other than precipitation to be less variable and stationary in time. Considering heat-stress amplified drought situations, e.g. in Europe during summer 2003 and 2018 (Rebetez et al. Citation2006, Vogel et al. Citation2019), the importance of temperature and evapotranspiration for drought conditions is evident, and increasing temperature may potentially exacerbate drought situations. To account for this issue, we also estimated the standardized precipitation and evaporation index (SPEI). The SPEI is computed similarly to the SPI, with the difference that and
in EquationEquation (2)
(2)
(2) represent not precipitation but the climatic water balance, i.e. the difference between precipitation and potential evapotranspiration (PET) (Vicente-Serrano et al. Citation2010). Here, we used the Thornthwaite (Citation1948) equation to model monthly PET, as this method requires only sunshine hours and temperature as data inputs:
where S is sunshine hours, d is total days of the month, and t is average temperature. I is the annual heat index which is calculated as a summation of monthly heat indices i (Vicente-Serrano et al. Citation2010):
The α is given as 675.10-9.I3 – 771.10-7I2 + 1792.10-5I + 0.49239
The comparison of the SPEI with the SPI then provides insights into the relative role of temperature (PET) on drought situations in the study area.
3.2 Hydrological drought estimation based on lake level change index
Since this study also aims to investigate (trends in) hydrological droughts and their relationships to meteorological droughts, we need to apply an estimation of hydrological droughts which is comparable to the meteorological drought indices. As illustrated in Section 2.1, changes in lake level highly depend on rainfall characteristics, and streamflow within the Shire River highly depends on the outflow from the Lake Malawi which is dominantly controlled by the lake level. Therefore, we applied a similar analysis to that of Shukla and Wood (Citation2008), who compared a standardized runoff index (SRI – computed similarly to the SPI but with runoff instead of precipitation) with the SPI in a river basin in Northern California. Instead of runoff, we focused on lake level variations by introducing the lake level change index (LLCI) which incorporates hydrologic processes that describe the response lag in the effect of precipitation on lake level. This provides a further understanding of the impact of meteorological droughts on lake level, which may designate hydrological droughts within the LMB and potentially in the SRB due to the close relation between lake level and outflow from the lake. Therefore, corresponding to the SPI, LLCI is calculated as follows:
where represents the monthly lake level over a given time scale (here, 12 months),
is the lake level mean over the period 1970–2013, and σ is the standard deviation of normalized lake level. Analogous to the interpretation of the SPI and SPEI, the LLCI for a certain month represents the number of standard deviations from the long-term median lake level.
3.3 Definition of drought parameters
Positive SPI, SPEI and LLCI values indicate higher than median (wet, higher), and negative values indicate lower than median (dry, lower) conditions and lake level, respectively. Referring to Mckee et al. (Citation1993) and WMO (Citation2012), the interpretation follows criteria in which a meteorological drought starts when the SPI (SPEI, LLCI) value is equal to or less than −1 and ends when the SPI (SPEI, LLCI) turns positive (). The start and end points of a meteorological or hydrological drought provide its duration (DD) in terms of the number of months. The lowest SPI (SPEI, LLCI) value obtained during a given DD is the intensity of the drought (DI). The absolute accumulated SPI (SPEI, LLCI) values over DD indicate the drought severity (DS) (Dayal et al. Citation2018).
Table 1. Modified standardised precipitation index (SPI) classification. Information source: World Meteorological Organization (Citation2012). (Standardised precipitation and evaporation index (SPEI) and lake level change index (LLCI))
In this study, moderately dry −1 ≤ SPI (SPEI, LLCI) ≤ −1.49 is defined as moderate drought, severely dry −1.5 ≤ SPI (SPEI, LLCI) ≤ −1.99 is a severe drought and extremely dry SPI (SPEI, LLCI) ≤ −2 is an extreme drought (). Drought frequency (DF) is the number of drought events at a particular location from 1970 to 2013. The percentage of total drought months from 1970 to 2013 is also presented to provide further information in cases where less frequent droughts take place for a longer period of time. The spatial extent of a given meteorological drought event is estimated by the number of stations that show corresponding SPI (SPEI) < −1 during the particular event. Obviously, the drought parameters described above are not independent from each other. They serve only to characterize detected drought events and to identify potential differences in spatial patterns.
3.4 Trend analysis
The non-parametric Mann-Kendall (MK) test (Mann Citation1945, Kendall Citation1975) is used to obtain trends in lake level, rainfall and temperature and the drought parameters described in Section 3.3. The MK test is based on ranked-transformed time series, so it can identify the presence of a monotonic trend in a particular time series but cannot quantify its absolute magnitude. The main advantage of the MK test is that it is non-parametric and, thus, does not require any assumptions regarding the underlying statistical distribution of the time series. This makes the MK test highly robust towards skewed distributions, which are often characteristic of environmental data.
The MK test examines the null hypothesis that the data come from a population with independent realizations and identical distribution, i.e. that the time series is independent from time with no trends. The alternative hypothesis is that the random variable of a distribution follows a monotonic trend over time. The MK S-statistic is calculated as:
where
Thus, for j > k, S sums up the number of times that observation xj exceeds xk relative to the number of times that xk exceeds xj. The direction of a trend is indicated by the sign of S. Detected trends are tested for their significance based on two-sided p values at the 10%, 5%, and 1% significance levels (p ≤ 0.1; p ≤ 0.05; p ≤ 0.01). To account for seasonal changes in the data series, we apply the MK test on monthly values. That is, trends are firstly detected for each month separately, and, secondly, the trends in individual monthly trends are estimated over the considered time series.
We also estimate regional trends, SR, for the larger basin area (meteorological trends and trends in drought statistics). For this, the MK scores are generated for each site in a first step, before they are corrected based on the systematic variance-covariance matrix according to Libiseller and Grimvall (Citation2002):
where S is the vector of Mann-Kendall scores for each site 1 ≤ I ≤ d (Helsel and Frans Citation2006, Pohlert Citation2017).
The magnitude of (significant) trends is estimated by the robust linear Sen’s slope estimator (Helsel and Hirsch Citation2002), which is estimated from the median of slopes between all pairs of data points in the particular time series. In turn, the MK test and Sen’s slope estimator provide complementary information regarding the existence and magnitudes of the significant trends.
4 Results
4.1 Hydro-meteorological trends
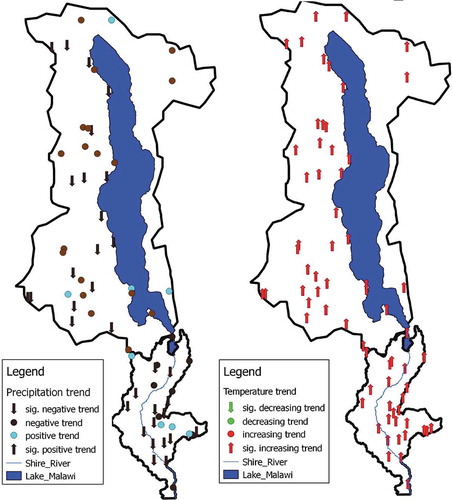
In this section, regional and individual trends in rainfall, temperature (as a proxy for evapotranspiration) and lake level are presented. For rainfall, the regional trend analysis reveals that rainfall at the basin scale (both LMB and SRB) is decreasing, although this decrease is statistically not significant (). Looking at the rainfall trends at individual stations in both the LMB and SRB (, left), about 88.4% of the stations show negative trends, 47.8% of which are statistically significant (p < 0.05). Only four stations each in the LMB and SRB show positive (but insignificant) trends in rainfall.
Table 2. Mann-Kendall (MK) test (tau) and Sen’s slope results for precipitation, temperature and lake level at the regional scale. Only Sen’s slopes of significant MK test trends are presented
Temperature trends are consistently positive and statistically significant both at the larger basin scale and for the individual stations (; , right). The regional trend analysis reveals that temperature has increased by 0.02°C per year (0.8°C over 40 years). This regional trend is statistically significant at p < 0.01. Trends for individual stations are statistically significant at least at p < 0.05.
Figure 4. Mann-Kendall (MK) test results from 1970 to 2013 in Lake Malawi and Shire River basins for rainfall (left) and temperature (right). The significance of the trends is based on p < 0.05
For the same period (1970–2013), the water level of Lake Malawi has decreased by 0.025 m per year (~1.0 m over 40 years) (). This negative trend matches with the decrease in rainfall and the increase in temperature (evaporation). Although the lake level decline started around the early 1980s, the most considerable decrease in the early 1990s led to the minimum lake level of 472.97 m a.s.l. in 1997 for this period. This low lake level resulted in almost no outflow from Lake Malawi to the Shire River (Bootsma and Jorgensen Citation2005).
4.2 Drought detection
The results are presented below for the meteorological drought analyses based on the SPI and SPEI (Section 4.2.1) and the hydrological drought analysis based on the LLCI (Section 4.2.2).
4.2.1 Meteorological drought
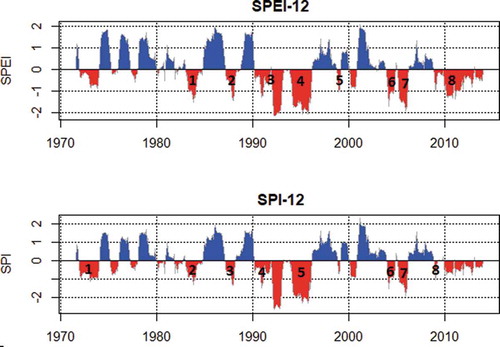
Meteorological droughts at the basin scale are estimated using the SPI12 and SPEI12 drought indices (calculated based on consecutive 12 months). At the basin scale, eight drought events were detected for each drought index (; ). Due to the similarity of the two drought indices, the detected drought events show large temporal commonalities, as expected. However, one drought event (1973–1974) is only captured by the SPI and not by the SPEI, whereas another event (1998–1999) is only captured by the SPEI and not by the SPI. The vast majority of drought events last for more than one year, and the most severe and intense droughts occurred in the 1990s (). The most extensive coherent meteorological drought in the basins identified by SPEI was from 1992 to 1996 and covered 62.5% of the stations. For the SPI, the most extensive coherent drought was from 1990 to 1993 and covered 61.2% of the stations (). On average, the percentage of stations covered by droughts is higher for the estimates based on the SPEI (50.3%) as compared to the estimates based on SPI (40.7%).
Table 3. Meteorological drought events in Lake Malawi and Shire River Basins between 1970 and 2013 as detected by standardised precipitation and evaporation index and standardised precipitation index at 12-month scale (SPEI12 and SPI12)
Figure 5. Standardised precipitation and evaporation index and standardised precipitation index at 12-month scale (SPEI12 and SPI12) series for Lake Malawi and Shire River basins from 1970 to 2013. Numbers represent drought events
compares the mean SPI12 and SPEI12 at the larger basin scale in terms of mean drought severity, intensity, duration and frequency, and the percentage of months with droughts occurring, over the period 1970–2013 (see Section 3.3). Except for drought intensity, the estimates based on the SPEI are slightly larger than the estimates based on the SPI, which indicates more severe drought situations based on SPEI. However, as indicated by the t-test (), the differences between the estimates based on the SPEI and SPI are rarely significant, due to the similarity between the two indices.
Table 4. Comparison of mean spatial standardised precipitation index and -standardised precipitation and evaporation index at 12 month scale (SPI12 and SPEI12) in terms of the mean drought severity, intensity, duration and frequency and the percentage of total drought months, using t-test
Droughts established by SPEI show longer drought duration (by 6.2%), and, consequently, a higher percentage of months with occurring droughts (difference of 7.3%). Still, drought intensity based on SPEI is 6% weaker as compared to SPI. As a result, the mean drought severity at basin scale (which is a function of both drought intensity and drought duration) shows the smallest difference between SPEI and SPI (4.7%). This illustrates how closely related the chosen drought parameters are.
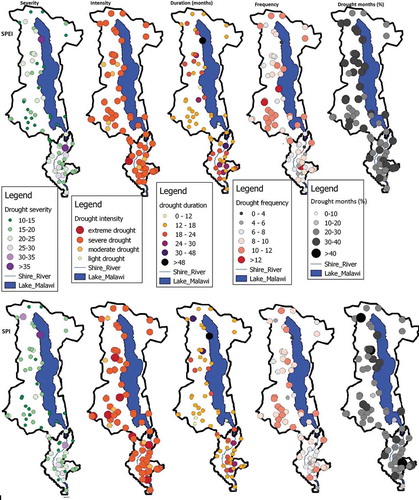
presents maps illustrating the spatial variability of mean drought parameters over the period 1970–2013 within the LMB and SRB for the SPEI12 and SPI12. Again, the spatial patterns for each drought parameter are fairly similar for the two meteorological drought indices. Still, there are some smaller spatial differences, particularly regarding drought severity. The SPEI indicates a slightly larger drought severity at 41 (59%) of the stations compared to the SPI. The SRB shows a higher drought severity than the LMB. Regarding drought intensity, only very few stations (seven for SPEI, six for SPI) show droughts of moderate intensity on average. Some stations (two for SPEI, five for SPI) show “extreme drought,” while the majority of stations show “severe drought.” On average, droughts last longer in SRB (based on both indices), although the station with the longest drought duration (>48 months) is located in the northern part of the LMB. Most stations show mean drought durations of 12–18 months, while the estimates based on SPEI tend to be slightly larger as compared to those of the SPI. The percentage of months with drought occurrence situations is also slightly larger for SPEI than for SPI (, right). Here, the largest values are found for the western part of the LMB. The largest frequency of meteorological drought events is found at the south-western part of LMB, and the estimates based on SPEI tend to be larger than those based on SPI. The maps also illustrate that the presented drought parameters are not independent from each other. It is obvious, for instance, that areas with long drought events do naturally have less frequent drought occurrences, and vice versa (over a 43-year period).
Figure 6. Mean drought parameters generated from the standardized precipitation and evaporation index (SPEI) and the standardized precipitation index (SPI) in Lake Malawi basin (LMB) and Shire River basin (SRB) for the period 1970–2013. The parameters from left to right are severity, intensity, duration, frequency and percentage of total drought months
4.2.2 Hydrological droughts in LMB and their link to meteorological droughts
Hydrological droughts are determined by the proposed LLCI12 (based on 12 consecutive months). The temporal occurrence of hydrological droughts in the LMB is illustrated in . Only one hydrological drought is identified for the period 1970–2013. This drought, though, lasted for 101 consecutive months, from June 1994 to October 2002. The intensity of this hydrological drought is −2.2 (“extreme drought”) and its severity is 132.9. During this drought period the lake level dropped on average by 0.9 m, while during its most intensive time in 1997, the lake level dropped by 1.9 m to the lowest level in the period 1970–2013.
The critical lake levels associated with moderate drought (LLCI < −1), severe drought (LLCI < −1.5) and extreme drought (LLCI < −2) are obtained using EquationEquation (5)(5)
(5) , and are 474.1 (which marks the onset of a hydrological drought when water level falls below this level), 473.7 and 473.3 m a.s.l., respectively. Hence, from 1970 to 2013 hydrological drought covered 14.9% of the months, while severe and extreme droughts covered 8.5 and 2.5% of the months, respectively.
Since it is assumed that a hydrological drought occurs subsequently to a meteorological drought, also displays the temporal occurrences of meteorological droughts in LMB only. The temporal variability of the SPEI12 ()) is much larger as compared to the LLCI12, so that in total 11 meteorological drought events with a much shorter duration are detected in LMB. The difference in the numbers of meteorological drought events as compared to is due to the adjusted spatial reference and numbers of stations when estimating the regional average. It also seems that it needs either a meteorological drought of certain intensity or droughts at frequent intervals to trigger a hydrological drought due to the compensation capacity of the lake. The lowest SPEI12 values and the most frequent drought occurrences are found in the 1990s, which matches with the single hydrological drought detected by the LLCI12. The two lowest values for both SPEI12 (−2.0, −2.1) and LLCI12 (−2.1, −2.2) show a temporal offset of more than 1 year; i.e. the lowest LLCI12 follows the lowest SPEI12 by more than 1 year.
Figure 7. Hydrological and meteorological droughts in Lake Malawi basin from 1970 to 2013. Numbers represent drought events. (a) Lake level change index (LLCI) is based on 12-month scale. Meteorological droughts are based on standardised precipitation and evaporation index at (b) 12-month scale (SPEI12), (c) 24-month scale (SPEI24) and (d) 36-month scale (SPEI36)
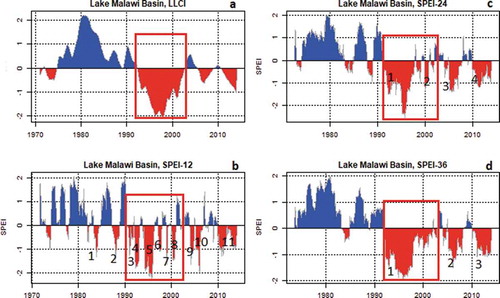
In this regard, also show time series for SPEI24 and SPEI36 (based on 24 and 36 consecutive months, respectively). It becomes apparent that LLCI12 follows SPEI24 and SPEI36 much better than SPEI12 does. Considering SPEI24 and SPEI36, the frequency of meteorological droughts is decreasing while the duration is increasing, which also leads to an increasing linear relationship with the LLCI12 (. The meteorological drought based on SPEI36, which matches best with the hydrological drought, has a duration of 116 months (April 1992 to November 2001), as compared to 101 months for the hydrological drought (June 1994 to October 2002). However, as the pattern becomes more linear, many degrees of freedom from the series are removed, and this leads to inflated estimates of SPEI24 and SPEI36. The correlation between the LLCI12 and the SPEI, however, improves from 0.42 (SPEI12) to 0.64 (SPEI24) and 0.8 (SPEI36) (). The percentage of months with meteorological droughts occurring (SPEI < −1) does not considerably differ among different aggregation levels: 17.4% (SPEI12), 17.7% (SPEI24), and 17.2% (SPEI36).
Figure 8. Comparison of hydrological drought based on lake level change index at 12-month scale (LLCI12) and meteorological droughts based on standardised precipitation and evaporation index at (a) 12-month scale (SPEI12), (b) 24-month scale (SPEI24), (c) 36-month scale (SPEI36) in Lake Malawi basin only. (d) The relationship between SPEI36 and LLCI12t10 (10-month lag). Vertical and horizontal yellow lines mark drought threshold
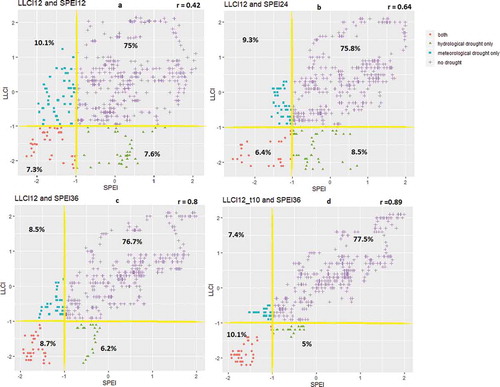
Figure 9. Comparison of standardised precipitation and evaporation index at 36-month scale (SPEI36), lake level change index at 12-month scale (LLCI12) and LLCI12 at 10-month lag
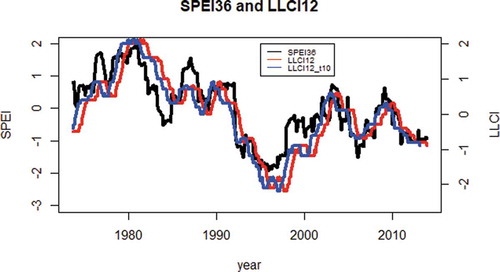
Although the time series of the SPEI36 matches well with the LLCI12, there is still a time lag between the two time series, i.e. peaks and lows of the SPEI36 occur earlier as compared to the LLCI12 (). Shifting the LLCI time series forward in time by 10 months leads to the largest improvement in the correlation between the SPEI36 and LLCI12t10, to 0.89 ()). This indicates that SPEI36 can predict LLCI12 at least 10 months in advance. Therefore, LLCI12 and SPEI36 are related by
4.3 Trends in meteorological and hydrological droughts
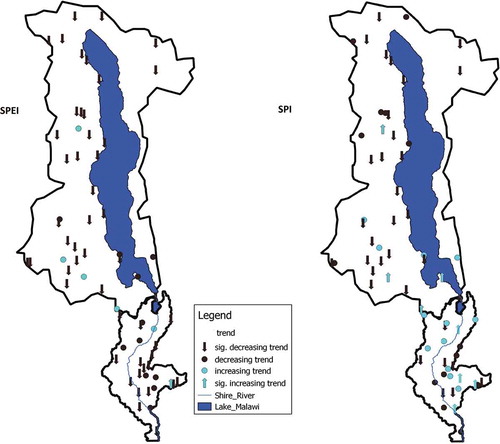
illustrates the trends in SPI12 and SPEI12 for the meteorological stations within the LMB and SRB. The SPEI (, left) is significantly decreasing at 60.9% of the stations. The largest density of stations with significant decreases in SPEI is found in the northern and western part of the LMB. The SPI is significantly decreasing at only 47.8% of the stations with a similar spatial pattern. Note that this is the same percentage of stations with significant negative trends as before for rainfall (see Section 4.1), although the spatial patterns differ to some degree. At nine stations (in contrast to only one station for the SPEI), the SPI shows significant positive trends, indicating less severe droughts over time. Most of the stations with positive trends are primarily located in the SRB.
Figure 10. Meteorological drought trends in Lake Malawi and Shire River basins for the standardized precipitation and evaporation index (SPEI) and the standardized precipitation index (SPI). The significance of the trends is based on p < 0.05. The decreasing trend implies increase in drought
The results of the regional trend analyses () at the annual scale underline the picture of an overall decrease in SPEI12 and SPI12 values (i.e. an increase in drought intensity). The trend magnitude regarding significant increasing meteorological drought indices is larger for the SPEI (tau = −7.91) than for the SPI (tau = −3.86). Note that, in contrast to the regional trend statistics for rainfall, the regional trend in the SPI is significant. This relates to the transformation of the time series and the aggregation over 12 months.
Table 5. Mann-Kendall (tau) and Sen’s slope results for meteorological and hydrological drought parameters. A negative trend for drought intensity signifies an increasing trend of drought. Only Sen’s slopes for parameters with significant trends are presented
In addition, while the differences between mean SPEI and SPI in terms of the drought parameters such as severity, duration and frequency are not significantly different (see Section 4.2), increasing trends in drought severity at the larger basin scale are larger and only significant for SPEI (0.25% per year which is 10% in 40 years) and not for the SPI (). This is also reflected in the increasing proportion of stations experiencing droughts at the same time in the basin, which is significant for only the SPEI (0.02% per year, which is 0.8% in 40 years) ().
Comparing trends in meteorological and hydrological droughts is only possible for the LMB. As suggested by , the regional trend estimates for the LMB underline that meteorological droughts are significantly increasing for both meteorological drought indices (again, slightly larger for the SPEI). Hydrological droughts, as determined by the LLCI, are also slightly but significantly increasing (i.e. decreasing LLCI values). The decrease in the LLCI (−0.003% per year), though, is slightly smaller as compared to the trends in SPEI and SPI ().
5 Discussion
5.1 On the link between trends in meteorological drivers and meteorological droughts
The detected trends in the hydro-meteorological drivers agree with the findings of Ngongondo et al. (Citation2011, Citation2015), who studied the spatial and temporal variability of rainfall and changes in the components of the water balance in Malawi for the periods 1960–2006 and 1971–2000, respectively. Droughts have become more relevant for the LMB and SRB over the past 43 years, and the most severe and intense drought situation occurred during the 1990s. This agrees with the findings of Rouault and Richard (Citation2005) for the whole of Southern Africa, suggesting that the drought situation in Malawi can be seen in a larger geographical context. However, similar findings from Malawi (e.g. Menon Citation2007, Denning et al. Citation2009, Syroka and Nucifora Citation2010) also underline the drought dynamics detected in this study, although they were based on different indicators, such as low farm production and famines. Such drought indicators do not fully reflect the meteorological drought in the area since there are many other factors that may result in famine or low farm production, such as a dry spell during a critical crop stage, crop varieties used and usage of fertilizer (Holden and Fisher Citation2015). Some consensus and some deviations appear when comparing our results to those of Munthali et al. (Citation2003), who also applied the SPI for drought detection in Malawi. There are, however, differences regarding the spatial extent (whole Malawi), the time period (1948–2003), and the time scale (one month instead of 12 months) applied to detect drought events that might explain the deviations.
The comparison between the two meteorological drought indices (SPI, SPEI) has shown that the indices detect comparable drought situations in terms of their spatial and temporal distribution for the period 1970 to 2013. This is to be expected since the indices are similar; the SPEI is based on the SPI but considers effects of PET in addition to rainfall variability. The fact that (a) the detected droughts based on the SPEI tend to be more severe and longer lasting than those based on the SPI, (b) the percentage of stations affected by droughts is higher for SPEI than for the SPI, and (c) the significantly decreasing trends in monthly and annual SPEI values are larger than the decreasing trends in SPI values highlights the particular role of PET on the water and energy budget in the study region. Given that Ngongondo et al. (Citation2015) found PET to increase in Malawi over a similar time period, it appears that meteorological droughts in the LMB and SRB are sensitive to an increase in evapotranspiration. For the evolution of droughts, this is particularly relevant, since over 70% of the water received in Lake Malawi is lost through evaporation (Kidd Citation1983, Drayton Citation1984, Neuland Citation1984). Still, rainfall (or rather the absence of rainfall) is the main driver of droughts, although the detected negative trends in rainfall were often insignificant both in this work and in former studies (e.g. Ngongondo et al. Citation2015).
5.2 On the link between meteorological and hydrological droughts
The newly proposed LLCI is able to identify hydrological droughts in LMB based on lake level variations, which reflect variations of the hydrological processes within the basin. Only one hydrological drought is detected for the period 1970–2013, but this single hydrological drought lasted for 101 months and led to low lake levels with considerably reduced outflow to the Shire River and hence a reduction in hydro-power production in the SRB. This highlights the sensitivity of hydro-power production in the SRB to the water and energy budget of the LMB. Regarding the link between meteorological and hydrological droughts, it is hardly possible to give general statements on the meteorological trigger mechanisms for the onset of hydrological droughts since only one long-lasting hydrological drought event has been identified for the study period. For this event, it requires frequent meteorological droughts of certain intensity (SPEI < −1) to trigger the onset of the hydrological drought. However, we were able to show that the response of the lake to meteorological drought situations is delayed by more than 24 months, and we assume that this is due to the attenuation effect of Lake Malawi given its large size and volume.
The purely data-driven relationship established between the SPEI36 and the LLCI has highlighted that the SPEI36 is a well-suited predictor for hydrological droughts 10 months in advance. This may provide essential information for preparedness and water management in the basin. The adaptation of a process-based hydrological model to the LMB would be desirable to account for and to better understand the hydrological (response) processes of the lake and within the basin area. This would also allow the validation of the established relationship between the SPEI36 and LLCI12.
5.3 Implications of future climate scenarios (for hydro-power production)
Projections on future climate scenarios for Malawi (based on CMIP5 global circulation models driven by the RCP8.5 emission scenario) consistently indicate further temperature increases by 2.5–5.5°C by 2100. The projections, however, highly disagree regarding the direction of changes in precipitation. Twelve models suggest an increase in precipitation by 4–28%; 16 models suggest that precipitation will likely decrease by 3–17% by 2100 (Climate and Development Knowledge Network Citation2017).
In turn, three possible modes of future climate change implications for the evolution of meteorological drought situations can be imagined. (1) Increasing temperature in combination with decreasing precipitation will most likely promote future drought situations. (2) Small changes in precipitation (including small increases) in combination with increasing temperatures will possibly lead to more severe droughts due to the sensitive role of evapotranspiration in drought generation in the LMB and SRB. (3) Despite increasing temperature, moderate to strong increases in precipitation will lead to less severe droughts due to an increase in net-positive water balances in the basins. It is important to point out that these scenarios represent average climate (change) conditions. Since severe meteorological droughts are random events, single extreme drought events (possibly even more extreme that the ones detected in 1990s) can occur in all three modes outlined above. Detailed scenario- and model-based analyses, including downscaling of the climate projections, would be needed to give more quantitative rather than these qualitative approximations.
The likely increase in future meteorological droughts will also have consequences for hydrological droughts and water management. The presumably increasing role of (lake) evaporation may strongly impact the water balance of Lake Malawi and its catchment such that water loss through lake evaporation will increase. Assuming only small changes in precipitation input, the outflow from Lake Malawi to the upper Shire River will further be reduced, and hydropower productivity will be considerably decreased. Given the importance of hydropower production on the Shire River for the energy supply in Malawi, this may have serious consequences for the energy security of the country. Detailed analyses regarding hydrological climate change impacts on streamflow and hydropower potential in the SRB are urgently needed to provide a basis for adaption strategies to ensure a secure energy supply in the future.
6 Conclusion
In this study we used two meteorological drought indices (SPI and SPEI) to detect meteorological drought dynamics in the Lake Malawi basin and upper Shire River basin, which is of key importance for the hydro-power generation and energy supply in Malawi. We also analysed trends in the meteorological drivers for droughts (changes in precipitation and temperature as a proxy for evaporation) to investigate the importance of these drivers for drought evolution in both basins. We further proposed the lake level change index (LLCI), which is based on lake level variations on Lake Malawi, to investigate hydrological droughts in this area. One particular goal of this study has been to explore the relationship between meteorological and hydrological droughts. Returning to the three overarching research questions for this study, we can draw the following main conclusions:
Significant increasing trends in temperature and (often insignificant) decreasing trends in precipitation agree with mostly significant increasing trends in drought conditions. The most severe drought situations occurred in the 1990s, which agrees with previous studies both for Malawi and for larger geographical extents. Only some drought parameters show some minor spatial patterns (comparatively longer duration in the south and higher frequencies in the west); otherwise, the detected trends in the hydro-meteorological drivers and drought indices are relatively homogeneous in spatial perspective.
The sensitive role of potential evapotranspiration for water resources in general and for drought situations in particular has been outlined for the Lake Malawi area. Still, rainfall deficits remain the main driver for the evolution of droughts. However, as temperature has significantly increased over the last few decades and future projections highly agree on further regional warming, the role of evapotranspiration might even amplify future drought conditions in the greater Lake Malawi area. This will have serious impacts on water resources and hydro-power productivity, and as such this should be a focus of future research activities.
There is no obvious direct link between meteorological droughts and hydrological droughts at a 12-month scale as they are defined within this study. Meteorological droughts are more frequent and shorter compared to hydrological droughts. In turn, not every meteorological drought triggers a hydrological drought, but the most severe meteorological droughts occur concurrently with hydrological droughts during their greatest intensity. The absence of a direct link between meteorological and hydrological droughts is presumably due to the compensation capacity of Lake Malawi. The study has revealed, however, that hydrological droughts at the 12-month scale (LLCI12) can be linked to meteorological droughts at the 36-month scale (SPEI36), and that the SPEI36 is able to reasonably predict the LLCI12 approximately 10 months in advance.
Acknowledgements
This work was supported by the part-time scholarship of the Potsdam Graduate School at University of Potsdam (UP), and additional funds from PhD students associated with the Research and Graduate School “Natural Hazards and Risks in a Changing World (NatRiskChange)” at UP. An important share of the meteorological data was provided by the Department of Climate Change and Meteorological Services, and the Department of Water Resources, Malawi. Finally, we would also like to thank the anonymous reviewers for their helpful comments.
Disclosure statement
No potential conflict of interest was reported by the authors.
Notes
References
- Babu, S.C. and Chapasuka, E., 1997. Mitigating the effects of drought through food security and nutrition monitoring: lessons from Malawi. Food and Nutrition Bulletin, 18 (1), 71–81. doi:10.1177/156482659701800106
- Bootsma, H.A. and Jorgensen, S.E., 2005. Lake Basin management initiative: experience and lessons learned briefs (on CD). Kusatsu, Japan: International Lake Environment Committee Foundation. Lake Malawi: Experience and Lessons Learned Brief, 259–276.
- Calder, I.R., et al., 1995. The impact of land use change on water resources in sub-Saharan Africa: a modelling study of Lake Malawi. Journal of Hydrology, 170 (1–4), 123–135. doi:10.1016/0022-1694(94)02679-6
- Calow, R.C., et al., 1997. Groundwater management in drought-prone areas of Africa. International Journal of Water Resources Development, 13 (2), 241–262. doi:10.1080/07900629749863
- Climate and Development Knowledge Network, 2017. Future climate for Africa-country climate projections for Malawi. Available from: http://www.lse.ac.uk/GranthamInstitute/wp-content/uploads/2017/10/2772_Malawi_Annex.pdf.
- Dayal, K.S., Deo, R.C., and Apan, A.A., 2018. Investigating drought duration-severity-intensity characteristics using the standardized precipitation-evapotranspiration index: case studies in drought-prone Southeast Queensland. Journal of Hydrologic Engineering, 23 (1), 05017029. ISSN 1084-0699.
- Denning, G., et al., 2009. Input subsidies to improve smallholder maize productivity in Malawi: toward an African green revolution. PLoS Biology, 7 (1), e1000023. doi:10.1371/journal.pbio.1000023
- Drayton, R.S., 1979. A study of the causes of the abnormally high levels of Lake Malawi in 1979. Malawi, Water Resources Division (WRD-No. TP.5), 46.
- Drayton, R.S., 1984. Variations in the level of Lake Malawi. Hydrological Sciences Journal, 29, 1–10. doi:10.1080/02626668409490918
- Duponchelle, F. and Ribbink, A.J., 2000. Fish Ecology report: Lake Malawi.
- ESCOM, no date. The effect of the current rainfall on water levels and electricity supply (generation). Available from: http://www.escom.mw/rainfall-effect-waterlevels.php [ Accessed 22 March 2017].
- Fisher, M., et al., 2015. Drought tolerant maize for farmer adaptation to drought in sub-Saharan Africa: determinants of adoption in eastern and southern Africa. Climatic Change, 133 (2), 283–299. doi:10.1007/s10584-015-1459-2
- GOM, 2010. Malawi electricity investment plan. Lilongwe, Malawi: Department of Energy Affairs, Lilongwe.
- Helsel, B.D. and Hirsch, R.M., 2002. Statistical methods in water resourcestechniques of water resources investigations. U.S. Geological Survey. http://water.usgs.gov/pubs/twri/twri4a3/.
- Helsel, D.R. and Frans, L.M., 2006. Regional Kendall test for trend. Environmental Science & Technology, 40 (13), 4066–4073. doi:10.1021/es051650b
- Holden, S.T. and Fisher, M., 2015. Subsidies promote use of drought tolerant maize varieties despite variable yield performance under smallholder environments in Malawi. Food Security, 7 (6), 1225–1238. doi:10.1007/s12571-015-0511-4
- Jury, M.R., 2014. Malawi’s shire river fluctuations and climate. Journal of Hydrometeorology, 15 (5), 2039–2049. doi:10.1175/JHM-D-13-0195.1
- Jury, M.R. and Gwazantini, M.E., 2002. Climate variability in Malawi, part 2: sensitivity and prediction of lake levels. International Journal of Climatology, 22 (11), 1303–1312. doi:10.1002/joc.772
- Kendall, M.G., 1975. Rank correlation methods. London: Charles Griffin.
- Kidd, C.H., 1983. A water resources evaluation of Lake Malawi and the Shire river. Geneva, Switzerland: World Meteorological Organisation.
- Libiseller, C. and Grimvall, A., 2002. Performance of partial Mann-Kendall tests for trend detection in the presence of covariates. Environmetrics, 13 (1), 71–84. doi:10.1002/env.507
- Makoka, D., 2008. The impact of drought on household vulnerability: the case of rural Malawi. Available from: http://mpra.ub.uni-muenchen.de/15399/.
- Mann, H.B., 1945. Nonparametric tests against trend. Econometrica, 13, 245–259. doi:10.2307/1907187
- Mckee, T.B., Doesken, N.J., and Kleist, J., 1993. The relationship of drought frequency and duration to time scales. In: Proceedings of the ninth conference on applied climatology. Boston: American Metereological Society, 179–184.
- Menon, R., 2007. Famine in Malawi: causes and consequences. UNDP. http://hdr.undp.org/sites/default/files/menon_roshni_2007a_malawi.pdf.
- Milleniun Challenge Corporation, 2015. Star Report Malawi. Washington, DC. Available from: https://www.mcc.gov/resources/pub-full/star-report-malawi [Accessed 7 August 2020].
- Mishra, A.K. and Singh, V.P., 2010. A review of drought concepts. Journal of Hydrology, Elsevier B.V., 391 (1–2), 202–216. doi:10.1016/j.jhydrol.2010.07.012
- Mtilatila, L., 2010. Seasonal prediction of summer rainfall in Southern Africa. Melboune, Australia: Monash University.
- Munthali, G., et al., 2003. Drought case study for Malawi. Blantyre, Malawi: Department of Meteorological Services.
- Neuland, H., 1984. Abnormal high water levels of Lake Malawi? — An attempt to assess the future behaviour of the lake water levels. Geo Journal, 9, 323–324.
- Ngongondo, C., et al., 2011. Evaluation of spatial and temporal characteristics of rainfall in Malawi: a case of data scarce region. Theoretical and Applied Climatology, 106 (1–2), 79–93. doi:10.1007/s00704-011-0413-0
- Ngongondo, C., et al., 2015. Observed and simulated changes in the water balance components over Malawi, during 1971–2000. Quaternary International, Elsevier Ltd, 369, 7–16. doi:10.1016/j.quaint.2014.06.028
- Palamuleni, L.G., Ndomba, P.M., and Annegarn, H.J., 2011. Evaluating land cover change and its impact on hydrological regime in Upper Shire river catchment, Malawi. Regional Environmental Change, 11 (4), 845–855. doi:10.1007/s10113-011-0220-2
- Pauw, K., et al., 2011. The economic costs of extreme weather events: a hydrometeorological CGE analysis for Malawi. Environment and Development Economics, 16, 177–198. doi:10.1017/S1355770X10000471
- Pohlert, T., 2017. Non-parametric trend tests and change-point detection. Available from: https://cran.r-project.org/web/packages/trend/trend.pdf.
- Rebetez, M., et al., 2006. Heat and drought 2003 in Europe: a climate synthesis. Annals of Forest Science, 63 (6), 569–577. doi:10.1051/forest:2006043
- Richard, Y., et al., 2001. 20th century droughts in Southern Africa: spatial and temporal variability, teleconnections with oceanic and atmospheric conditions. International Journal of Climatology, 21 (7), 873–885. doi:10.1002/joc.656
- Rouault, M. and Richard, Y., 2005. Intensity and spatial extent of droughts in southern Africa. Geophysical Research Letters, 32 (15), 2–5. doi:10.1029/2005GL022436
- Shela, O.N., 2000. Naturalisation of Lake Malawi levels and Shire River flows. In: Proceedings of the 1st WARFSA/WaterNet Symposium: Sustainable Use ofWater Resources, Maputo, Mozambique, 1–2 November, pp. 1–2.
- Shukla, S. and Wood, A.W., 2008. Use of a standardized runoff index for characterizing hydrologic drought. Geophysical Research Letters, 35 (2), 1–7. doi:10.1029/2007GL032487
- Spinoni, J., et al., 2014. World drought frequency, duration, and severity for 1951–2010. International Journal of Climatology, 34 (8), 2792–2804. doi:10.1002/joc.3875
- Syroka, J. and Nucifora, A., 2010. National drought insurance for Malawi. World, January. Available from: http://papers.ssrn.com/sol3/papers.cfm?abstract_id=1536982.
- Svoboda et al., 2012. Standardized Precipitation Index - user guide. WMO-No, 1090. Geneva: World Meteorological Organisation..
- Taulo, J.L., Gondwe, K.J., and Sebitosi, A.B., 2015. Energy supply in Malawi: options and issues. Journal of Energy in Southern Africa, 26 (2), 19–32. doi:10.17159/2413-3051/2015/v26i2a2192
- Thornthwaite, C., 1948. An approach toward a rational classification of climate. Geographical Review. doi:10.2307/210739
- Vicente-Serrano, S.M., Beguería, S., and López-Moreno, J., 2010. A multi-scalar drought index sensitive to global warming: the Standardized Precipitation Evapotranspiration Index - SPEI. Journal of Climate, 23, 1696–1718. doi:10.1175/2009JCLI2909.1
- Vogel, M.M., et al., 2019. Concurrent 2018 hot extremes across Northern Hemisphere due to human-induced climate change. Earth’s Future, 7 (7), 692–703. doi:10.1029/2019EF001189
- World Bank, 2017. Malawi Economic Monitor: harnessing the urban economy. Lilongwe, Malawi: World Bank. http://hdl.handle.net/10986/26763
- Zuzani, P.N., et al., 2019. Examining trends of hydro-meteorological extremes in the Shire River Basin in Malawi. Physics and Chemistry of the Earth, Elsevier, 112 (February), 91–102. doi:10.1016/j.pce.2019.02.007.