
 ?Mathematical formulae have been encoded as MathML and are displayed in this HTML version using MathJax in order to improve their display. Uncheck the box to turn MathJax off. This feature requires Javascript. Click on a formula to zoom.
ABSTRACT
A new probabilistic conceptual model, named the Assessment Model of Human Impact on Runoff Based on Stationarity Hypothesis (AMHIRBSH), was developed to attribute runoff variations to human activities through evaluating the changes in the runoff–runoff relationship (i.e. that between runoff of different watersheds). The AMHIRBSH was then applied to the Baiyangdian drainage basin, North China. After applying the Mann-Kendall test for trend and the Pettitt test for breakpoint, the runoff over the Baiyangdian drainage basin was shown to have had a breakpoint in approximately 1979, which split the time series into a baseline period (pre-1979) and an altered period (post-1979). The runoff was greatly reduced between these two periods. The runoff–runoff relationship of the Wangkuai and Xidayang sub-watersheds was evaluated using a copula function which showed it to have a non-stationarity degree of 35.64%, likely induced by massive afforestation programmes. This method provides an innovative perspective for attributing runoff variations to human activities.
Editor S. Archfield Associate editor K. Ryberg
1 Introduction
Both climate change and human activities can greatly alter hydrological processes and can subsequently have critical impacts on runoff variations (Tu et al. Citation2015, Yuan et al. Citation2016, Zhang et al. Citation2016, Paul et al. Citation2018). As human activities intensify, understanding the human contributions to runoff variation is important for developing adaptive water management (Milly et al. Citation2008, Wu et al. Citation2017, Liu et al. Citation2019, Paul et al. Citation2019). However, this has become a challenge due to the complicated interactions among human activity, climate and hydrology (Wang and Hejazi Citation2011, Jiang et al. Citation2015). Human activities can not only alter runoff directly by affecting the hydrological processes but also indirectly by disturbing the climate variables (Wang and Hejazi Citation2011). In this study, we use the term “human activities” to reflect direct human activities, including water withdrawal, land use and hydrologic constructions.
In recent years, numerous research studies have been carried out to separate the impacts of human activities from those of climate change on runoff variations (Wei and Zhang Citation2010, Velpuri and Senay Citation2013, Dey and Mishra Citation2017, Suttles et al. Citation2018, Zipper et al. Citation2018). Three categories of methods have generally been utilized worldwide: empirical statistics, elasticity-based methods and process-based methods. Empirical statistics, such as regression analyses, time-trend analyses and the double-mass curve method, separate human contributions to runoff variations based on the change in statistical relationships between runoff and relevant climatic drivers (e.g. precipitation) at different periods (Wang Citation2014, Zhao et al. Citation2014, Citation2015, Kong et al. Citation2016, Zhang et al. Citation2016). Elasticity-based methods, encompassing the nonparametric method and the Budyko framework, assess the runoff variations attributed to climate change and human activities using the elasticities of runoff to changes in precipitation and potential evapotranspiration (Ye et al. Citation2013, Mwangi et al. Citation2016, Wu et al. Citation2017, Liu et al. Citation2019). Process-based methods use physical hydrological models, such as the simple lumped conceptual daily rainfall–runoff model (SIMHYD) and the Soil & Water Assessment Tool (SWAT), to simulate runoff variations with changed land use or water utilization characteristics (Ahn and Merwade Citation2014, Xu et al. Citation2014, Zeng et al. Citation2015).
There are two main logical ways to estimate human impacts on runoff variations: (1) modelling the change in runoff under varied human activities using physical hydrological models, which is direct but requires time-consuming calibration and validation involving topography, vegetation, climate and hydrology (Wei and Zhang Citation2010, Bao et al. Citation2012, Wang et al. 2013, Xu et al. Citation2014); and (2) estimating human contributions by removing predicted climatic contributions to runoff, which are usually calculated using the climate–runoff relationship (Milly et al. Citation2008, Zhang et al. Citation2011). However, the watershed climate–runoff relationship is very complex, as it is non-linear, time-varying and uncertain, especially for extreme climatic variations such as high-intensity storms (Wang et al. Citation2014), which induces great challenges for estimating climatic and human contributions to runoff variations. Besides runoff data, therefore, a long time series of climatic data such as precipitation and temperature is also mandatory. However, these kinds of climatic data are not always available, especially for mountainous regions without gauging stations.
To overcome the limits discussed above, we put two adjacent sub-watersheds with similar natural backgrounds into one research system, so that the climate factors could be excluded. Then, we develope a new probabilistic conceptual model named the Assessment Model of Human Impact on Runoff Based on Stationarity Hypothesis (AMHIRBSH) to assess the contribution of human activities to runoff variations. This was accomplished by first identifying the baseline period and the altered period using the sequential Mann-Kendall (M-K) test and the Pettitt test, and then measuring human impacts on runoff by analysing the non-stationarity of the runoff–runoff relationship between the two periods, without climate data. This method can provide an innovative perspective on and approach to assessing the contribution of human activities to runoff variations without including the complex climate–runoff relationship. This method is especially useful in cases where climate data are scarce, such as in mountainous regions without gauging stations.
2 Methodology
2.1 Probabilistic conceptual model development
Stationarity – the idea that natural systems fluctuate within an unchanging envelope of variability – is a foundational concept that permeates training and practice in water-resource engineering (Milly et al. Citation2008). It implies that any single variable has a time-invariant marginal probability density function (marginal PDF), and any two related variables have a time-invariant joint probability density function (joint PDF) which depends on both the marginal PDF of the two variables and their specific relationship. Under stationarity, the relationship between two related variables is therefore also inferred to be time invariant, such as the climate-runoff relationship and runoff-sediment relationship for one basin as a system. Then, for two adjacent basins (e.g. basin S1 and basin S2), as a system themselves are supposed to have similar hydrological process changes (e.g. the trend, the approximate occurrence times of mutation points) with each other for similar climate changes. Thus, an assumption was made that the runoff–runoff relation of basins S1 and S2 is time invariant in natural systems, which we call the “runoff–runoff stationarity” assumption. As it is generally recognized that climate–runoff stationarity could be changed due to anthropogenic effects (Milly et al. Citation2008), we can separate anthropogenic effects from climatic effect on runoff variations by estimating the change in the climate–runoff relationship. Likewise, the question arises whether or not the runoff–runoff stationarity relationship will also be compromised into non-stationarity by human disturbances. The answer may provide a new perspective for assessing the contribution of human activities on runoff variations.
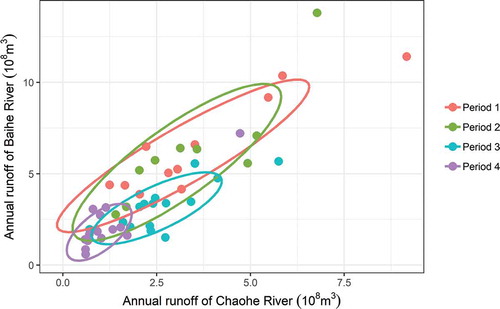
The previous study by Wang et al. (Citation2015) was utilized to verify whether the runoff–runoff stationarity would be compromised into non-stationarity by human disturbances. Wang et al. (Citation2015) adopted the double mass curve (DMC) method to identify the driving force of streamflow variations for the Chaohe and Baihe river catchments from 1963 to 2011. As the Chaohe and Baihe rivers are twin rivers, they have undergone similar climate conditions and similar streamflow regimes. With the segmented fitting method, the study period was separated into four periods based on different regressive slopes of DMCs over the entire study duration. The periods were defined as follows: Period 1: 1963–1973, the baseline period; Period 2: 1974–1982, the low-impact period fairly close to the baseline; Period 3: 1983–1997, the altered period proven to be dramatically affected by human activities; and Period 4: 1998–2011, the altered period proven to be affected by cumulative human activities.
We evaluated whether the stationarity of runoff–runoff relationships had been changed under human effects among the four periods in the observed records, based on the statistical ellipse model providing a simple and effectivity summary of a bivariate relation (Friendly et al. Citation2013, Polajzer et al. Citation2016). As shown in , with 80% confidence ellipses, the coverage area of Period 2 is fairly close to that of Period 1, indicating the presence of stationarity. In contrast, there were only small elliptical areas coincident with Period 1 for Period 3 as well as for Period 4, which indicates that their probability distributions had been changed greatly from the baseline period due to human activities, indicating non-stationarity. Hence, the above analysis clearly showed that stationarity would be compromised by human disturbances within areas such as the Chaobai River basin.
Figure 1. Joint distribution plot of annual runoff in the Baihe and Chaohe rivers in four periods between 1963 and 2011, proving that runoff–runoff stationarity will be compromised into non-stationarity if affected by human disturbances. Period 1: 1963–1973, the baseline period; Period 2: 1974–1982, the low-impact period fairly close to the baseline; Period 3: 1983–1997, the altered period proven to be dramatically affected by human activities; and Period 4: 1998–2011, the altered period proven to be affected by cumulative human activities (Wang et al., 2015)
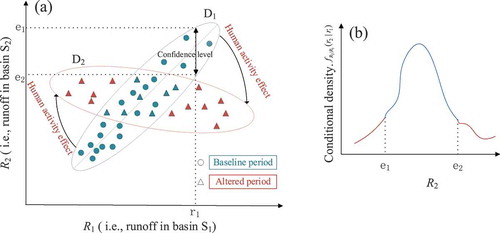
Following from the above conclusion, a probabilistic conceptual model based on the stationarity hypothesis (i.e. AMHIRBSH) can be established to separate the effects of human activity from those of climate change on runoff variations. As shown in ), the joint behaviour of R1 (i.e. the runoff in basin S1) and R2 (i.e. runoff in basin S2) is assumed to be in line with the joint distribution D1 within the baseline period, and it would probably alter from D1 to D2 if affected by human activities in the altered period. While R1 was given a certain value r1, the value of R2 (i.e. r2) fluctuated within a confidence interval from the minimum value e2 to maximum value e1 when subjected to deterministic stationary relationships and stochastic variations. This implies that R2 has a specific conditional probability density function (conditional PDF) when given R1, such as in ). Obviously, the conditional density of R2 given R1 (i.e. ) for any sample falling within the confidence interval is greater than that falling outside the confidence interval. In the baseline period, most runoff pairs obeying D1 distribution would fall within the confidence interval. In the altered period, however, due to anthropogenic effects some runoff pairs would probably fall outside the confidence interval. Obviously, the mean of
for samples from baseline period should be greater than that from altered period, providing a reasonable way to separate the impacts of human activities from those of climate change on runoff variations by analysing the difference of
between two periods. The degree of runoff–runoff variations can be expressed by the Human Contribution (HC) index:
Figure 2. The probabilistic conceptual model, Assessment Model of Human Impact on Runoff Based on Stationarity Hypothesis (AMHIRBSH), to separate the impacts of human activities from those of climate change on runoff variations: (a) example of the runoff–runoff relationship (expressed by the joint distribution) having changed from D1 to D2, affected by human activities; and (b) example of the conditional probability density function of R2 given R1 = r1.
where is the arithmetic mean of
for samples from the baseline period, while
is the arithmetic mean of
for samples from the altered period. Compared to
, the
is smaller and the HC is greater, indicating a stronger human contribution to runoff variations, and vice versa.
2.2 Framework and statistical methods for attributing runoff variations to human activities
Based on the AMHIRBSH, a framework consisting of three steps and corresponding statistical methods is shown in , to attribute runoff variations to human activities.
Figure 3. Framework for attributing human activities to runoff variations by using the probabilistic conceptual model
2.2.1 Identifying the baseline period and altered period
The M-K test (Yue et al. Citation2002) (see Appendix) was used to investigate the trend (i.e. increase or decrease) and degree of runoff variations. The Pettitt test (Pettitt Citation1979) (see Appendix) was then used to detect the breakpoint of the time series of runoff variations. Based on the breakpoint detection, the time series was split into two periods: the baseline period (pre-breakpoint) and the altered period (post-breakpoint). The baseline period was assumed to have negligible human activity while the altered period was assumed to have measurable effects from climate change and human activity on runoff variations.
2.2.2 Fitting natural joint distributions of runoff pairs in the baseline period
Copula functions (Nelsen Citation2006) were used to fit the joint distributions of runoff pairs (i.e. R1 and R2) in the baseline period. Copula functions provide a clear view of joint behaviours of multi-variables and allow for intuitive relationship analysis between variables. Over the past several years, copulas have been widely used in hydrology and published in many papers with detailed procedures (Wahl et al. Citation2015, Wang et al. Citation2017, Citation2018).
For two random variables (X and Y) with marginal cumulative distribution functions F(x) and F(y), Sklar’s theorem (Nelsen Citation2006) states that the joint cumulative distribution function (CDF) can be denoted by a copula function C as
Thus, the dependence structure between X and Y is well established. Assuming the marginal distributions are continuous with PDFs f(x) and f(y), the bivariate PDF related to the CDF is described as
The first step in fitting a copula is to construct the marginal distributions (i.e. U and V) by fitting the empirical distributions with the theoretical distributions, such as lognormal, normal, gamma and Weibull distributions. The fitted parameters of marginal distributions were estimated by the maximum likelihood method, and their goodness-of-fit tests were implemented using the Kolmogorov-Smirnov (K-S) test (Marsaglia et al. Citation2003).
With the identification of marginal probability distributions, their joint distributions can be directly developed by linking U and V through specific copula functions (i.e.). Thus, the runoff–runoff relationships embracing a non-linear relation and a tail dependence between two sub-watersheds in the baseline period could be effectively analysed with the joint distributions.
2.2.3 Attributing runoff variations to human activities by measuring the degree of change of the conditional density from the baseline period to the altered period
Based on the joint distributions developed in EquationEquation (2)(2)
(2) , the
(i.e. the conditional density of R2 given R1) of historical samples from the baseline period and the altered period were judged using the conditional PDF as:
where is the joint density of R1 and R2, which was estimated from the copula-based joint distribution, and
is the marginal density for R1, which was estimated from the marginal distribution of runoff in basin S1.
For two observed runoff sequences
in the baseline period and
in the altered period, two groups of conditional densities would be obtained as
and
. Then the HC index can be calculated following EquationEquation (1)
(1)
(1) to analyse the human impacts on runoff variations.
3 Study area and data acquisition
3.1 Study area
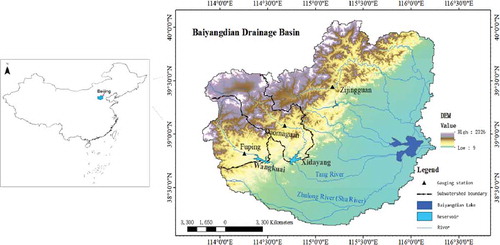
Baiyangdian drainage basin is located at 113°39′–116°12′E and 38°3′–40°4′N (). The basin encompasses an area of 31 200 km2, of which 53% occupies the western mountains and hills, with elevation of over 1000 m a.s.l., and 47% occupies the eastern alluvial plains, with elevation ranging from 10 to 100 m a.s.l. Within a semi-arid temperate continental monsoon climate, the basin receives an average annual precipitation of 548 mm, mostly in the summer (70–80%). There are nine tributaries into the Baiyangdian Lake, which is known as the largest wetland in North China, playing an important role in maintaining regional ecosystem functions such as retaining water and sustaining the biodiversity of the area.
Figure 4. Location of the Baiyangdian drainage basin, North China
In recent decades, however, the Baiyangdian drainage basin has undergone a substantial decrease in runoff. Since the 1950s, the annual average temperature in the Baiyangdian drainage basin has increased by approximately 0.4–1.2°C/10 years, while the annual average precipitation has declined by 22.91 mm/10 years (Gao et al. Citation2009). More than 150 reservoirs were built along the nine tributaries after 1958. Affected by such climate change and human activities, the upper streamflow and downstream water inflow into the Baiyangdian Lake have both dramatically decreased, resulting in a decreased water level and increased dried-up frequency of Baiyangdian Lake. Baiyangdian Lake dried up only once during the period 1919–1965, while it dried up frequently during 1965–2002 (Hu et al. Citation2012). The drought of Baiyangdian Lake was generally recognized as a cause of the continuous decline in ecological functions followed by various eco-environmental problems (Hu et al. Citation2012, Li et al. Citation2014). Therefore, identifying the role of human activities in runoff variations in Baiyangdian drainage basin is very important for water resource management and ecological restoration.
The rivers Tang and Zhulong are two of the main tributaries into Baiyangdian Lake. Xidayang sub-watershed (4420 km2) and Wangkuai sub-watershed (3770 km2), respectively located in the upper Tang River catchment and Zhulong River catchment, are critical areas for making this attribution. The two sub-watersheds are close to each other and thus have similar climate conditions. Xidayang sub-watershed has an annual average temperature of 12.1°C and an annual average precipitation of 530–660 mm/year, while Wangkuai sub-watershed has an annual average temperature of 12.5°C and an annual average precipitation of 536–745 mm/year.
3.2 Data acquisition
The total annual runoff of three hydrologic gauging stations located in the Upper Sha River, the Tang River and the Juma River, i.e. Fuping, Daomaguan and Zijingguan stations, respectively (shown in ), and the annual inflow into Baiyangdian Lake were used to analyse the trends and breakpoints of runoff over the Baiyangdian drainage basin. Then the annual runoff in the Xidayang and Wangkuai sub-watersheds was used to attribute runoff variations to human activities in the Baiyangdian drainage basin. These data were collected or calculated from the Hydrological Yearbook of the Haihe River basin (Ministry of Water Resources of the P.R.China Citation2012).
The data processes of breakpoint detection, copula function establishment and conditional density calculation were carried out using R software, and the corresponding packages are described in the Appendix.
4 Results
4.1 Hydrological trends and breakpoints
In previous studies, the breakpoint of runoff in Baiyangdian drainage basin was found to occur in approximately 1980 (Liu et al. Citation2011, Hu et al. Citation2012). Here, the Pettitt test was utilized to identify breakpoints of runoff for Baiyangdian drainage basin and three typical stations (Fuping, Daomaguan and Zijingguan). The results showed that the four long-term runoff series all had breakpoints at a 5% significance level (see ), and three of them occurred in approximately 1979, when abrupt change was most likely to occur, except for Daomaguan Station where it occurred in approximately 1982.
Table 1. Pettitt test results and mean of runoff series in the baseline and altered periods
As the Pettitt test has been found to be sensitive to monotonic trends and might determine a breakpoint in what is really a series with an up (or down) gradual trend (Busuioc and von Storch Citation1996, Ryberg et al. Citation2020), monotonic trends across the Baiyangdian watershed were also analysed with the M-K test. As shown in , the observed annual runoff levels of the three typical hydrologic gauging stations during 1960 to 2002 all display a significant (5% significance level) decreasing trend. In contrast, when the M-K test was used for two periods (i.e. 1960–1979 and 1980–2002), the annual runoff series all showed insignificant decreasing trends, in Baiyangdian drainage basin and the three stations. This indicates that the Pettitt test was not influenced by monotonic trends.
Figure 5. Trends (1960–2002) of annual runoff in typical hydrologic gauging stations in the Baiyangdian drainage basin. The grey band shows the 95% confidence interval of the LOESS smoothing (in R software) for runoff
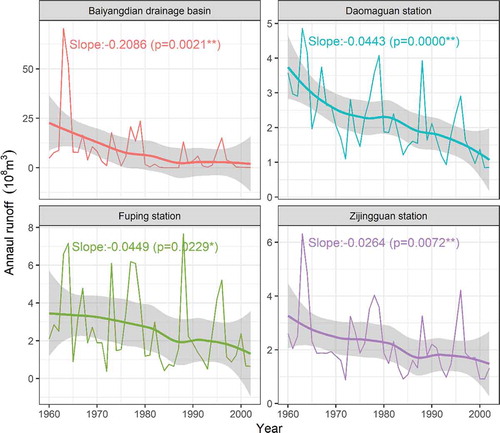
Consequently, in this study, the runoff series over the basin was recognized as experiencing an abrupt change in 1979. Thus, the runoff series was divided into two periods, the baseline period (i.e. pre-1979) and the altered period (i.e. post-1979). Compared to the baseline period, the average annual runoff in the altered period decreased by 81.4%, 44.5%, 38.7% and 34.3% for Baiyangdian drainage basin, Fuping Station, Daomaguan Station and Zijingguan Station, respectively. Further analysis is necessary to determine the contribution of human activities to this reduction in runoff.
4.2 Joint distribution of runoff pairs in Xidayang and Wangkuai sub-watersheds
4.2.1 Marginal probability distribution of runoff pairs
The historical annual runoff datasets for Wangkuai and Xidayang sub-watersheds were denoted WR and XR, respectively, for convenience. The marginal distributions of WR and XR were selected from a pool of four distributions commonly used in hydrology: lognormal, normal, gamma and Weibull. The parameters estimated using the maximum-likelihood method and the corresponding goodness-of-fit test results are presented in .
Table 2. Goodness-of-fit tests for the marginal distributions of runoff pairs. The underlined values are the best distributions of runoff in the specified site. AIC: Akaike information criterion; D: Kolmogorov’s goodness-of-fit statistic
The Akaike information criterion (AIC; Honjo et al. Citation1994) was used to assess the goodness-of-fit of candidate distributions. Lower AIC values indicate better fit for a given set of data; given this, the best marginal distribution for WR is the Weibull distribution. The Kolmogorov-Smirnov (K-S) test was used for the goodness-of-fit test. The K-S statistic is 0.1, with a p value of 0.94, which indicates insufficient evidence to reject the null hypothesis at α = 0.1. Therefore, the marginal distribution of WR can be assumed to follow the Weibull distribution. Likewise, the marginal distribution of XR can be assumed to follow the lognormal distribution, due to the minimum AIC value and K-S test of not rejecting the null hypothesis with a p value of 0.99.
4.2.2 Joint probability distribution of runoff pairs
A strong dependence between WR and XR was first verified (with a Pearson correlation coefficient of 0.94, a Kendall correlation coefficient of 0.72 and a Spearman correlation coefficient of 0.89), which demonstrated the potential of using copula functions. Five well-known and commonly used copula functions in hydrology – two elliptical copula families (the Gaussian copula and Student’s copula) and three Archimedean copula families (the Clayton copula, the Frank copula and the Gumbel copula) (Wang et al. Citation2017, Jhong et al. Citation2018, Pandey et al. Citation2018) – were selected as candidates to fit the joint probability distributions of runoff pairs in the baseline period. The results of parameters fitted using the maximum-likelihood method and goodness-of-fit test following Kojadinovic et al. (Citation2011) are shown in . Among the five copulas, the Gumbel copula (specializing in upper tail dependence) was recognized, due to its small AIC value, as the best model to effectively present the dependence structure of runoff pairs. The joint probability distribution is given as:
Table 3. Goodness-of-fit tests for joint probability distributions of the runoff pairs. AIC: Akaike information criterion; Sn: von Cramér’s goodness-of-fit statistic
where u represents the marginal CDFs of the Weibull distribution with a shape parameter of 1.33 and a scale parameter of 7.17, while ν represents the marginal CDFs of the lognormal distribution with a mean of 1.48 and a standard deviation of 0.64.
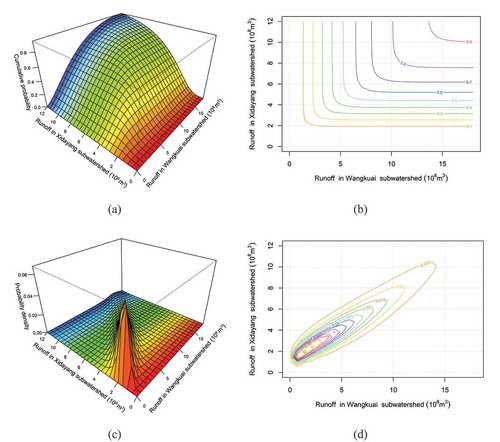
The cumulative probability distributions are presented in ) and ). It can be seen that there was a probability of approximately 90% of runoff occurring in a range from 1 to 18 × 108 m3 for Wangkuai sub-watershed and from 2 to 12 × 108 m3 for Xidayang sub-watershed. The cumulative probability values of runoff pairs are dependent on one another. For example, the maximum value of the cumulative probability was only approximately 40% when the runoff in Wangkuai sub-watershed was 4.5 × 10⁸ m3 or the runoff in Xidayang sub-watershed was 3.8 × 10⁸ m3. According to ) and ), the probability density at co-low or co-high values of runoff pairs was relatively higher than that at low-high values, indicating a positive correlation of runoff in Wangkuai and Xidayang sub-watersheds.
Figure 6. Joint probability distributions for annual runoff in the Wangkuai sub-watershed and the Xidayang sub-watershed. (a) and (b) are the cumulative probability distributions; (c) and (d) are the probability densities of distributions
4.3 Attributing runoff variations to human activities
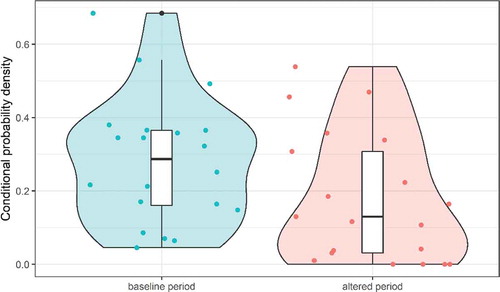
With the joint distribution function developed in Section 4.2, the conditional densities of XR given WR (i.e. ) in the baseline period and altered period were calculated. shows that the maximum and minimum values of
in the altered period (i.e.
) were both less than those in the baseline period (i.e.
), and that
occurring at a maximum frequency was close to 0.05, while
was close to 0.35. The one-tailed Student’s test (Ruxton and Neuhäuser Citation2010) was applied to test the null hypothesis that the
had a mean less than
. The results show values of t = 1.7929 and p = 0.04015, which is strong evidence against the null hypothesis. In other words, with 95% confidence, the runoff variations were significantly affected by human activities.
Figure 7. Scatter plots and violin plots of the conditional densities of XR (annual runoff in Xidayang sub-watershed) given WR (annual runoff in Wangkuai sub-watershed) in the baseline and altered periods. The two layers are: (i) mapped points (scatter plot) of the conditional densities of XR given WR (i.e. ), and (ii) the compact display (violin plot) of the entire distribution of
the median, interquartile range and lower/upper adjacent values are also given
To further measure the degree of human contribution to runoff variations, the HC index was calculated following EquationEquation (1)(1)
(1) . It equalled 0.3564 when the mean of
changed from 0.2823 in the baseline period to 0.1817 in the altered period. This indicates a non-stationarity degree of 35.64% in the runoff–runoff relationship before and after 1979, suggesting that human activities contributed to runoff variations.
In addition, according to the probability theory (Fitelson and Hájek Citation2017), generally , indicating that different results may be introduced with varied antecedents. Therefore, we additionally verified the case of
to make the conclusion more robust. The results led to the same conclusion of human activities significantly contributing to runoff variations, with t = 1.987 and p = 0.02744. The non-stationarity degree of the runoff–runoff relationship was 45.85%.
5 Discussion
5.1 Model validation
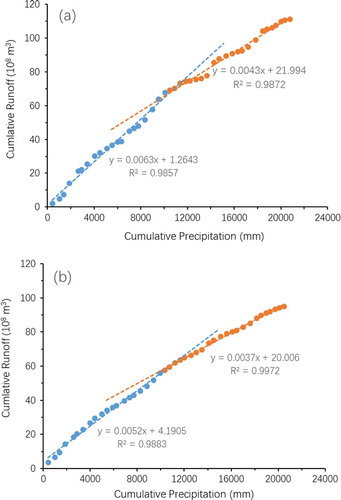
A commonly used method, the double mass curve (DMC) method, was used to verify whether runoff variations in Baiyangdian watershed were significantly affected by human activities. The results of segmented linear fitting of cumulative precipitation and runoff () show that the ratio of runoff to precipitation followed a notable downward trend from the baseline period to the altered period in both Wangkuai and Xidayang sub-watersheds. This indicates that the runoff was influenced by human activities, which is consistent with the conclusion obtained by the AMHIRBSH method.
Figure 8. Double mass curve (DMC) of annual precipitation and runoff for the period 1960–2002 in (a) Wangkuai sub-watershed and (b) Xidayang sub-watershed, showing the linear regression of cumulative precipitation and runoff in the baseline period (blue) and altered period (orange)
5.2 Land-use change and its impact on runoff decline
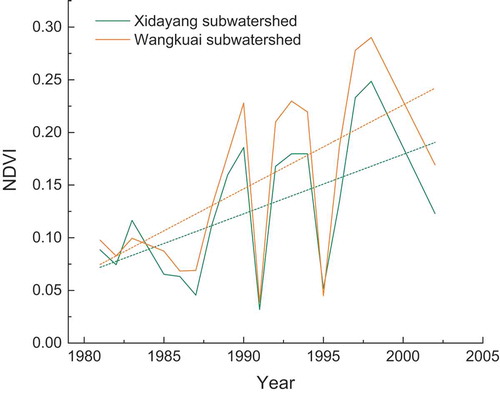
Identifying the impacts of specific human activity on runoff decline is important for water resource management. According to previous studies (Wang et al. Citation2009, Ma et al. Citation2010, Xu et al. Citation2014), land-use change is probably the main human activity that can be attributed to runoff decline in North China, where massive afforestation programmes were launched in the beginning of the 1980s. Fu (Citation2010) identified the land-use changes in five sub-basins of Baiyangdian drainage basin, and their results showed a decrease in farmland and an increase in forest and grassland since 1980. Using Landsat Multispectral Scanner (MSS) data and Landsat Thematic Mapper (TM) data, we identified the temporal variations of the normalized difference vegetation index (NDVI) obtained every May within Xidayang and Wangkuai sub-watersheds, respectively (see ). Since 1981, the NDVI in Xidayang sub-watershed showed a positive trend of 0.0057/year, and that in Wangkuai sub-watershed also showed a positive trend, of 0.0080/year, indicating the forest biomass had increased.
Figure 9. Variations of the normalized difference vegetation index (NDVI) in the Xidayang and Wangkuai sub-watersheds
To verify whether such afforestation had increased evapotranspiration and thus resulted in decreased runoff in the upper reservoir catchment, we applied the Budyko framework (Budyko Citation1974) to estimate the effect of increasing forest biomass on evapotranspiration, following Jaramillo et al. (Citation2018). To eliminate infrastructure influence on runoff, hydrometeorological data from Daomaguan Station, located in the Upper Xidayang Reservoir catchment, and Fuping Station, located in the Upper Wangkuai Reservoir catchment, being far from irrigation areas and uncontrolled by any great reservoir, were used to identify possible forest-related effects on evapotranspiration. The meteorological data for precipitation and temperature were downloaded from the Climatic Research Unit Database (CRU TS 2.1) of the Consortium of Spatial Information of the Consultative Group on International Agricultural Research (CGIAR-CSI; Mitchell and Jones Citation2005). Based on previous studies (Budyko Citation1974, Zhang et al. Citation2001, Jaramillo et al. Citation2013, Citation2018), the actual evapotranspiration (AET) is estimated using a water balance method, as shown in EquationEquation (7)(7)
(7) , assuming there is no annual water storage change, and the climate-driven AET (i.e.
) is estimated using EquationEquation (8)
(8)
(8) . As such, the residual effect on evaporative ratio between the baseline and altered periods,
, is calculated using EquationEquation (9)
(9)
(9) .
where P is precipitation, Q is runoff, PET is potential evapotranspiration. A positive can be an indicator of the effect of afforestation on the AET (Jaramillo et al. Citation2018). The results showed that the residual effect on the evaporative ratio (EquationEquation 9
(9)
(9) ) was 0.07664 and 0.02864 in Daomaguan and Fuping, respectively, indicating the increased vegetation as a result of afforestation programmes contributed to increased evapotranspiration and thus to decreased runoff.
5.3 Applications and implications of AMHIRBSH
The AMHIRBSH was used to correlate human activities with runoff variations through testing the non-stationarity of the runoff–runoff relationship. Although it cannot directly quantify the specific contribution of human activities, such as land use and hydrologic constructions, on runoff variations, without further analysis as described in Section 5.2, it can be used as an alternative tool to detect the degree of influence of human activities on runoff without considering climate change. This benefits those areas where climate data are difficult to obtain. In addition, the current climate data in some areas are mainly obtained by interpolation algorithms based on neighbouring meteorological data, which is possibly inconsistent with actual changes. In such a case, AMHIRBSH can be used as a supplement to other methods to ensure more accurate results.
More importantly, AMHIRBSH provides us with a new perspective for identifying the impact of human activities on runoff or other factors with respect to water resources or ecology, by analysing changes in the relationship among natural internal elements within the surface system. This is conducive to revealing the human-induced changes within the entire system (including variables and their relationships), rather than just a single variable, which may be more instructive for sustainable water resources management.
6 Conclusions
This study proposed a stationarity hypothesis in which the runoff–runoff relationship of two adjacent sub-watersheds was time invariant within a natural system. Statistical ellipse analysis of 49 years of runoff records observed in the Miyun Reservoir basin showed that a stationary system could be changed to non-stationary if affected by human activities. Based on this, a probabilistic conceptual model (AMHIRBSH) was established to correlate human activities with runoff variations. This was accomplished by analysing the non-stationarity degree (quantified by the HC index) of the runoff–runoff relationship between a baseline period and an altered period, without climate data. This method provides a new perspective for correlating human activities with runoff variations, especially relevant to mountainous areas that lack climate data.
Our application of AMHIRBSH in the Baiyangdian drainage basin indicated a significant reduction in runoff beginning in the 1980s. The degree of non-stationarity of the runoff–runoff relationship was 35.64% between the baseline and altered periods, suggesting that there was a human contribution to the decrease in runoff. With further analysis of changes in evapotranspiration, the specific human activity was identified as being probably related to the massive afforestation programmes conducted in North China since the 1980s, which resulted in increased evapotranspiration and decreased runoff.
Disclosure statement
No potential conflict of interest was reported by the authors.
Additional information
Funding
References
- Ahn, K.H. and Merwade, V., 2014. Quantifying the relative impact of climate and human activities on streamflow. Journal of Hydrology, 515, 257–266. doi:10.1016/j.jhydrol.2014.04.062
- Bao, Z., et al., 2012. Attribution for decreasing streamflow of the Haihe River basin, northern China: climate variability or human activities? Journal of Hydrology, 460–461, 117–129. doi:10.1016/j.jhydrol.2012.06.054
- Budyko, M.I., 1974. Climate and life. New York: Academic Press.
- Busuioc, A. and von Storch, H.V., 1996. Changes in the winter precipitation in Romania and its relation to the large-scale circulation. Tellus, 48 (4), 538–552. doi:10.1034/j.1600-0870.1996.t01-3-00004.x
- Dey, P. and Mishra, A., 2017. Separating the impacts of climate change and human activitieson streamflow: a review of methodologies and critical assumptions. Journal of Hydrology, 548, 278–290. doi:10.1016/j.jhydrol.2017.03.014
- Fitelson, B.A. and Hájek, 2017. Declarations of independence. Synthese, 194 (10), 3979–3995. doi:10.1007/s11229-014-0559-2
- Friendly, M., Monette, G., and Fox, J., 2013. Elliptic insights: understanding statistical methods through elliptical geometry. Statistical Science, 28, 1–39. doi:10.1214/12-STS402
- Fu, J., 2010. Study on the effects of land-use change on flood in Daqinghe River Bain. Thesis(PhD). Tianjing University. (in Chinese).
- Gao, Y., Wang, H., and Long, D., 2009. Changes in hydrological conditions and the eco-environmental problems in Baiyangdian watershed. Resources Science, 31, 1506–1513. (in chinese). Available from: http://en.cnki.com.cn/Article_en/CJFDTOTAL-ZRZY200909010.htm
- Honjo, Y., Liu, W.T., and Sakajo, S., 1994. Application of akaike information criterion statistics to geotechnical inverse analysis - the extended bayesian method. Structural Safety, 14, 5–29. doi:10.1016/0167-4730(94)90004-3
- Hu, S., et al., 2012. Assessing the impacts of climate variability and human activities on streamflow in the water’ source area of Baiyangdian Lake. Journal of Geographical Sciences, 22, 895–905. doi:10.1007/s11442-012-0971-9
- Jaramillo, F., et al., 2013. Multimethod assessment of evapotranspiration shifts due to non-irrigated agricultural development in sweden. Journal of Hydrology, 484, 55–62. doi:10.1016/j.jhydrol.2013.01.010
- Jaramillo, F., et al., 2018. Dominant effect of increasing forest biomass on evapotranspiration: interpretations of movement in Budyko space. Hydrology and Earth System Sciences, 22, 567–580. doi:10.5194/hess-22-567-2018
- Jhong, B.C., Tung, C.P., and Tsakiris, G., 2018. Evaluating future joint probability of precipitation extremes with a copula-based assessing approach in climate change. Water Resources Management, 32, 4253–4274. doi:10.1007/s11269-018-2045-y
- Jiang, C., et al., 2015. Separating the impacts of climate change and human activities on runoff using the Budyko-type equations with time-varying parameters. Journal of Hydrology, 522, 326–338. doi:10.1016/j.jhydrol.2014.12.060
- Kojadinovic, I., Yan, J., and Holmes, M., 2011. Fast large-sample goodness-of-t tests for copulas. Statistica Sinica, 21, 841–871. Available from: www.jstor.org/stable/24309543
- Kong, D., et al., 2016. Impactassessment of climate change and humanactivities on net runoff in the Yellow River Basin from 1951 to 2012. Ecological Engineering, 91, 566–573. doi:10.1016/j.ecoleng.2016.02.023
- Li, J., Feng, P., and Chen, F., 2014. Effects of land use change on flood characteristics in mountainous area of Daqinghe watershed, China. Natural Hazards, 70, 593–607. doi:10.1007/s11069-013-0830-8
- Liu, J.J., et al., 2019. A new approach to separating the impacts of climate change and multiple human activities on water cycle processes based on a distributed hydrological model. Journal of Hydrology, 578, 1–13. doi:10.1016/j.jhydrol.2019.124096
- Liu, M., Gao, Y., and Gan, G., 2011. Long-term trends in annual runoff and the impact of meteorological factors in the Baiyangdian watershed. Resources Science, 33, 1438–1445.
- Ma, H., et al., 2010. Impact of climate variability and human activity on streamflow decrease in the Miyun Reservoir catchment. Journal of Hydrology, 389 (3–4), 317–324. doi:10.1016/j.jhydrol.2010.06.010
- Marsaglia, G., Tsang, W.W., and Wang, J.B., 2003. Evaluating Kolmogorov’s Distribution. Journal of Statistical Software, 8, 1–4. doi:10.18637/jss.v008.i18
- Milly, P.C.D., et al., 2008. Stationarity is dead: whither water management? Science, 319, 573–574. doi:10.1126/science.1151915
- Ministry of Water Resources of the P.R.China, 2012. Hydrological data of Haihe River Basin. Annual hydrological report, Beijing, China.
- Mitchell, T. and Jones, P., 2005. An improved method of constructing a database of monthly climate observations and associated high-resolution grids RID C-8718-2009. International Journal of Climatology, 25(6), 693–712. doi:10.1002/joc.1181
- Mwangi, H.M., et al., 2016. Relative contribution of land use change and climate variability on discharge of upper Mara River, Kenya. Journal of Hydrology Regional Studies, 5, 244–260. doi:10.1016/j.ejrh.2015.12.059
- Nelsen, R.B., 2006. An introduction to copulas (Springer Series in Statistics). New York: Springer.
- Pandey, P.K., et al., 2018. Modelling of interdependence between rainfall and temperature using copula. Modeling Earth Systems and Environment, 4 (2), 867–879. doi:10.1007/s40808-018-0454-9
- Paul, S.S., et al., 2018. Application of object oriented image classification and Markov Chain Modeling for Land Use and Land Covet change analysis. Journal of Environmental Informatics, 31 (1), 30–40. doi:10.3808/jei.201700368
- Paul, S.S., et al., 2019. Assessing land use–land cover change and soil erosion potential using a combined approach through remote sensing, RUSLE and random forest algorithm. Geocarto International, 1–13. doi:10.1080/10106049.2019.1614099
- Pettitt, A.N., 1979. A non-parametric approach to the change-point problem. Journal of the Royal Statistical Society, 28, 126–135. doi:10.2307/2346729
- Polajzer, B., Brezovnik, R., and Ritonja, J., 2016. Evaluation of load frequency control performance based on standard deviational ellipses. IEEE Transactions on Power Systems, 32, 2296–2304. Available from: https://ieeexplore.ieee.org/stamp/stamp.jsp?arnumber=7560610
- Ruxton, G.D. and Neuhäuser, M., 2010. When should we use one-tailed hypothesis testing? Methods in Ecology & Evolution, 1, 114–117. doi:10.1111/j.2041-210X.2010.00014.x
- Ryberg, K.R., Hodgkins, G.A., and Dudley, R.W., 2020. Change points in annual peak streamflows—Method comparisons and historical change points in the United States. Journal of Hydrology, 583, 124307. doi:10.1016/j.jhydrol.2019.124307
- Suttles, K.M., et al., 2018. Assessment of hydrologic vulnerability to urbanization and climate change in a rapidly changing watershed in the Southeast US. Science of the Total Environment, 645, 806–816. doi:10.1016/j.scitotenv.2018.06.287
- Tu, X., et al., 2015. Intra-annual distribution of streamflow and individual impacts of climate change and human activities in the Dongijang River Basin, China. Water Resources Management, 29, 2677–2695. doi:10.1007/s11269-015-0963-5
- Velpuri, N.M. and Senay, G.B., 2013. Analysis of long-term trends (1950–2009) in precipitation, runoff and runoff coefficient in major urban watersheds in the United States. Environmental Research Letters, 8, 24020–24026. doi:10.1088/1748-9326/8/2/024020
- Wahl, T., et al., 2015. Increasing risk of compound flooding from storm surge and rainfall for major US cities. Nature Climate Change, 5, 1093–1097. doi:10.1038/NCLIMATE2736
- Wang, D. and Hejazi, M., 2011. Quantifying the relative contribution of the climate and direct human impacts on mean annual streamflow in the contiguous United States. Water Resources Research, 47, 411. doi:10.1029/2010WR010283
- Wang, G., Xia, J., and Chen, J., 2009. Quantification of effects of climate variations and human activities on runoff by a monthly water balance model: a case study of the Chaobai River basin in northern China. Water Resources Research, 45, W00A11. doi:10.1029/2007WR006768
- Wang, W., et al., 2013. Quantitative assessment of the impact of climate variability and human activities on runoff changes: a case study in four catchments of the Haihe River basin, China. Hydrological Processes, 27, 1158–1174. doi:10.1002/hyp.9299
- Wang, W., et al., 2018. Two-dimension monthly river flow simulation using hierarchical network-copula conditional models. Water Resources Management, 32, 3801–3820. doi:10.1007/s11269-018-1968-7
- Wang, X., et al., 2014. Trend and extreme occurrence of precipitation in a mid-latitude Eurasian steppe watershed at various time scales. Hydrological Processes, 28, 5547–5560. doi:10.1002/hyp.10054
- Wang, X., et al., 2015. Variation analysis of streamflow and ecological flow for the twin rivers of the Miyun Reservoir Basin in northern China from 1963 to 2011. Science of the Total Environment, 536, 739–749. doi:10.1016/j.scitotenv.2015.07.088
- Wang, X., et al., 2017. Identifying priority management intervals of discharge and TN/TP concentration with copula analysis for Miyun Reservoir inflows, North China. Science of the Total Environment, 609, 1258. doi:10.1016/j.scitotenv.2017.07.135
- Wang, X.X., 2014. Advances in separating effects of climate variability and human activity on stream discharge: an overview. Advances in Water Resources, 71, 209–218. doi:10.1016/j.advwatres.2014.06.007
- Wang, Y., et al., 2013b. Contributions of climate and human activities to changes in runoff of the Yellow and Yangtze rivers from 1950 to 2008. Science China-Earth Sciences, 56, 1398–1412. doi:10.1007/s11430-012-4505-1
- Wei, C. and Zhang, M., 2010. Quantifying streamflow change caused by forest disturbance at a large spatial scale: a single watershed study. Water Resources Research, 46, W12525. doi:10.1029/2010WR009250
- Wu, J., et al., 2017. Detecting the quantitative hydrological response to changes in climate and human activities. Science of the Total Environment, 586, 328–337. doi:10.1016/j.scitotenv.2017.02.010
- Xu, X., et al., 2014. Attribution analysis based on the Budyko hypothesis for detecting the dominant cause of runoff decline in Haihe basin. Journal of Hydrology, 510, 530–540. doi:10.1016/j.jhydrol.2013.12.052
- Ye, X.C., et al., 2013. Distinguishing the relative impacts of climate change and humanactivities on variation of streamflow in the Poyang Lake catchment,China. Journal of Hydrology, 494, 83–95. doi:10.1016/j.jhydrol.2013.04.036
- Yuan, Y., et al., 2016. Quantitative assessment of the contribution of climate variability and human activity to streamflow alteration in Dongting Lake, China. Hydrological Processes, 30, 1929–1939. doi:10.1002/hyp.10768
- Yue, S., et al., 2002. The influence of autocorrelation on the ability to detect trend in hydrological series. Hydrological Processes, 16, 1807–1829. doi:10.1002/hyp.1095
- Zeng, S., et al., 2015. Effects of climate change and human activities on surface runoff in the Luan River Basin. Advances in Meteorology, 2015, 1–12. doi:10.1155/2015/740239
- Zhang, L., Dawes, W.R., and Walker, G.R., 2001. Response of mean annual evapotranspiration to vegetation changes at catchment scale. Water Resources Research, 37, 701–708. doi:10.1029/2000WR900325
- Zhang, Q., et al., 2016. Evaluation of impacts of climate change and human activities on streamflow in the Poyang Lake basin, China. Hydrological Processes, 30, 2562–2576. doi:10.1002/hyp.10814
- Zhang, Z.X., et al., 2011. Evaluating the non-stationary relationship between precipitation and streamflow in Nine Major Basins of China during the past 50 years. Journal of Hydrology, 409, 81–93. doi:10.1016/j.jhydrol.2011.07.041
- Zhao, G.J., et al., 2014. Quantifying the impact of climate variability and human activities on streamflow in the middle reaches of the Yellow River basin. China. Journal of Hydrology, 519, 387–398. doi:10.1016/j.advwatres.2014.06.007
- Zhao, Y.F., et al., 2015. Quantifying the anthropogenic and climatic contributions to changes in water discharge and sediment load into the sea: a case study of the Yangtze River, China. Science of the Total Environment, 536, 803–812. doi:10.1016/j.scitotenv.2015.07.119
- Zipper, S.C., et al., 2018. Continuous separation of land use and climate effects on the past and future water balance. Journal of Hydrology, 565, 106–122. doi:10.1016/j.jhydrol.2018.08.022
Appendix
Mann-Kendall test
The trend assessment of hydrometeorological variables (i.e. precipitation, temperature and runoff) was carried out using the popular nonparametric Mann-Kendall (M-K) test (Yue et al. Citation2002). For time series samples , the null hypothesis is that the samples are independent and identically distributed, and the alternative hypothesis of a two-sided test is that the samples are not distributed identically. The M-K test statistic S obeying normal distribution is given by:
The mean and variance of S are given by:
where tm is the number of ties of extant m. Next, the standardized test statistic Z is computed by:
The null hypothesis will be rejected when |Z| ≥ Z1-α/2 is satisfied with a significance level of α, which indicates a significant increasing or decreasing trend for the time series. A positive Z value indicates an increasing trend, while a negative Z value shows a negative trend.
Pettitt test
The breakpoint in the annual runoff time series between the baseline period and the altered period was defined using the nonparametric Pettitt test (Pettitt Citation1979). For a sequence of random variables divided into two groups represented by x1, …, xt and xt+1, …, xn, the null hypothesis is that they are from the same population with no changing point, whereas the alternative hypothesis is that each group has its corresponding common distribution function, and the breakpoint is defined at t. The test statistic is given by:
The test statistic counts the number of times the value of a member of the first group exceeds the value of a member of the second group. The most probable breakpoint is found by the statistic k(t):
and the associated probabilities used in significance testing are given as
The null hypothesis will be rejected if the value of p is smaller than that of the specific significance level.
Data process in R software
The M-K test was implemented using “tfpwmk” in the R package “modifiedmk,” and the breakpoint detection was implemented using “pettitt.test” in the R package “trend.” Two R packages were used to build a copula function. The first package, “fitdistrplus,” helps to fit a parametric univariate distribution to a given dataset, and in this way the marginal distributions of runoff pairs were obtained. In the second package, “copula,” the “mvdc” function helps to construct bivariate distributions given their margins. Next, the probability density functions and cumulative distribution functions of the bivariate distributions can be easily attained using the functions “dmvdc” and “pmvdc,” respectively. The function “gofCopula” helps to carry out the goodness-of-fit test. In addition, the function “selectedCopula” in package “VineCopula” can also be used for a fast selection of the best copula. These R packages are freely available at the Comprehensive R Archive Network (cran.r-project.org).