
 ?Mathematical formulae have been encoded as MathML and are displayed in this HTML version using MathJax in order to improve their display. Uncheck the box to turn MathJax off. This feature requires Javascript. Click on a formula to zoom.
ABSTRACT
Quantitative assessment of dam-break flood hazard is central in dam emergency action planning and is typically performed deterministically. In structural failure of concrete or masonry dams the collapse is assumed to be total and instantaneous, with the reservoir level at the spillway crest level. A probabilistic method is here proposed based on a set of dam-break scenarios characterized by different breach widths and reservoir levels in order to provide an appraisal of uncertainties in flood hazard indicators. Each scenario is attributed a weight, defined as a conditional probability given a dam-break event. Probabilistic flood hazard and inundation maps are produced for the case study of the hypothetical collapse of the Mignano dam (River Arda, northern Italy), and a sampling-based global sensitivity analysis is performed. Dam-break flooding was simulated using a two-dimensional hydrodynamic model on a high-resolution mesh. The probabilistic maps inherently provide quantitative information on the uncertainty of dam-break flood hazard.
Editor S. Archfield; Associate Editor T. Heckmann
1 Introduction
Dams provide many benefits given the many possible uses of the retained water. However, the storage of large volumes of water poses a serious risk to the safety of the population, environment, properties and infrastructures located downstream. Indeed, large areas, sometimes with high exposure, can be flooded with catastrophic consequences due to the uncontrolled release of water resulting from an accident, or the partial or total collapse of a dam. Dam safety and dam-break flood hazard assessment have become widespread and topical issues given the increasing number of dams built to cope with the rapid growth in global water demand (Saxena and Sharma Citation2004, Zarfl et al. Citation2015). Although a dam-break event is quite rare (Hinks et al. Citation2015), the non-negligible number of historical dam disasters documented (e.g. International Commission on Large Dams Citation1995, Zhang et al. Citation2016, Aureli et al. Citation2021) indicates that this catastrophic event cannot be excluded.
Dam-break inundation studies are essential for flood risk management, emergency response planning and preparedness, and development of flood mitigation measures to minimize loss of life and property damage (Rodrigues et al. Citation2002, Viseu and Betâmio de Almeida Citation2009, Albano et al. Citation2019). Accordingly, dam safety guidelines and technical regulations adopted by several governments and national agencies require dam owners to perform dam-break analyses to prepare emergency action plans (EAPs) and provide dam hazard potential classifications (e.g. Australian National Committee on Large Dams Citation2012, Federal Emergency Management Agency Citation2013, Directive of the Italian Prime Minister 08.07.2014 Citation2014, New Zealand Society on Large Dams Citation2015, Indian Central Water Commission Citation2018).
A key step in evaluating the potential consequences of a hypothetical dam-break event is flood hazard and inundation zone mapping, which consists in identifying the expected inundation extent and representing the spatial variability of relevant flooding intensity variables (e.g. Department for Environment, Food and Rural Affairs Citation2006, Qi and Altinakar Citation2012, New Zealand Society on Large Dams Citation2015, Abdulrahman et al. Citation2022). To this end, the event-based approach is usually adopted in current engineering practice because of its simplicity.
The event-based approach is a deterministic method based on a single or very few credible dam-break scenarios characterized by fixed breach parameters (breach size, breaching time, etc.) and hydrological conditions (reservoir level and inflow conditions) for all possible failure mechanisms. The values of the breach parameters often derive from expert judgement or empirical models estimated from historical data (Wahl Citation2004, Froehlich Citation2008, Ahmadisharaf et al. Citation2016). Focusing on concrete and masonry dams, the prescribed dam-break scenarios typically are the most catastrophic ones (resulting in conservative inundation maps), characterized by a total and instantaneous collapse of the dam with the reservoir level at either the spillway crest level under normal (“sunny day”) inflow conditions, or the maximum storage/dam crest level under flood (“rainy day”) inflow conditions (e.g. Federal Emergency Management Agency Citation2013, New Zealand Society on Large Dams Citation2015).
However, the evaluation of uncertainties from different sources is crucial in flood risk assessment analyses (Teng et al. Citation2017, Beven et al. Citation2018, Bates Citation2022), including dam-breaks (Qi and Altinakar Citation2012), to orient future planning efforts. Uncertainties in initial hydrological conditions, breach and inundation model structure and parameters, and topographic data ought to be considered to quantify how uncertainty propagates via the inundation hydrodynamic model and to calculate uncertainty ranges for the output flood hazard parameters (Ahmadisharaf et al. Citation2013, Dewals et al. Citation2014, Tsai et al. Citation2019, Willis et al. Citation2019, Abdedou et al. Citation2020, Bellos et al. Citation2020, Kalinina et al. Citation2020). Probabilistic methods are useful for this purpose because they provide quantitative information about result uncertainty by considering a variety of preselected scenarios with associated weights (Mazzoleni et al. Citation2014) or probabilities (D’Oria et al. Citation2019), or scenarios obtained by randomly sampling the relevant input parameters according to their empirical or hypothesized probability distributions (e.g. Domeneghetti et al. Citation2013). The latter approach, based on the Monte Carlo method, is currently widely used in dam-break studies (Tsai et al. Citation2019, Abdedou et al. Citation2020, El Bilali et al. Citation2022, Sarchani and Koutroulis Citation2022). The statistical analysis of the hydrodynamic model results yields probabilistic flood inundation and hazard maps, currently a standard in hazard analyses of riverine flooding (Smemoe et al. Citation2007, Jung and Merwade Citation2012, Beven et al. Citation2015) or levee breach-induced flooding (Vorogushyn et al. Citation2010, Domeneghetti et al. Citation2013, Mazzoleni et al. Citation2014, Ahmadisharaf et al. Citation2018, D’Oria et al. Citation2019, Maranzoni et al. Citation2022), but much less in the context of dam-break flooding analyses.
In this paper, the method of preselecting scenarios and evaluating associated probabilities is extended to probabilistic dam-break flood inundation and hazard mapping, with a focus on the structural failure of concrete or masonry dams. This failure mode usually occurs with the collapse of the entire structure or a portion of it in a very short time (US Army Corps of Engineers Citation2014, New Zealand Society on Large Dams Citation2015, Indian Central Water Commission Citation2018). Preselected dam-break scenarios are characterized by different reservoir levels (and, consequently, stored water volumes) and breach widths. A scenario probability is a conditional probability, defined as the possibility that, in the event of a dam-break, it will occur with the initial conditions and breach parameters of that specific scenario. Reservoir level and breach size are expected to be the most relevant factors influencing the breach outflow hydrograph (Wahl Citation2004).
Closely related to uncertainty assessment, sensitivity analysis aims to quantify the influence of selected relevant input parameters on the variability of output quantities (Norton Citation2015, Pianosi et al. Citation2016). It can be a tool of interest to managers, planners, and stakeholders for flood risk management, as well as to model users and developers for uncertainty reduction of flood inundation models (Hall et al. Citation2005, Pappenberger et al. Citation2006, Citation2008, Bellos et al. Citation2020). The sensitivity analysis can add insights into the features of dam-break flooding, allowing: (1) the recognition of the most influential input parameters in determining changes in the output variables; (2) the identification of the intervals of the input factors where the outputs are more sensitive; and (3) the delimitation of the areas where the flood hazard is most sensitive to each relevant input. This paper shows how sensitivity maps can provide this useful information.
Probabilistic dam-break flood hazard assessment and sampling-based global sensitivity analysis are performed here for the case study of the hypothetical collapse of the Mignano dam, a concrete gravity dam located on the upper reach of the River Arda in northern Italy.
2 Case study
The Mignano dam is a concrete gravity structure with a curved planimetric profile built between 1926 and 1933, mainly for irrigation purposes. It is 51 m high (from the natural thalweg of the watercourse at the downstream face of the dam) and 341 m long at the crest (at the elevation of 342 m a.s.l.). The reservoir capacity is approximately 15 million m3 at the maximum storage level of 340.5 m a.s.l. (Italian Association of the Electricity Distribution Companies Citation1953). The catchment area at the dam site is 87 km2, and the estimated 1000-year return period flood peak is 800 m3/s. A frontal uncontrolled overflow structure ensures the safe passage of this design flood. The spillway is divided into eight 10.5 m long stretches with the crest at 337.8 m a.s.l.
The collapse of the Mignano dam would have catastrophic consequences in the valley and floodplain downstream. Indeed, many natural and historical sites are present downstream of the dam, as well as agricultural and manufacturing activities. Moreover, urban areas (Lugagnano Val d’Arda and Castell’Arquato in the central/lower portion of the Arda Valley, and Fiorenzuola d’Arda in the floodplain) and transport infrastructures (a railway and a highway of supra-regional and national importance, respectively) are at risk of flooding ().
Figure 1. Location and aerial view of the study area; highlighted are the River Arda (tributary of the River Po), the main urban areas (A: Lugagnano Val d’Arda; B: Castell’Arquato; and C: Fiorenzuola d’Arda) and transport infrastructures, and the computational domain. Bottom right inset: historical view of the Mignano dam and reservoir (from Italian Association of the Electricity Distribution Companies Citation1953).
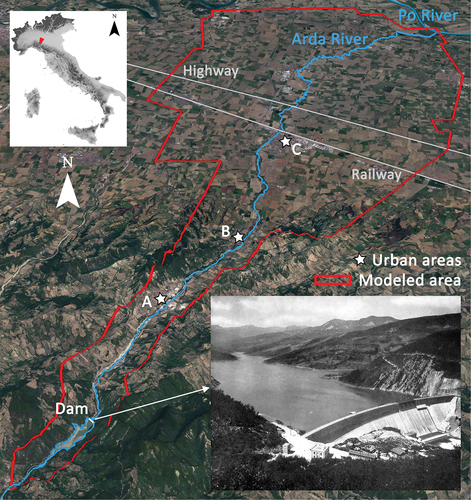
The dam-break flood would be confined laterally by the sides of the valley along the mountain stretch of the River Arda. After spreading in the floodplain, the flooding wave would be limited downstream by the right-side levee of the River Po.
3 Probabilistic method and application
3.1 Flood hazard classification
Various hazard level classifications are currently adopted in flood hazard studies by national regulatory agencies and researchers (Maranzoni et al. Citation2023). They are based on flood hazard indicators (quantifying flooding intensity) and sometimes on the return period of the flood event. Classifications based on flooding intensity only can be used in dam-break flood analyses (e.g. Ahmadisharaf et al. Citation2013, Álvarez et al. Citation2017, Patra et al. Citation2019).
Common flood hazard indicators are the flood inundation depth (Quiroga et al. Citation2016, Ongdas et al. Citation2020), the flow velocity (Kreibich et al. Citation2009), the flooding arrival time, the duration of the flooding, the rate of water depth rise (Merz et al. Citation2007), the product of flow velocity and inundation depth (considered a good indicator of human stability in flood situations; Abt et al. Citation1989), and the total force (defined as the sum of pressure force and momentum; Aureli et al. Citation2008).
The flood hazard classification suggested for people by the UK Department for Environment, Food and Rural Affairs (Citation2006) is used in this work due to its wide application in flood risk management (e.g. van Alphen and Passchier Citation2007, D’Oria et al. Citation2019, Willis et al. Citation2019). It is based on the flood hazard index:
where h is the flood depth (in m), v is the magnitude of the flow velocity (in m/s), and DF is a debris factor. In the absence of debris (DF = 0), flood hazard for people is categorized into four hazard levels as shown in (Wade et al. Citation2005, Department for Environment, Food and Rural Affairs Citation2006).
Table 1. Flood hazard classification (for people, in the absence of debris) according to the UK Department for Environment, Food and Rural Affairs (Citation2006).
3.2 Hydrodynamic model
The dam-break flooding was simulated by a hydrodynamic model parallelized on graphics processing units (GPUs) that solves the conservative form of the two-dimensional shallow water equations on Block Uniform Quadtree (BUQ) multi-resolution structured grids using an explicit second-order accurate Godunov-type finite volume scheme (Vacondio et al. Citation2014, Citation2017).
Thanks to the BUQ grid, the spatial resolution can be increased locally where a more detailed topographic description is needed (such as in urban areas or near topographic singularities). Starting from a 2 m × 2 m Cartesian mesh based on lidar data, a BUQ grid was obtained with cell size progressively increasing from 2 m to 16 m by a factor of 2. The smallest cells were used to describe the course of the river. Areas near the main transport infrastructures were discretized with computational cells of slightly greater size (4 m). A lower resolution (cell sizes of 8 and 16 m) was used in the highest part of the valley sides and large flat areas of the floodplain.
Friction losses were evaluated via the classic Manning formula by selecting the values of the Manning roughness coefficient on the basis of expert knowledge and experimental evidence (Chow Citation1959). Three homogeneous zones were defined: the watercourse, the hillslopes of the valley together with the floodplain, and the urban areas together with the main extra-urban roads. Values of the Manning coefficient ranging from 0.033 to 0.083 m–1/3s were adopted along the watercourse, depending on the river conditions. The value of 0.05 m–1/3s was used on the sides of the valley and in the floodplain. The Manning coefficient was reduced to 0.02 m–1/3s in the urban areas and along the main roads.
The propagation of the dam-break wave was simulated for a physical time of 4 h from the instantaneous collapse of the dam since the dam-break wave attenuates considerably after this time. The computational time of a simulation run was approximately 20 h on average on a K40 Tesla GPU.
3.3 Probabilistic flood hazard mapping
3.3.1 Dam-break scenarios
Dam-break flood hazard studies require the definition of credible dam-break scenarios by specifying initial hydrological conditions and breach characteristics.
Regarding the initial conditions, guidelines and technical rules adopted by national agencies worldwide suggest considering two failure modes: the “sunny day” failure and the “rainy day” failure (e.g. Federal Emergency Management Agency Citation2013, New Zealand Society on Large Dams Citation2015, Indian Central Water Commission Citation2018). However, only the “sunny day” failure is usually considered in deterministic analyses of dam-break floods due to the structural failure of concrete and masonry dams. Indeed, the collapse of such dams is assumed not to be induced by hydrological events (e.g. Circular from the Italian Prime Minister 13.12.1995, n. DSTN/2/22806 Citation1995). Accordingly, in the “sunny day” failure the reservoir is assumed to be full at the spillway crest level, and both inflow into the reservoir and streamflow conditions in the downstream watercourse are neglected. Moreover, dam-break consequences may be more serious in “sunny day” rather than in “rainy day” conditions due to the potential higher exposure of threatened communities (New Zealand Society on Large Dams Citation2015).
Regarding dam breach mechanisms and characteristics, historical events indicate that concrete arch and gravity dams fail very quickly, thus inducing more severe flooding than embankment dams with comparable height and reservoir capacity (Zhang et al. Citation2016). Therefore, it is common practice to assume a very rapid (on the order of a few minutes) or even instantaneous collapse of a concrete dam (MacDonald and Langridge-Monopolis Citation1984, International Commission on Large Dams Citation1998). Accordingly, the failure time can be confidently considered a deterministic parameter. Moreover, again based on historical records, concrete arch dams tend to fail completely, while concrete gravity dams tend to break partially, with the loss of one or several of the highest monolith sections (Federal Emergency Management Agency Citation2013, Zhang et al. Citation2016). In the latter case, the breach width is assumed to be at least 30% of the dam crest length, depending on the expected dam performance and potential failure mechanisms (Circular from the Italian Prime Minister 13.12.1995, n. DSTN/2/22806 Citation1995, Veale and Davison Citation2013, New Zealand Society on Large Dams Citation2015). However, the dam collapse is usually assumed to be total for precautionary reasons. The breach sides are typically vertical (US Army Corps of Engineers Citation2014, New Zealand Society on Large Dams Citation2015, Indian Central Water Commission Citation2018), hence the side slopes of the breach can be treated as deterministic parameters. Erosion of the foundations and valley sides is usually neglected. Accordingly, breach depth and width do not exceed dam height and length, respectively.
For the reasons above only the reservoir level (which fixes the water volume stored behind the dam) and the breach width are considered uncertain in this paper. The space of the uncertain input parameters is discretized by dividing the variability range of the input parameters into classes, and the upper value of each class is assumed to represent the class in the definition of the dam-break scenarios. A set of dam-break scenarios Si,j can then be defined by combining NH reservoir levels (Hi, i = 0, …, ) with NL breach widths (Lj, j = 0, …,
) (). Index i increases with decreasing levels. Higher j values correspond to narrow breaches.
Figure 2. (a) Definition of the dam-break scenarios in the space of the input parameters (reservoir level H and breach width L). (b) Empirical frequency histogram obtained from the analysis of databases concerning historical dam-break events of concrete and masonry dams (four uniform dimensionless breach width classes are considered). (c) Cumulative frequency function of daily water levels measured in the Mignano reservoir from 1934 to 2019.
Five reservoir levels (NH = 5) and four breach widths (NL = 4) were considered in the case study of the Mignano dam (). The levels selected include the maximum reservoir level, the spillway crest level, and the first civil protection alert level associated with the passage of a flood. The breach width range was divided into four uniform intervals, having upper values of ,
,
, and
, where
is the dam crest length. Accordingly, scenarios Si,0 are total collapse scenarios, and S1,0 is the “sunny day” total failure scenario, which is taken as a reference since it is usually considered in deterministic dam-break flood hazard analyses.
Table 2. Dam-break scenarios for the Mignano dam case study.
3.3.2 Scenario probabilities
Probability Pi,j associated with the () scenario is defined as the conditional probability that, given dam-break event B, it will occur according to scenario Si,j that is
Accordingly, the sum of the scenario probabilities is 1.
Assuming that breach width and reservoir level are independent parameters, the joint probability rule for independent events ensures that
The conditional probability that, given the dam-break event, it will occur with a breach width in the range from Lj+1 to Lj (regardless of the water level in the reservoir), was calculated from historical dam-break data (). Various databases available in the literature were consulted (Bartholomew Citation1989, Douglas et al. Citation1999, Foster et al. Citation2000, Vogel et al. Citation2004, Zhang et al. Citation2009, Citation2016, Veale and Davison Citation2013), focusing on 40 well-documented failures of concrete and masonry dams.
The conditional probability , i.e. the probability that the reservoir level is within the range [
] (regardless of the breach width) given the dam-break event, could not be calculated as an empirical relative frequency due to the substantial lack of historical data concerning the reservoir water level at the time of the dam-break. However, the joint probability rule for dependent events yields
where is the joint probability that a dam-break occurs and the water level falls into the range [Hi+1, Hi], while P(B) denotes the marginal (e.g. annual) probability of a dam-break event. This marginal probability depends on both failure mechanism and dam type, and can be assessed according to various methodologies (e.g. Baecher et al. Citation1980, Fell et al. Citation2000, Hinks et al. Citation2015). Similarly, the same joint probability can be expressed as
where p(H) is the marginal probability density function of water level H, and P(B|H) is the conditional probability of the dam-break event for a given loading water level H. This conditional probability can be provided by fragility functions, which are used in various engineering contexts to describe the reliability of a defence structure for a selected failure mechanism (e.g. Hall et al. Citation2003, Dawson et al. Citation2005). Such functions can also be obtained for dams (e.g. Ellingwood and Tekie Citation2001, Hariri-Ardebili and Saouma Citation2016). The comparison of EquationEquations (4)(4)
(4) and (Equation5
(5)
(5) ) yields
If the occurrence of a dam-break event does not depend on the water level behind the dam (as, for example, in the case of an act of sabotage or terrorist attack or a catastrophic earthquake of exceptional intensity), P(B|H) equals P(B). Hence, EquationEquation (6)(6)
(6) reduces to
where is the unconditional (e.g. annual) probability that the reservoir level falls within the range [Hi+1, Hi]. In the case study the dam failure was assumed to be independent of the reservoir level, for simplicity. Accordingly,
was obtained from the empirical cumulative frequency function of the reservoir water levels (). Predictions of forecast models can be used when hydrometric data are unavailable (for example, for planned dams).
reports the probabilities calculated according to EquationEquation (2)(2)
(2) for the dam-break scenarios considered in the Mignano case study.
Table 3. Probabilities of the dam-break scenarios for the Mignano dam case study.
3.3.3 Probabilistic inundation extent map
The probabilistic inundation extent map displays the spatial distribution of the probability of inundation in the event of a dam-break, thereby inherently providing information on the uncertainty in flood inundation extent (e.g. Smemoe et al. Citation2007, Vorogushyn et al. Citation2010, Beven et al. Citation2015, D’Oria et al. Citation2019).
This map originates from the combination of the inundation probability maps of all dam-break scenarios. For each () scenario, the inundation probability map assigns the following variable to each location (
) in the study area:
The probabilistic inundation extent map is then obtained by summing the Ai,j contributions over the dam-break scenarios at each location:
with Pin being the inundation probability. The areas flooded with a given probability in the event of a dam-break can easily be identified on this map (). In particular, the areas where the inundation probability is equal to 1 will surely be flooded in the event of a dam-break. Conversely, the inundation probability is zero in the areas that can confidently be expected will never be flooded.
Figure 3. (a) Probabilistic inundation extent map. (b) Flooded areas for the reference scenario (S1,0) superimposed on the envelope of the inundation extent of all scenarios.
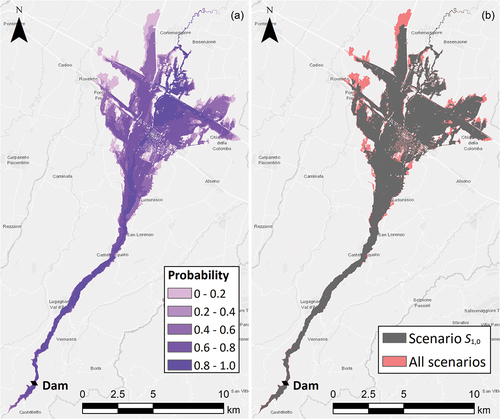
shows that the dam-break flow resulting from a hypothetical failure of the Mignano dam would most likely sweep the Arda Valley and the areas adjacent to the watercourse in the floodplain. The region flooded in all scenarios (Pin = 1) is 20.8% of the total inundation extent. In the floodplain the inundation probability decreases towards the edges of the flooded area, where only the most severe scenarios lead to flooding. compares the total inundation extent obtained with the probabilistic method (i.e. the envelope of the inundation extents of all scenarios) with that of reference scenario S1,0 (for the same simulation time). The envelope inundation zone is slightly larger than the flooded area of the reference scenario because the probabilistic method includes a more severe scenario (S0,0) than the reference one.
3.3.4 Probabilistic flood hazard maps
The results of uncertainty analyses of flood hazard can be presented through maps showing the spatial distribution of the likelihood of selected flood hazard classes (D’Oria et al. Citation2019, Maranzoni et al. Citation2022). The probability that, in the event of a dam-break, the kth hazard class (with k = 0, 1, …, 4, according to the classification shown in ) occurs at location () is
where
and HCi,j is the hazard class predicted locally in the () scenario.
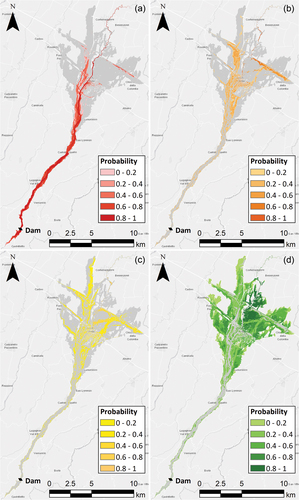
shows the probabilistic flood hazard level maps for the case study considered. The highest (extreme) flood hazard occurs with high probability along the Arda Valley and the watercourse in the floodplain (). Significant or moderate flood hazard occurs with high probability mainly along the embankments of the infrastructures, which act as barriers to the flow ( and ). Low hazard mainly occurs in the alluvial fan and downstream floodplain and, with low probability, near the boundaries of the flooded area along the valley (). It is worth noting that a given location can fall into different flood hazard classes with different probabilities (which must sum to 1, including the probability of the residual hazard level).
Figure 4. Probabilistic flood hazard maps for the four hazard levels defined in the Department for Environment, Food and Rural Affairs (Citation2006) classification: (a) extreme (HC = 4); (b) significant (HC = 3); (c) moderate (HC = 2); (d) low (HC = 1). The grey shading indicates the predicted inundation zone. In each location, the probability of the residual flood hazard level (HC = 0) is the complement to 1 of the total probability of the four levels.
An effective way of summarizing the probabilistic flood hazard information providing a general inference about an “expected” flood hazard is to build a probabilistic weight-averaged flood hazard map (e.g. Di Baldassarre et al. Citation2009, Mazzoleni et al. Citation2014). For each location, this map provides the weighted average of the HR values calculated for each dam-break scenario, with the weights being the corresponding scenario probabilities:
The spatial distribution of the probability-averaged flood hazard for the Mignano dam-break case study is shown in . Applying the flood hazard classification of the UK Department for Environment, Food and Rural Affairs (Citation2006) to , four hours after the dam failure, 68.5% of the total flooded area (approximately 58 km2) falls into the low hazard class, 8.3% into the moderate hazard class, 7.5% into the significant hazard class, and 15.7% into the extreme hazard class. The main urban areas are subject to extreme or significant average flood hazard.
Figure 5. Probabilistic flood hazard maps: (a) probability-weighted average of flood hazard index HR (colours refer to the four hazard levels defined by the Department for Environment, Food and Rural Affairs Citation2006); (b) relative coefficient of variation rCV of the flood hazard index, which provides a measure of the uncertainty in the average flood hazard estimation. Stars indicate the main urban areas potentially exposed to flooding.
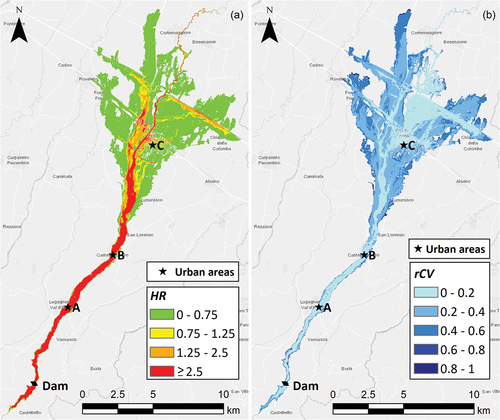
The uncertainty in the local “expected” flood hazard can be expressed by a measure of the dispersion of HR (e.g. Chow et al. Citation1988). A relative coefficient of variation (ranging between 0 and 1) is used in this paper (e.g. Martin and Gray Citation1971):
where is the total number of dam-break scenarios considered, and σHR is the standard deviation of HR calculated as
shows the map of rCV for the case study analysed. Flood hazard uncertainty increases when moving from the river towards the boundaries of the flooded area and as the inundation probability decreases. The flood hazard prediction is affected by relatively low uncertainty in the main urban areas.
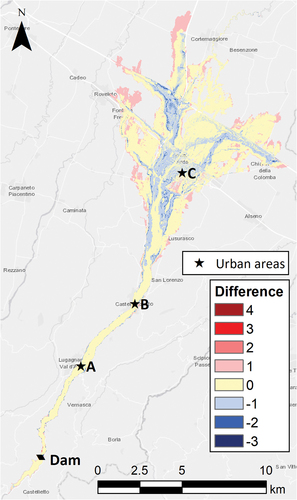
The comparison in shows that the “expected” flood hazard level map and the hazard level map for the reference scenario return the same flood hazard class for a large portion (67.4%) of the flooded area. The absolute difference is less than or equal to 1 in most of the flooded area. Where the two flood hazard level predictions are different, the “expected” hazard level predicted through the probabilistic method is higher than the one calculated through the deterministic method in 36.8% of cases; the opposite occurs in 63.2% of cases.
Figure 6. Difference between flood hazard levels derived from the probability-averaged flood hazard index map and hazard levels calculated for the reference scenario (S1,0).
3.3.5 Probabilistic arrival time maps
The flood hazard classification reported in (Department for Environment, Food and Rural Affairs Citation2006) does not include the flood arrival time as a relevant variable. However, although dam-break floods are typically very rapid, the wave arrival time is of primary interest for early warning and evacuation plans, and hence is often considered in dam-break flooding studies (e.g. El Bilali et al. Citation2022, Sarchani and Koutroulis Citation2022). Thus, the flood arrival time is here considered an additional hazard parameter.
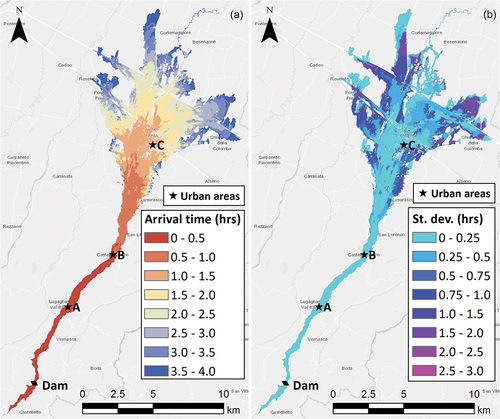
The probabilistic map of the “expected” flood arrival time () illustrates the spatial distribution of the probability-averaged dam-break wave arrival time, which is calculated as
Figure 7. Probabilistic flood arrival time maps: (a) probability-weighted average of the dam-break wave arrival time; (b) standard deviation of the arrival time.
where Tarr denotes the flood arrival time, Ai,j is defined as in EquationEquation (8)(8)
(8) , and the normalized weights Ai,j/Pin (ranging from 0 to 1 and summing to 1) are computed considering only the (
) scenarios that induce flooding in the (
) location. The probability-averaged arrival time tends to infinity in the areas never reached by flooding (where the inundation probability is zero). Uncertainty in the predicted flood arrival time is represented by the map of the standard deviation of the arrival time (), which is defined as
shows that the whole valley is swept by the dam-break wave in approximately 30 min with very low uncertainty. The standard deviation of the arrival time is higher in the floodplain than in the valley; in the floodplain it tends to increase when moving towards the boundaries of the flooded area. However, low uncertainty in the arrival time occurs in border areas along the long-term flooding directions. These areas are reached by flooding only in the most catastrophic scenarios for the simulation time considered.
compares the flood hazard levels and arrival times predicted through the probabilistic method with the ones calculated through the deterministic method for the main urban areas.
Table 4. Flood hazard levels and arrival times for three urban areas (A, B and C in ): comparison of the predictions by the probabilistic and deterministic methods. E[HC] indicates the “expected” hazard class obtained from the probability-weighted average of the flood hazard index HR.
4 Sensitivity analysis
Pseudo-local (in multiple specified intervals of the input factors) and global (over the entire variability space of the input factors) sensitivity analyses were performed using the same set of dam-break scenarios as in the probabilistic uncertainty analysis. One input factor was varied at a time (reservoir level or breach width). The peak breach outflow, the maximum inundation extent, and the spatial distributions of the flood hazard index and dam-break wave arrival time were considered relevant model outputs.
The dimensionless sensitivity of a scalar output variable Y to the kth input factor Xk (k = 1, …, K) over the mth interval (for fixed values of the other
input factors) can be approximated by finite differences as (e.g. Norton Citation2015, Pianosi et al. Citation2016):
where ΔYm is the change in Y resulting from the variation of the Xk-input factor within the
-interval, and Xk,m/Ym is a scaling factor calculated at a reference point belonging to the interval (e.g. the upper value). The dimensionless form of the sensitivity index allows comparing the sensitivity of output variables having different physical dimensions.
Based on the discretization of the two-dimensional (K = 2) input variability space according to the dam-break scenarios defined in , the variations of the reservoir level and of the breach width
were used to calculate the pseudo-local sensitivities. In the assessment of sensitivity to the reservoir level, the scaling factor was calculated by using the level above the thalweg of the watercourse at the downstream face of the dam.
According to the Elementary Effect Test (EET) method (Morris Citation1991, Pianosi et al. Citation2016), the global sensitivity of output Y to the kth input factor over the entire input variability space is defined as the arithmetic average of the individual pseudo-local sensitivities to the same input factor, that is
where n = 1, …, N is a counter of the elementary effects, and N is their total number. The standard deviation of the sample of elementary effects provides concise information on the degree of interaction of the kth input factor with the other ones in influencing the sensitivity of the selected output.
4.1 Sensitivity of dam breach peak outflow
The main outcome of breaching models used in dam-break flood analyses is the breach outflow hydrograph and, in particular, its peak value (e.g. Tsai et al. Citation2019, Sarchani and Koutroulis Citation2022). Both are strongly influenced by the initial reservoir level and breach size, as well as by the bathymetry of the reservoir.
According to EquationEquation (17)(17)
(17) , the pseudo-local elementary sensitivity effects of reservoir level H and breach size L on peak outflow Qp are, respectively,
and
where indexes i and j refer to the sub-division of the H- and L-ranges into intervals (i.e. the selected dam-break scenarios), and h denotes the initial reservoir level above the thalweg of the watercourse at the downstream face of the dam.
reports the dimensionless values of the peak outflows (adimensionalized by the value of reference scenario S1,0) for the dam-break scenarios considered in the Mignano case study. The pseudo-local sensitivities calculated according to EquationEquations (19)(19)
(19) and (Equation20
(20)
(20) ) are reported in . The positive values of the elementary effects indicate that the peak outflow increases with both the initial reservoir level and the breach size, as expected. The pseudo-local sensitivity of the peak outflow to the reservoir level is greater for higher water levels and tends to decline as the breach width decreases. On the other hand, the pseudo-local sensitivity of the peak outflow to the breach size is significantly greater for narrower breaches and increases with the reservoir level.
Table 5. Dimensionless peak outflows for the dam-break scenarios of the Mignano dam case study.
Table 6. Pseudo-local sensitivities of the peak outflow to the reservoir level for the Mignano dam-break case study.
Table 7. Pseudo-local sensitivities of the peak outflow to the breach width for the Mignano dam-break case study.
According to EquationEquation (18)(18)
(18) , the global sensitivities of the peak outflow to the reservoir level and breach width are, respectively,
and
Accordingly, the peak outflow is much more sensitive to the reservoir level than to the breach size. The sample standard deviations calculated for the two sets of elementary effects (concerning sensitivities to the reservoir level and the breach width) are
and
These low values indicate that reservoir level and breach size have a low degree of interaction in influencing the variability of the breach peak outflow.
4.2 Sensitivity of flood inundation extent
One of the flooding characteristics of most interest in dam-break flood hazard analyses is the maximum inundation extent in the downstream flood-prone area. The breach scenario parameters also influence this integral inundation quantity.
shows the dimensionless extents of the flooded area for the scenarios considered in the Mignano dam-break case study calculated for a four-hour simulation time. The flooding extents are nondimensionalized by that of the S1,0 reference scenario.
Table 8. Dimensionless flooding extent for the dam-break scenarios of the Mignano dam case study.
The pseudo-local elementary sensitivity effects of reservoir level and breach size on the flooded area extent, Af, were calculated through EquationEquations (19)(19)
(19) and (Equation20
(20)
(20) ), respectively, where Af replaces Qp. The values reported in show that the pseudo-local sensitivity of the flooded area extent to the reservoir level is higher for lower water levels, regardless of the breach size, whereas the flooded area extent is almost insensitive to the breach size over the entire input variability space.
Table 9. Pseudo-local sensitivities of the extent of the flooded areas to the reservoir level for the Mignano dam-break case study.
Table 10. Pseudo-local sensitivities of the extent of the flooded areas to the breach width for the Mignano dam-break case study.
The global sensitivity indexes are =2.2730 and
=0.00320, and the sample standard deviations are
=0.1201 and
=0.00372. Hence, the extent of the flooded area generally increases with both initial reservoir level and breach size, and is much more sensitive to the former. The interaction between the two input parameters has a negligible impact on the variability of the flooded area extent.
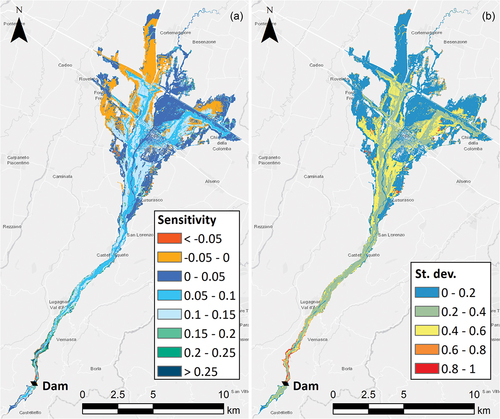
4.3 Flood hazard index sensitivity map
Based on the numerical results of each dam-break scenario, pseudo-local sensitivities of the flood hazard index to the reservoir level and breach width ( and
, respectively) were calculated in each computational cell according to EquationEquation (17)
(17)
(17) , thus providing a spatially-distributed sensitivity assessment. Global sensitivity indexes
and
were then calculated at each location according to EquationEquation (18)
(18)
(18) .
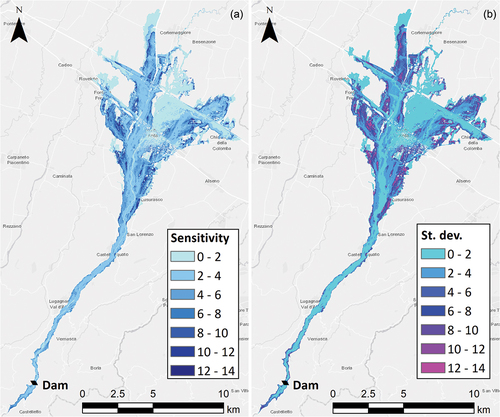
shows the map of the global sensitivity of the flood hazard index to the reservoir level (), along with the
map representing the degree of interaction of the reservoir level and breach width on the variability of the flood hazard index with respect to the reservoir level (). Global sensitivity values are positive everywhere, which indicates that the local flood hazard increases with the reservoir level ().
values are lower near the river and increase when moving towards the boundaries of the flooded area. The values of
show similar behaviour ().
Figure 8. (a) Map showing the global sensitivity of the flood hazard index to the reservoir level (). (b) Degree of interaction of the reservoir level and breach width on the variability of the flood hazard index with respect to the reservoir level (
).
Similarly, shows the absolute global sensitivity of the flood hazard index to the breach width (), along with the standard deviation
map () for the case study of the Mignano dam-break. A comparison of with reveals that flood hazard is generally more sensitive to the reservoir level than to the breach width. Some marginal zones of the flooded area in the floodplain and along the valley just downstream of the dam present slightly negative
values (), which indicates a moderate tendency of the flood hazard index to increase as the breach width decreases. In general, global sensitivity
decreases along the valley. The map of standard deviation
() shows a negligible influence of the reservoir level on the flood hazard sensitivities to the breach width in the case study considered.
Figure 9. (a) Map showing the global sensitivity of the flood hazard index to the breach width (b) Degree of interaction of the reservoir level and breach width on the variability of the flood hazard index with respect to the breach width (
).
4.4 Flood arrival time sensitivity map
A sensitivity analysis was also performed on the dam-break wave arrival time to obtain the maps of the global sensitivity of this flood hazard quantity to the reservoir level () and breach width ().
Figure 10. (a) Map showing the global sensitivity of the flood arrival time to the reservoir level (b) Degree of interaction of the reservoir level and breach width on the variability of the flood arrival time with respect to the reservoir level (
).
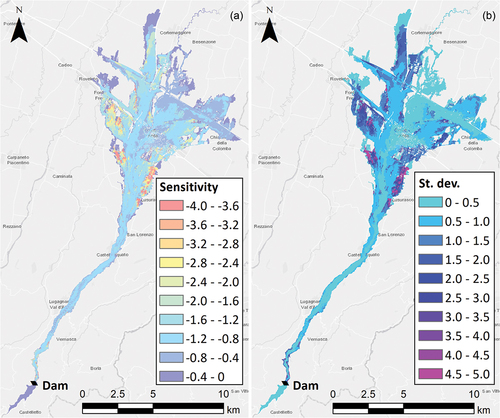
Figure 11. (a) Map showing the global sensitivity of the flood arrival time to the breach width (b) Degree of interaction of the reservoir level and breach width on the variability of the flood arrival time with respect to the breach width (
).
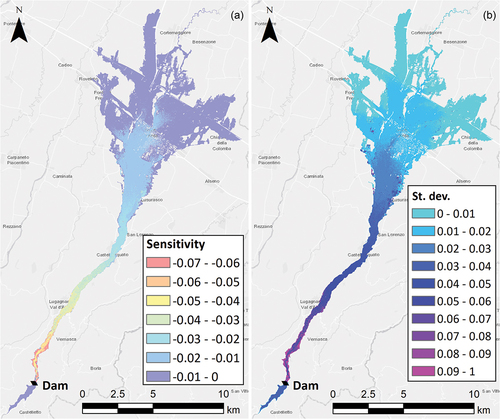
The negative sensitivities in indicate that the flood arrival time decreases as the reservoir level increases. Indeed, the higher the reservoir level at the time of dam failure, the faster the dam-break wave arrives. Similarly, shows that the flood arrival time decreases as the breach width increases. Moreover, the absolute global sensitivity of the flood arrival time to the breach size decreases along the valley. In general, the global sensitivity of the flood arrival time to the reservoir level is much higher than the sensitivity to the breach size throughout the flooded area, demonstrating that the reservoir level affects the speed of the dam-break wave more than the breach size does in the case study considered.
shows that the influence of the breach width on the variability of the flood arrival time with respect to the reservoir level becomes more significant when moving towards the lateral zones of the flooded area. shows that the degree of interaction of the two input factors on the variability of the flood arrival time with respect to the breach width is relatively low, except on the sides of the stretch of the Arda Valley just downstream of the dam.
5 Discussion
The probabilistic approach based on a set of preselected dam-break scenarios with associated a priori probabilistic “weights” (defined as conditional probabilities) allows for an overall reduction in the computational effort compared to the methods based on Monte Carlo sampling. Flood inundation modelling can then be performed through physically-based hydrodynamic models (Bates Citation2022) rather than computationally faster but less accurate, simplified or surrogate models (Kalinina et al. Citation2020). In addition, a high-resolution computational grid can be used to provide a small-scale evaluation of the flood hazard and accurately resolve topographic variations, such as natural or artificial levees, infrastructures, and obstacles, which potentially constrain flooding. However, the number of dam-break scenarios and their distribution in the variability space of the input scenario parameters should be adequately chosen so that the probability distribution functions of the input parameters are discretized with sufficient accuracy. The results of both uncertainty and sensitivity analyses can be sensitive to the number of preselected dam-break scenarios. Hence, the convergence of the method deserves to be explored in future research, along with the trade-off between model accuracy/convergence and computational efficiency.
A critical assumption of the method (and a potential limitation) is that the reservoir level and breach width are independent random variables. Stochastic independence of these breach parameters is reasonable for structural concrete dam failures induced by exceptional events (such as catastrophic earthquakes or terroristic attacks) or related to inadequate structural design, poor construction or maintenance, or gradual degradation. It is difficult to empirically verify the potential correlation between reservoir level and breach width since data on the reservoir level at the time of failure is often lacking for historical dam-break events, especially for concrete or masonry dams (Zhang et al. Citation2016, Aureli et al. Citation2021). Instead, some empirical equations for estimating the average breach width as a function of the water depth behind the dam have been presented in the literature for embankment dam failures (Wahl Citation2004, Froehlich Citation2008). The scarcity of initial reservoir level data for historical dam-breaks also hinders the evaluation of the conditional probability that the reservoir level falls into a given interval in the event of a dam-break. To overcome this limitation, the concept of the fragility function can be exploited to obtain a probabilistic description of the structure’s reliability.
According to Domeneghetti et al. (Citation2013, p. 3128), “a fair presentation of the results of any analysis should also quantify and illustrate the associated uncertainty, and this can be accomplished only in a probabilistic framework”. Probabilistic flood inundation maps effectively communicate to users and decision makers the confidence that they can have in flood hazard predictions given the uncertainties involved (Di Baldassarre et al. Citation2010). Indeed, they potentially provide information about the probability of flooding or the probability of occurrence of given flood hazard classes in the flood-prone area, or about the uncertainty associated with the local “expected” probability-weighted average estimate. This additional probabilistic information aids decision making by supporting better informed and more robust and efficient decisions (Poortvliet et al. Citation2019), and identification of priorities in emergency planning and dam-break flood risk management and mitigation (Domeneghetti et al. Citation2013).
A challenging issue of probabilistic methods is their validation, i.e. the quantitative assessment of model accuracy in the probabilistic framework, also in light of the use of results in flood risk management applications (Environment Agency Citation2012). However, validation opportunities are limited since dam-break events are rare and observation data of historical dam-break flooding sparse (Aureli et al. Citation2021).
In inundation hydrodynamic models, typically based on depth-averaged shallow water equations, the roughness coefficient (e.g. the Manning coefficient) is the only model parameter requiring calibration (Bates Citation2022). However, the calibration of this coefficient remains a problem due to the natural spatial variation in terrain roughness and the lack of data on real dam-break flooding. In hypothetical dam-break studies, empirical flood data are rarely available for roughness calibration in potentially flooded areas. In addition, hydrometric stations present along the watercourse probably never recorded flood levels comparable to those reachable during a dam-break event. Hence, the roughness coefficient is usually set from expert judgement and land cover and land use data (e.g. Bornschein Citation2018, Kalinina et al. Citation2020, El Bilali et al. Citation2022), or from empirical relationships (e.g. Papaioannou et al. Citation2017). A sensitivity analysis on the roughness coefficient assumed to be uniformly distributed in the flood-prone area is often performed in real-field dam-break flooding studies to assess the uncertainty introduced by roughness in flood inundation mapping (e.g. Álvarez et al. Citation2017, Pilotti et al. Citation2020, Sarchani and Koutroulis Citation2022). For example, Aureli et al. (Citation2008) performed a sensitivity analysis for the case study of the Mignano dam-break, assuming only two homogeneous roughness zones.
The outcomes of the sensitivity analysis are sensitivity maps showing the spatial variability of the global sensitivity of selected output flood hazard variables to the input scenario parameters. Therefore, the input parameters can be ordered according to their relative influence on the variability of the output variables, and the areas where this influence is greatest can be identified. For the case study considered, the peak breach outflow and the flooded area extent are influenced more by the reservoir level than the breach size, with a very small interaction between these input parameters. This result confirms the assumption of their stochastic independence. The flood hazard index is more sensitive to a variation in reservoir level than a variation in breach width. This latter factor plays a role in influencing the flood hazard index only in marginal zones of the flooded area. The breach size weakly affects the dam-break wave arrival time.
6 Conclusions
Dam-break flood hazard analyses regarding the hypothetical failure of a concrete or masonry dam are typically conducted deterministically on the basis of a single catastrophic scenario (total and instantaneous failure in the “sunny day” condition). However, this approach cannot provide information about the uncertainty associated with the characteristics of the flood wave propagating downstream and the resulting flood hazard, or about the sensitivity of the flood hazard variables to the relevant input parameters characterizing the dam-break scenarios (mainly the reservoir level and the breach width).
A higher level of assessment can be obtained through a probabilistic method based on a set of potential dam-break scenarios having reasonably different likelihoods of occurrence, thereby inherently taking into account the relevant sources of uncertainty. Such methods are widely used to assess flood hazard due to levee breaches in order to include uncertainties due to breach location and timing, breach shape and development, flood conditions, etc.
Probabilistic flood hazard assessment was extended in this paper to dam-break floods to produce probabilistic maps based on a set of preselected dam-break scenarios characterized by different reservoir levels and breach widths. The scenario probabilities were considered conditional to the fact that the dam-break event occurred. The potentialities of the method were demonstrated for the case study of the hypothetical collapse of the Mignano dam (River Arda, northern Italy).
The main outputs of the probabilistic method are:
the probabilistic map of the flood inundation extent, which provides the maximum extent of the flooded area along with the spatial distribution of the inundation probability in the event of a dam failure;
probabilistic hazard level maps, which provide the spatial distribution of the conditional probability of occurrence of given flood hazard classes (defined according to a selected flood hazard classification);
the “expected” probability-averaged flood hazard index map, coupled with the map of the associated relative coefficient of variation as a dimensionless measure of uncertainty in flood hazard estimation;
the “expected” probability-weighted dam-break wave arrival time map, coupled with the map of its standard deviation as a measure of the associated uncertainty.
Probabilistic dam-break flood hazard maps are more informative than conventional deterministic ones since they provide holistic and comprehensive information on both the flood hazard and associated uncertainty, thereby facilitating the identification of priorities for intervention in emergency and hazard mitigation planning. Accordingly, the highest priority should be assigned to areas where the most severe flood hazard occurs with the lowest uncertainty.
However, the probabilistic method proposed in this paper necessitates preselection of a set of dam-break scenarios, each of which requires a numerical flooding simulation. This potentially implies high computational costs, especially if physically-based models are used on high-resolution grids to ensure an extremely accurate spatial description of the flooding. The number of dam-break scenarios should guarantee an effective discretization of the variability space of the input parameters and provide confidence in model convergence. Moreover, the definition of the scenario (conditional) probabilities requires a detailed analysis of the potential failure causes in order to yield a probabilistic description of the dam’s reliability (e.g. through fragility functions) and to check the validity of the simplifying basic assumptions (mainly concerning the stochastic interaction between the scenario parameters).
Maps showing the sensitivity of relevant flood hazard variables to influential input parameters can be produced on the basis of the same set of dam-break scenarios.
In future research, the authors will study the model convergence and extend the probabilistic method to flood risk assessment, including exposure and vulnerability.
Acknowledgements
The authors are grateful to Dr Federico Prost (University of Parma, Italy) for his assistance in numerical simulations. The Piacenza Land Reclamation Consortium (Italy) is kindly acknowledged for providing the series of daily water levels measured in the Mignano reservoir.
Disclosure statement
No potential conflict of interest was reported by the author(s).
Additional information
Funding
References
- Abdedou, A., Soulaïmani, A., and Tchamen, G.W., 2020. Uncertainty propagation of dam break flow using the stochastic non-intrusive B-splines Bézier elements-based method. Journal of Hydrology, 590, 125342. doi:10.1016/j.jhydrol.2020.125342
- Abdulrahman, K.Z., et al., 2022. Hypothetical failure of the Khassa Chai dam and flood risk analysis for Kirkuk, Iraq. Natural Hazards, 113 (3), 1833–1851. doi:10.1007/s11069-022-05371-2
- Abt, S.R., et al., 1989. Human stability in a high flood hazard zone. Journal of the American Water Resources Association, 25 (4), 881–890. doi:10.1111/j.1752-1688.1989.tb05404.x
- Ahmadisharaf, E., et al., 2016. A probabilistic framework for comparison of dam breach parameters and outflow hydrograph generated by different empirical prediction methods. Environmental Modelling and Software, 86, 248–263. doi:10.1016/j.envsoft.2016.09.022
- Ahmadisharaf, E., Bhuyian, M.N.M., and Kalyanapu, A., 2013. Impact of spatial resolution on downstream flood hazard due to dam break events using probabilistic flood modeling. In: ASDSO Annual Conference 2013, 8–12 September 2013, Providence, RI. Red Hook, NY: Curran Associates, Inc., 263–276. Available from: https://media.goldsim.com/Documents/TechnicalPapers/Ahmadisharafetal.2013_FinalPaper.pdf [Accessed 28 Oct 2022].
- Ahmadisharaf, E., Kalyanapu, A.J., and Bates, P.D., 2018. A probabilistic framework for floodplain mapping using hydrological modeling and unsteady hydraulic modeling. Hydrological Sciences Journal, 63 (12), 1759–1775. doi:10.1080/02626667.2018.1525615
- Albano, R., et al., 2019. A GIS tool for mapping dam-break flood hazards in Italy. ISPRS International Journal of Geo-Information, 8 (6), 250. doi:10.3390/ijgi8060250
- Álvarez, M., et al., 2017. Two-dimensional dam-break flood analysis in data-scarce regions: the case study of Chipembe dam, Mozambique. Water, 9 (6), 432. doi:10.3390/w9060432
- Aureli, F., et al., 2008. 2D numerical modelling for hydraulic hazard assessment: a dam-break case study. In: M.S. Altinakar, et al., eds. River Flow 2008, International Conference on Fluvial Hydraulics, 3–5 September 2008, Çeşme, Izmir, Turkey. Ankara, Turkey: KUBABA Congress Department and Travel Services, Vol. 1, 729–736.
- Aureli, F., Maranzoni, A., and Petaccia, G., 2021. Review of historical dam-break events and laboratory tests on real topography for the validation of numerical models. Water, 13 (14), 1968. doi:10.3390/w13141968
- Australian National Committee on Large Dams, 2012. Guidelines on the consequence categories for dams. Hobart, Tasmania: ANCOLD.
- Baecher, G.B., Paté, M.E., and De Neufville, R., 1980. Risk of dam failure in benefit-cost analysis. Water Resources Research, 16 (3), 449–456. doi:10.1029/WR016i003p00449
- Bartholomew, C.L., 1989. Failure of concrete dams. In: Dam Safety 1989 – 6th ASDSO Annual Conference, 1–5 October 1989, Albuquerque, NM. Available from: https://damfailures.org/wp-content/uploads/2015/07/Failure-of-Concrete-Dams.pdf [Accessed 28 Oct 2022].
- Bates, P.D., 2022. Flood inundation prediction. Annual Review of Fluid Mechanics, 54 (1), 287–315. doi:10.1146/annurev-fluid-030121-113138
- Bellos, V., et al., 2020. Propagating dam breach parametric uncertainty in a river reach using the HEC-RAS software. Hydrology, 7 (4), 72. doi:10.3390/hydrology7040072
- Beven, K., et al., 2015. Communicating uncertainty in flood inundation mapping: a case study. International Journal of River Basin Management, 13 (3), 285–295. doi:10.1080/15715124.2014.917318
- Beven, K.J., et al., 2018. Epistemic uncertainties and natural hazard risk assessment–Part 1: a review of different natural hazard areas. Natural Hazards and Earth System Sciences, 18 (10), 2741–2768. doi:10.5194/nhess-18-2741-2018
- Bornschein, A., 2018. Combined influence of terrain model and roughness in dam break wave simulation. E3S Web of Conferences, 40, 06026. doi:10.1051/e3sconf/20184006026
- Chow, V.T., 1959. Open-channel hydraulics. New York, NY: McGraw-Hill.
- Chow, V.T., Maidment, D.R., and Mays, L.W., 1988. Applied hydrology. New York, NY: McGraw-Hill.
- Circular from the Italian Prime Minister 13.12.1995, n. DSTN/2/22806, 1995. Disposizioni attuative e integrative in materia di dighe. Allegato–Raccomandazioni per la mappatura delle aree a rischio di inondazione conseguente a manovre degli organi di scarico o ad ipotetico collasso delle dighe. [Implementional and supplementary instructions on dams. Attachement–Recommendations for the mapping of areas at risk of flooding resulting from manoeuvres of dam spillways and outlets or the hypothetical collapse of dams]. Official Gazette of the Italian Republic, no. 56 of 7 March 1996 (in Italian).
- Dawson, R., et al., 2005. Sampling-based flood risk analysis for fluvial dike systems. Stochastic Environmental Research and Risk Assessment, 19 (6), 388–402. doi:10.1007/s00477-005-0010-9
- Department for Environment, Food and Rural Affairs. 2006. Flood risks to people (FD2321/TR2 Guidance Document). London, UK: DEFRA, Environment Agency. Available from: https://assets.publishing.service.gov.uk/media/602bbc3de90e07055f646148/Flood_risks_to_people_-_Phase_2_Guidance_Document_Technical_report.pdf [ Accessed 28 Oct 2022].
- Dewals, B. et al., 2014. Dam break flow modelling with uncertainty analysis. In: P. Gourbesville, J. Cunge, and G. Caignaert, eds. Advances in hydroinformatics. Singapore: Springer, 107–116. doi:10.1007/978-981-4451-42-0_9
- Di Baldassarre, G., et al., 2009. Probability-weighted hazard maps for comparing different flood risk management strategies: a case study. Natural Hazards, 50 (3), 479–496. doi:10.1007/s11069-009-9355-6
- Di Baldassarre, G., et al., 2010. Flood-plain mapping: a critical discussion of deterministic and probabilistic approaches. Hydrological Sciences Journal, 55 (3), 364–376. doi:10.1080/02626661003683389
- Directive of the Italian Prime Minister 08.07.2014,2014. Indirizzi operativi inerenti l’attività di protezione civile nell’ambito dei bacini in cui siano presenti grandi dighe. [Operational guidelines concerning civil protection activities within basins where large dams are present]. Official Gazette of the Italian Republic, no. 256 of 4 November 2014 (in Italian).
- Domeneghetti, A., et al., 2013. Probabilistic flood hazard mapping: effects of uncertain boundary conditions. Hydrology and Earth System Sciences, 17 (8), 3127–3140. doi:10.5194/hess-17-3127-2013
- D’Oria, M., Maranzoni, A., and Mazzoleni, M., 2019. Probabilistic assessment of flood hazard due to levee breaches using fragility functions. Water Resources Research, 55 (11), 8740–8764. doi:10.1029/2019WR025369
- Douglas, K., Spannagle, M., and Fell, R., 1999. Analysis of concrete and masonry dam incidents. International Journal on Hydropower and Dams, 6 (4), 108–115.
- El Bilali, A., et al., 2022. A practical probabilistic approach for simulating life loss in an urban area associated with a dam-break flood. International Journal of Disaster Risk Reduction, 76, 103011. doi:10.1016/j.ijdrr.2022.103011
- Ellingwood, B. and Tekie, P.B., 2001. Fragility analysis of concrete gravity dams. Journal of Infrastructure Systems, 7 (2), 41–48. doi:10.1061/(ASCE)1076-0342(2001)7:2(41)
- Environment Agency, 2012. A framework for validating probabilistic (flood) models. Project Summary SC090008/S2. https://assets.publishing.service.gov.uk/media/6033a1d38fa8f543294411a6/A_framework_for_validating_probabilistic__flood__models_summary.pdf[Accessed 28 Oct 2022].
- Federal Emergency Management Agency, 2013. Federal guidelines for inundation mapping of flood risks associated with dam incidents and failures (FEMA P-946). Washington, DC: FEMA, US Department of Homeland Security. Available from: https://www.fema.gov/sites/default/files/2020-08/fema_dam-safety_inundation-mapping-flood-risks.pdf [ Accessed 28 Oct 2022].
- Fell, R., et al., 2000. The status of methods for estimation of the probability of failure of dams for use in quantitative risk assessment. In: 20th International Congress on Large Dams, 19–22 September 2000, Beijing, China. ICOLD, Central Office. Available from: https://www.researchgate.net/profile/David-Bowles-3/publication/2324704_The_Status_Of_Methods_For_Estimation_Of_The_Probability_Of_Failure_Of_Dams_For_Use_In_Quantitative_Risk_Assessment/links/0912f51007ae606c49000000/The-Status-Of-Methods-For-Estimation-Of-The-Probability-Of-Failure-Of-Dams-For-Use-In-Quantitative-Risk-Assessment.pdf [Accessed 28 Oct 2022].
- Foster, M., Fell, R., and Spannagle, M., 2000. The statistics of embankment dam failures and accidents. Canadian Geotechnical Journal, 37 (5), 1000–1024. doi:10.1139/t00-030
- Froehlich, D.C., 2008. Embankment dam breach parameters and their uncertainties. Journal of Hydraulic Engineering, 134 (12), 1708–1721. doi:10.1061/(ASCE)0733-9429(2008)134:12(1708)
- Hall, J.W., et al., 2003. A methodology for national-scale flood risk assessment. Proceedings of the Institution of Civil Engineers - Water and Maritime Engineering, 156 (3), 235–247. doi:10.1680/wame.2003.156.3.235
- Hall, J.W., et al., 2005. Distributed sensitivity analysis of flood inundation model calibration. Journal of Hydraulic Engineering, 131 (2), 117–126. doi:10.1061/(ASCE)0733-9429(2005)131:2(117)
- Hariri-Ardebili, M.A. and Saouma, V.E., 2016. Collapse fragility curves for concrete dams: comprehensive study. Journal of Structural Engineering, 142 (10), 04016075. doi:10.1061/(ASCE)ST.1943-541X.0001541
- Hinks, J.L., Kitamura, Y., and Murphy, A.T., 2015. Risk analyses for large dams. In: R.M. Gunn, et al., eds. 13th ICOLD International Benchmark Workshop on the Numerical Analysis of Dams, 9–11 September 2015, Lausanne, Switzerland. Swiss Committee on Dams, 277–284. Available from: https://www.itcold.it/wpsysfiles/wp-content/uploads/2018/02/ICOLD_Compudams_BW13_Lausanne_2015.pdf [Accessed 28 Oct 2022].
- Indian Central Water Commission, 2018. Guidelines for mapping flood risks associated with dams (CDSO_GUD_DS_05_v1.0). New Delhi, India: Central Water Commission, Central Dam Safety Organisation. Available from: https://damsafety.cwc.gov.in/ecm-includes/PDFs/Guidelines_for_Mapping_Flood_Risks_Associated_with_Dams.pdf [ Accessed 9 Nov 2022].
- International Commission on Large Dams, 1995. Dam failures. Statistical analysis (Bulletin 99). Paris, France: ICOLD.
- International Commission on Large Dams, 1998. Dam-break flood analysis. Review and recommendations (Bulletin 111). Paris, France: ICOLD.
- Italian Association of the Electricity Distribution Companies. 1953. Le dighe di ritenuta degli impianti idroelettrici italiani [Dams of the Italian hydroelectric plants], Vol. VII. Milan, Italy: ANIDEL, 223–233 (in Italian).
- Jung, Y. and Merwade, V., 2012. Uncertainty quantification in flood inundation mapping using generalized likelihood uncertainty estimate and sensitivity analysis. Journal of Hydrologic Engineering, 17 (4), 507–520. doi:10.1061/(ASCE)HE.1943-5584.0000476
- Kalinina, A., et al., 2020. Metamodeling for uncertainty quantification of a flood wave model for concrete dam breaks. Energies, 13 (14), 3685. doi:10.3390/en13143685
- Kreibich, H., et al., 2009. Is flow velocity a significant parameter in flood damage modelling? Natural Hazards and Earth System Sciences, 9 (5), 1679–1692. doi:10.5194/nhess-9-1679-2009
- MacDonald, T.C. and Langridge-Monopolis, J., 1984. Breaching characteristics of dam failures. Journal of Hydraulic Engineering, 110 (5), 567–586. doi:10.1061/(ASCE)0733-9429(1984)110:5(567)
- Maranzoni, A., D’Oria, M., and Mazzoleni, M., 2022. Probabilistic flood hazard mapping considering multiple levee breaches. Water Resources Research, 58 (4), e2021WR030874. doi:10.1029/2021WR030874
- Maranzoni, A., D’Oria, M., and Rizzo, C., 2023. Quantitative flood hazard assessment methods: a review. Journal of Flood Risk Management, 16 (1), e12855. doi:10.1111/jfr3.12855
- Martin, J.D. and Gray, L.N., 1971. Measurement of relative variation: sociological examples. American Sociological Review, 36 (3), 496–502. doi:10.2307/2093089
- Mazzoleni, M., et al., 2014. Flooding hazard mapping in floodplain areas affected by piping breaches in the Po River, Italy. Journal of Hydrologic Engineering, 19 (4), 717–731. doi:10.1061/(ASCE)HE.1943-5584.0000840
- Merz, B., Thieken, A.H., and Gocht, M., 2007. Flood risk mapping at the local scale: concepts and challenges. In: S. Begum, M.J.F. Stive, and J.W. Hall, eds. Flood risk management in Europe. Dordrecht, The Netherlands: Springer, 231–251. doi:10.1007/978-1-4020-4200-3_13
- Morris, M.D., 1991. Factorial sampling plans for preliminary computational experiments. Technometrics, 33 (2), 161–174. doi:10.1080/00401706.1991.10484804
- New Zealand Society on Large Dams, 2015. New Zealand dam safety guidelines. Wellington, New Zealand: NZSOLD. Available from: https://nzsold.org.nz/wp-content/uploads/2019/10/nzsold_dam_safety_guidelines-may-2015-1.pdf [ Accessed 28 Oct 2022].
- Norton, J., 2015. An introduction to sensitivity assessment of simulation models. Environmental Modelling and Software, 69, 166–174. doi:10.1016/j.envsoft.2015.03.020
- Ongdas, N., et al., 2020. Application of HEC-RAS (2D) for flood hazard maps generation for Yesil (Ishim) river in Kazakhstan. Water, 12 (10), 2672. doi:10.3390/w12102672
- Papaioannou, G., et al., 2017. Probabilistic flood inundation mapping at ungauged streams due to roughness coefficient uncertainty in hydraulic modelling. Advances in Geosciences, 44, 23–34. doi:10.5194/adgeo-44-23-2017
- Pappenberger, F., et al., 2006. Influence of uncertain boundary conditions and model structure on flood inundation predictions. Advances in Water Resources, 29 (10), 1430–1449. doi:10.1016/j.advwatres.2005.11.012
- Pappenberger, F., et al., 2008. Multi-method global sensitivity analysis of flood inundation models. Advances in Water Resources, 31 (1), 1–14. doi:10.1016/j.advwatres.2007.04.009
- Patra, J.P., Kumar, R., and Mani, P., 2019. Flood hazard assessment for a dam failure. International Journal of Advance and Innovative Research, 6 (2), 34–39. Available from: http://iaraedu.com/pdf/ijair-volume-6-issue-2-xxxi-april-june-2019.pdf [ Accessed 28 Oct 2022].
- Pianosi, F., et al., 2016. Sensitivity analysis of environmental models: a systematic review with practical workflow. Environmental Modelling and Software, 79, 214–232. doi:10.1016/j.envsoft.2016.02.008
- Pilotti, M., et al., 2020. Dam-break wave propagation in alpine valley with HEC-RAS 2D: experimental Cancano test case. Journal of Hydraulic Engineering, 146 (6), 05020003. doi:10.1061/(ASCE)HY.1943-7900.0001779
- Poortvliet, P.M., et al., 2019. On the communication of statistical information about uncertainty in flood risk management. Safety Science, 118, 194–204. doi:10.1016/j.ssci.2019.05.024
- Qi, H. and Altinakar, M.S., 2012. GIS-based decision support system for dam break flood management under uncertainty with two-dimensional numerical simulations. Journal of Water Resources Planning and Management, 138 (4), 334–341. doi:10.1061/(ASCE)WR.1943-5452.0000192
- Quiroga, V.M., et al., 2016. Application of 2D numerical simulation for the analysis of the February 2014 Bolivian Amazonia flood: application of the new HEC-RAS version 5. Ribagua, 3 (1), 25–33. doi:10.1016/j.riba.2015.12.001
- Rodrigues, A.S., et al., 2002. Dam-break flood emergency management system. Water Resources Management, 16 (6), 489–503. doi:10.1023/A:1022225108547
- Sarchani, S. and Koutroulis, A.G., 2022. Probabilistic dam breach flood modeling: the case of Valsamiotis dam in Crete. Natural Hazards, 114 (2), 1763–1814. doi:10.1007/s11069-022-05446-0
- Saxena, K.R. and Sharma, V.M., 2004. Dams: incidents and accidents. Leiden, The Netherlands: CRC Press.
- Smemoe, C.M., et al., 2007. Demonstrating floodplain uncertainty using flood probability maps. Journal of the American Water Resources Association, 43 (2), 359–371. doi:10.1111/j.1752-1688.2007.00028.x
- Teng, J., et al., 2017. Flood inundation modelling: a review of methods, recent advances and uncertainty analysis. Environmental Modelling and Software, 90, 201–216. doi:10.1016/j.envsoft.2017.01.006
- Tsai, C.W., Yeh, J.-J., and Huang, C.-H., 2019. Development of probabilistic inundation mapping for dam failure induced floods. Stochastic Environmental Research and Risk Assessment, 33 (1), 91–110. doi:10.1007/s00477-018-1636-8
- US Army Corps of Engineers, 2014. Using HEC-RAS for dam break studies. Davis, CA: USACE, Institute for Water Resources, Hydrologic Engineering Center. Available from: https://www.hec.usace.army.mil/publications/TrainingDocuments/TD-39.pdf [ Accessed 28 Oct 2022].
- Vacondio, R., et al., 2017. A non-uniform efficient grid type for GPU-parallel shallow water equations models. Environmental Modelling and Software, 88, 119–137. doi:10.1016/j.envsoft.2016.11.012
- Vacondio, R., Dal Palù, A., and Mignosa, P., 2014. GPU-enhanced finite volume shallow water solver for fast flood simulations. Environmental Modelling and Software, 57, 60–75. doi:10.1016/j.envsoft.2014.02.003
- van Alphen, J. and Passchier, R., 2007. Atlas of flood maps–Examples from 19 European countries, USA and Japan. Ministry of Transport, Public Works and Water Management, The Netherlands. Available from: https://open.rws.nl/publish/pages/19689/383224.pdf [ Accessed 28 Oct 2022].
- Veale, B. and Davison, I., 2013. Estimation of gravity dam breach geometry. In: Multiple use of dams and reservoirs: needs, benefits and risks. Proceedings of the NZSOLD/ANCOLD Conference, 13–15 November 2013, Rotorua, New Zealand. Wellington, New Zealand: IPENZ Proceedings of Professional Groups, 79–91. https://www.researchgate.net/profile/Ian-Davison-3/publication/315766007_Estimation_of_Gravity_Dam_Breach_Geometry/links/5c07502b92851c6ca1ff222e/Estimation-of-Gravity-Dam-Breach-Geometry.pdf [Accessed 28 Oct 2022].
- Viseu, T. and Betâmio de Almeida, A., 2009. Dam-break risk management and hazard mitigation. In: WIT Transactions on State-of-the-art in Science and Engineering. Southampton, UK: WIT Press, 36, 211–239. doi:10.2495/978-1-84564-142-9/06
- Vogel, A., Busswald, P., Niederl, F., 2004. The world largest data base on dam failures–data acquisition, management, protection and internet-based applications. In: S.-Y. Liong, K.-K. Phoon, and V. Babovic, eds. 6th International Conference on Hydroinformatics, 21–24 June 2004, Singapore. Singapore: World Scientific Publishing, Vol. 1 652–659. doi:10.1142/9789812702838_0080
- Vorogushyn, S., et al., 2010. A new methodology for flood hazard assessment considering dike breaches. Water Resources Research, 46 (8), W08541. doi:10.1029/2009WR008475
- Wade, S., et al., 2005. Risk to people: developing new approaches for flood hazard and vulnerability mapping. In: 40th Defra Flood and Coastal Management Conference, 5–7 July 2005, York, UK. Department for Environment, Food and Rural Affairs. Available from: https://eprints.hrwallingford.com/562/1/HRPP340-Risks_to_people-Flood_hazard_approaches.pdf [Accessed 28 Oct 2022].
- Wahl, T.L., 2004. Uncertainty of predictions of embankment dam breach parameters. Journal of Hydraulic Engineering, 130 (5), 389–397. doi:10.1061/(ASCE)0733-9429(2004)130:5(389)
- Willis, T., Wright, N., and Sleigh, A., 2019. Systematic analysis of uncertainty in 2D flood inundation models. Environmental Modelling and Software, 122, 104520. doi:10.1016/j.envsoft.2019.104520
- Zarfl, C., et al., 2015. A global boom in hydropower dam construction. Aquatic Sciences, 77 (1), 161–170. doi:10.1007/s00027-014-0377-0
- Zhang, L., et al., 2016. Dam failure mechanisms and risk assessment. Singapore: Wiley.
- Zhang, L.M., Xu, Y., and Jia, J.S., 2009. Analysis of earth dam failures: a database approach. Georisk, 3 (3), 184–189. doi:10.1080/17499510902831759