
 ?Mathematical formulae have been encoded as MathML and are displayed in this HTML version using MathJax in order to improve their display. Uncheck the box to turn MathJax off. This feature requires Javascript. Click on a formula to zoom.
ABSTRACT
Stochastic weather generators are powerful tools capable of extending the available precipitation records to the desired length. These, however, rely upon the amount of information available, which often is scarce, especially in arid and semi-arid regions. No studies can be found dealing with the uncertainty associated with these estimates related to the amount of information used in the weather generation calibration process, which is precisely the aim of the present study. A Monte Carlo simulation from a synthetic population was performed, evaluating the uncertainty of the simulated quantiles in different practical available information scenarios. The results showed that incorporating a regional study of annual maximum daily precipitation in the model parameterization clearly reduced the uncertainty of all quantile estimates. In addition, it has been proved that the uncertainty of these estimates increases with the population extremality, thus marking the importance of integrating additional information in regions with extreme precipitation patterns.
Editor A. Castellarin; Guest Editor A. Sharma
1 Introduction
Extreme precipitation events leading to major floods are natural disasters that cause high economic losses and a high number of fatalities around the world. In addition, climate change projections predict an increase in their frequency and magnitude (e.g. Alfieri et al. Citation2017, Paprotny and Morales-Nápoles Citation2017), which – combined with the global socio-economic development – will lead to an increase in the frequency and severity of flood losses resulting from extreme precipitation events in the near future (IPCC Citation2022). Having a better understanding of these events and, thus, being able to better predict them would result in extensive improvements in early warning flood protocols and in a better sizing of future infrastructures (or resizing the existing ones), which is key to reduce future losses.
However, the high spatio-temporal variability of these extreme precipitation events, and in particular the short available precipitation records, makes it difficult to obtain reliable quantile ( estimates when modelling these events, particularly those
associated with high return periods. This problem becomes more evident in arid and semi-arid climates, where most of the rainfall is concentrated in short periods of time (mostly in the form of heavy rainfall episodes), and these are followed by long drought conditions.
A relatively recent widely adopted solution to this problem is the use of stochastic weather generators (WGs). WGs are computer models that produce long synthetic series of meteorological data that have similar statistical properties to the observed data (Chen et al. Citation2010). Furthermore, while observed time series represent only one realization of the climate, WGs can generate many realizations, which provide a wider range of feasible situations (Khazaei et al. Citation2021). They have been extensively used coupled with hydrological and environmental models (e.g. Cowpertwait et al. Citation2013, Dai and Qin Citation2019, Beneyto et al. Citation2020), and more recently as a tool for climate downscaling, increasing the resolution of climate projections by linking their parameters to the climate model outputs (e.g. Chun et al. Citation2013, Li and Babovic Citation2019, Khazaei et al. Citation2021).
Although the first WGs developed were mostly univariate, single-site and at a daily temporal resolution (e.g. Richardson Citation1981, Richardson and Wright Citation1984, Wilks Citation1998), the need for long data series for multiple weather variables, at multiple locations, and at finer time resolutions has brought a recent exponential growth of new WGs integrating all of these demands.
Current WGs can be broadly divided into parametric or non-parametric (or resampling; see Rajagopalan and Lall Citation1999, Ailliot et al. Citation2020). Most existing WGs are of the parametric type since parameters can be altered to simulate different weather scenarios and thus facilitate climate change studies (Wilks Citation2009). Both types of WGs perform reasonably well in terms of reproducing average characteristics of some variables. Past issues related to the inter-annual variability of monthly precipitation means (Wilks and Wilby Citation1999, Sharif and Burn Citation2006, Ailliot et al. Citation2015) have been addressed in recent years. Papalexiou (Citation2018) proposed simulating processes that explicitly reproduce the long-term persistence autocorrelation structure or disaggregating the annual/monthly time series that preserve the desired variability (Papalexiou et al. Citation2018) to deal with this issue. Notwithstanding this, since the statistical properties of the generated meteorological variables are expected to be similar to those of the observed weather records and the length of the current registers is relatively short (i.e. very little information on extremes), the performance of WGs reproducing high-return-period estimates is still limited. Thus, even after extending the precipitation records with WGs, the higher estimated still present high uncertainty (Khazaei et al. Citation2021).
Extensive efforts have been made, particularly within the hydrological community, to statistically model high precipitation amounts. Cowpertwait (Citation1998) applied a method for deriving high-order moments to obtain the third-moment function for the observed precipitation time series. Evin and Favre (Citation2012) refined the Neyman-Scott model structure by introducing the concept of transient storm arrival rate. Other efforts, with much evidence of the precipitation amount distribution being heavy-tailed, have been dedicated (Furrer and Katz Citation2008). In this sense, several WGs incorporating heavy-tailed distribution functions have emerged in recent years (e.g. Hundecha et al. Citation2009, Evin et al. Citation2018, Ahn Citation2020). More recently, Papalexiou (Citation2022) developed a two-state rainfall model, CoSMoS-2s, highlighting the importance of selecting an appropriate distribution to describe nonzero rainfall and stating that if the fitted marginal describes the behaviour of rainfall well, then it reproduces the tail properties too and thus the behaviour of extremes. However, although a distribution might appear to describe the observations well, this does not guarantee that its tail precisely reproduces extremes (Papalexiou Citation2022). Notwithstanding this, the source of uncertainty still lies with the observed rainfall time series (Merz and Blöschl Citation2008, Salazar-Galán et al. Citation2021). Focusing on this, other authors, such as Beneyto et al. (Citation2020), proposed the incorporation of more robust studies (e.g. regional precipitation studies) for the parameterization of the WG, similarly to Evin et al. (Citation2018), which clearly reduced the uncertainty of low-frequency discharge estimates; however, this reduction of uncertainty was not within the scope of their work.
Recent studies are mostly focused on climate change impacts, assessing the uncertainty introduced by WG-based downscaling when applied to projections of future climate (e.g. Chen et al. Citation2011, Vesely et al. Citation2019, Sharafati and Pezeshki Citation2020). However, we found no studies in the literature with the aim of quantifying the uncertainty of low-frequency quantile estimates generated with WGs associated with the amount of available information.
The main objective of the present paper is to quantify the uncertainty of the higher precipitation estimates generated by a stochastic WG in four different practical available information scenarios. These can be broadly divided into two groups: two scenarios where the only available information is the observations, and two scenarios incorporating information from a regional study of annual maximum daily precipitation. A synthetic study area was created from one existing raingauge located on the Spanish Mediterranean coast (i.e. semi-arid climate). Monte Carlo simulations using a WG focused on extreme events were conducted, evaluating three performance indices for both the simulated
and for the shape parameter of the marginal distribution: relative root mean square error (
), relative bias (
), and coefficient of variation (
).
Under- or overestimation of precipitation has always been a problem, especially in modern flood modelling studies where hydrological models are fed with precipitation generated by WGs. The main reason behind this is the short length of the available meteorological data series, which hinders WGs from appropriately capturing low-frequency events. This study aims to contribute to this field by assessing the importance of robust precipitation data series and the incorporation of additional information as inputs for WGs, leading to better
estimations and reducing their uncertainty.
2 Synthetic case study
2.1 Location and available meteorological data
Rather than making up a completely fictitious study area, our synthetic study area was built using information obtained from one raingauge located on the Spanish Mediterranean coast, which was considered representative of a semiarid climate after carrying out a statistical analysis of different raingauges in the area. Daily precipitation records were obtained for the period 1951–2015 from the Spain02-v5 dataset (Herrera et al. Citation2016, Kotlarski et al. Citation2017): a series of interpolated precipitation and temperature data in a 0.11° rotated grid. Climate in this region can be considered semi-arid: despite registering an annual mean precipitation of 570 mm, more than 75% of days are dry and precipitation is mostly concentrated during the autumn months, highly influenced by the effects of mesoscale convective systems (MCSs) (Llasat and Puigcerver Citation1990), that lead to torrential precipitation events. These rains account for approximately 40% of the annual rainfall. Spring (25%) and winter (20%) are characterized by the passage of frontal systems linked to Atlantic zonal flow, whilst most of the precipitation registered over the summer months (15%) originates in isolated convective storms (Mateu Citation1974, Camarasa Belmonte and Segura Beltrán Citation2001). A table with the basic observation statistics is shown in . Additionally, the mean monthly precipitation amounts along with the number of annual daily maximum occurrences by month can be observed in .
Figure 1. Monthly mean precipitation (grey) and number of annual maximum occurrences by month (black dots).
Table 1. Observation statistics.
2.2 Stochastic WG: GWEX
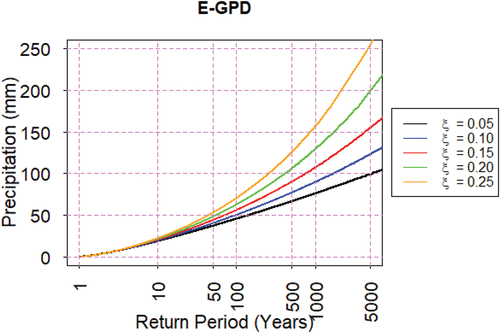
The multisite WG used in this work was GWEX (Evin et al. Citation2018), developed by the Centre National de la Recherche Scientifique (CNRS) and first presented in 2018. This WG was devised to focus on extreme events; it follows the Wilks approach (Wilks Citation1998), where precipitation occurrence and amount are modelled separately. Thus, the at-site occurrence process at each location is defined by a p-order Markov chain, and the spatial dependence of the precipitation states is modelled using an unobserved Gaussian stochastic process. With regards to the intensity process, the GWEX model generates the amount of precipitation by using a tail-dependent spatial distribution; an autocorrelated temporal process; and a marginal heavy-tailed distribution for each raingauge and each month of the year. This distribution is the extended generalized Pareto distribution (E-GPD), which was first proposed by Papastathopoulos and Tawn (Citation2013) and has been proven to model adequately both low and high precipitation intensities (Naveau Citation2016). This distribution function is obtained by raising the generalized Pareto distribution to a power of :
where controls the shape of the lower tail,
is a scale parameter, and
controls the rate of upper tail decay (Naveau Citation2016) (). All three need be estimated for each station and each month of the year.
Figure 2. E-GPD upper tail decay for different ξ values.
Lastly, the spatial and temporal dependence of precipitation amounts are represented simultaneously using a multivariate autoregressive model of order 1. Furthermore, to introduce a tail dependence between at-site extremes, GWEX allows the introduction of a Student copula to represent the dependence structure of innovations (Evin et al. Citation2018).
3 Methodology
A synthetic “base” population was created from the 66-year sample described in Section 2.1 for one raingauge. All parameters defining this population were estimated with GWEX. Additionally, a ξ value of 0.11 obtained from an existing regional study was assigned for all months of the year for the sake of simplicity. In order to adequately capture their base , 15 000 years were simulated with GWEX replicating the main statistics in .
From this population, a Monte Carlo simulation study was performed with 50 × 60-year samples, which is reasonable with the current extent of daily precipitation records. For each sample, all WG parameters related to the precipitation occurrence, amount and temporal correlation were firstly fitted from the sample records; then, according to the information scenarios, we estimated the shape parameter ξ as follows:
No additional information:
For each realization, the ξ parameter value was set to 0.05 (default) as proposed by Evin et al. (Citation2018).
For each realization, the value of the parameter ξ was estimated by fitting an E-GPD to the
estimated from the available observations.
There exists a regional study of annual maximum daily precipitation:
(1) Parameter ξ was estimated with one high-T regional quantile for each realization (if not regional E-GPD).
(2) The parameter ξ was set to the regional value for each realization (if regional E-GPD).
For simplicity, it was assumed that the regional study of annual maximum daily precipitation was “perfect” (i.e. no uncertainty). Therefore, the regional was assumed to be the population
, and the regional
the population
.
Uncertainty was measured through the RRMSE, RB and CV, which were computed and analysed for both the simulated and for the ξ parameter. Additionally, sensitivity analyses were conducted for the calibration
, the population ξ value and the sample length.
4 Results
4.1 Information scenarios
The first analysis carried out aimed to find the information scenario presenting the best quantile estimations. shows the box plots of the simulated quantiles of the 50 realizations for different return periods and for the four information scenarios. The value of the simulated quantiles (standardized with the population quantile) is represented on the x-axis and the different return periods are shown on the y-axis. The upper plots (i.e. scenario 0 and scenario 1) present the results when no extra information is added in the WG calibration, whereas the lower plots (i.e. scenario 2 and scenario 3) integrate the information from a regional study of annual maximum daily precipitation in the calibration process. At first glance, from it can be observed that the WG performs better when extra information is incorporated for its calibration. In scenario 0, where ξ is left as default, quantile estimations show a systematic underestimation for all quantiles, this being more evident as we move to higher quantiles. In the case of scenario 1, where the ξ parameter is estimated with the sample , a slight improvement can be appreciated for all quantile estimates; however, significant values of RRMSE are still obtained, especially for high return periods. CV values increase considerably compared to scenario 0, which is explained by the sample variability.
Figure 3. Box plots of the estimated quantiles (standardized with the population quantiles) for the four information scenarios. Both the RRMSE (expressed in %) and the CV are shown on top of each box plot for each T.
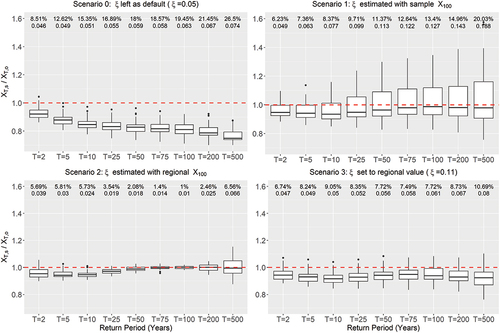
Moving to scenarios 2 and 3, where a regional study of annual maximum daily precipitation is integrated for the estimation of the parameter ξ, a clear improvement can be appreciated. Estimating the parameter ξ with the regional (i.e. scenario 2) leads to a significant reduction in both RRMSE and CV for all quantiles. Given that in this case the parameter ξ was calibrated with the regional
, low values for both metrics were expected for this quantile; however, satisfactory results were also obtained for
and
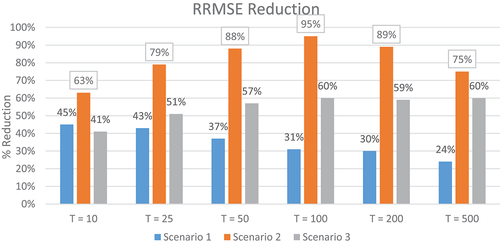
estimations, with RRMSE values of 2.46% and 6.56%, respectively, which means a reduction in the RRMSE of 89% and 75%, respectively, compared to scenario 0 (). The high-frequency quantiles are still underestimated; this is because the parameter ξ does not significantly affect the shape of the lower part of the distribution function (). Lastly, applying the regional parameter to all realizations (scenario 3), contrary to what might be expected, we observed a systematic negative relative bias for all quantile estimations, which could be attributed to the uncertainty of the method itself. Nevertheless, the reduction of both the RRMSE and the CV is evident compared to both scenarios where no extra information is incorporated; however, this reduction is higher in the case of estimating the parameter ξ with the regional
(). For this reason, only scenario 2 is presented in further analyses.
Figure 4. Reduction of RRMSE for the three scenarios compared to scenario 0 (parameter ξ set to 0.05.
4.2 Calibration
Having demonstrated that the best approach was to estimate the parameter ξ with the regional , an analysis to evaluate how the selection of the single
could affect the WG performance was performed. To do this, again, a Monte Carlo simulation study was performed with 50 × 60-year samples to calibrate the parameter ξ with different regional
(i.e.
,
,
,
) and compared. shows the results for each implementation. Moreover, since each realization estimates a value for the parameter ξ, an individual analysis of the variations of this parameter was carried out for each implementation ().
Figure 5. Box plots of the estimated quantiles (standardized with the population quantiles) for different calibration in scenario 2.
Figure 6. Box plots of the ξ values for different calibration values in scenario 2.
Typical values of obtained from regional studies of annual maximum daily precipitation range between those associated with return periods of 50 years and 200 years. Considering quantiles beyond a return period of 200 years does not make much sense since the available precipitation records rarely allow for certain estimations of these quantiles. Notwithstanding this and for the sake of this analysis,
and
were also considered in this study.
As can be observed in , using to calibrate the WG results in overestimations of all quantiles, with RRMSE values of up to 14.4% and 20% for return periods of 200 years and 500 years, respectively. Both
and
significantly reduced both the RRMSE and the CV for all quantiles, obtaining satisfactory results especially in the case of the low-frequency quantiles (i.e.
and
). It is worth noting here that, as commented previously, slight underestimations can be observed for those
lower than the calibration
. In the case of
, however, the underestimation seems to be systematic for all quantiles, although the values of RRMSE are fairly satisfactory. The box plots of the parameter ξ obtained for each calibration
are presented in .
4.3 Population extremality
The objective of this analysis was to evaluate whether the extremality of the population could have an influence on the performance of the WG. Parameters and
were proven to not have much influence on the upper part of the distribution function, therefore, four synthetic populations were created by means of increasing the value of the parameter ξ {0.09, 0.11, 0.13 and 0.25}. A Monte Carlo simulation study was performed with 50 × 60-year samples, calibrating the parameter ξ with the regional
of each population. Results in show an increase of the relative bias and the interquartile range with the extremality, indicating that the more extreme the climate is, the worse the WG performs. This decay is more evident for high return periods, and is nearly imperceptible for return periods lower than 50 years.
Figure 7. Box plots of the Monte Carlo simulation calibrated with the regional for populations with different extremality (i.e. ξ values of 0.09, 0.11, 0.13 and 0.25).
4.4 Sample length sensitivity
Lastly, an analysis of sensitivity to the sample length was conducted to assess whether having a longer precipitation dataset could improve the performance of the WG. Sample lengths of 60, 90 and 120 years were evaluated through 50 realizations for all return periods via Monte Carlo simulations. shows the results for T = 10, T = 50, T = 100 and T = 500 years for scenario 3 (ξ set to 0.11). A slight reduction in both RRMSE and CV is appreciable. In this scenario, having samples 60 years longer is translated into RRMSE reductions of 14%, 14%, 18% and 20% respectively, and similar reductions were obtained in terms of CV.
Figure 8. Box plots of the Monte Carlo simulation from 60-, 90- and 120-year samples – scenario 3 (ξ set to 0.11).
5 Discussion
Recorded precipitation datasets are still too short to provide reliable estimations of low-frequency quantiles. The limited number of extreme events recorded within the available observations makes their adequate estimation difficult with traditional approaches such as statistical or deterministic methods, leading to uncertain quantile estimations. Extending the precipitation records is a widely adopted solution in recent years. WGs are tools capable of extending the existing precipitation records to an unlimited length based on the statistics of the observations. Notwithstanding this, the uncertainty of the estimations will still depend upon the amount of information available. Many applications derived from the use of WGs can be found in the literature nowadays, such as for climate downscaling or for hydrological modelling, by means of feeding hydrological models with the precipitation generated by WGs in what is known as continuous synthetic simulation approach. Although it has been demonstrated that WGs can satisfactorily reproduce ordinary precipitation, the fact that so few extraordinary precipitation events can be found within the available observations makes it difficult for WGs to adequately reproduce extreme events. Thus, low-frequency quantile estimations still present high uncertainties. This uncertainty is even higher in arid and semi-arid climates, where usually these extreme events are of larger magnitude and take place with less frequency.
Many authors have proposed the use of different heavy-tailed distribution functions for modelling the precipitation intensity process, which has been proven to substantially improve the quantile estimations. Others, such as Evin et al. (Citation2018), argue that apart from the available in situ observations, more robust studies are needed to adequately estimate certain WG parameters, particularly when trying to capture extremes. Beneyto et al. (Citation2020) presented a methodology for a better estimation of flood quantiles, where the WG was calibrated with the information obtained from a regional study of annual maximum daily precipitation. They obtained satisfactory results; however, the quantification of the quantile uncertainty reduction was not within the scope of their work. We could find no studies in the literature assessing the uncertainty surrounding the quantile estimations generated by a WG, which is precisely the aim of this work.
Results from show that, in those studies where a regional study of annual maximum daily precipitation is not available (upper plots), quantile estimates tend to be systematically underestimated, especially the low-frequency ones. Incorporating a regional study of annual maximum daily precipitation for estimating certain WG parameters (lower plots) clearly improves the performance of WGs, especially when focusing on extremes, producing a substantial reduction in both CV and RRMSE. This reduction is more evident for scenario 2, which suggests that using a regional for the WG calibration provides better results than using the regional ξ. This result, although not expected, constitutes an advantage, since the possibility of using the regional ξ for the WG calibration is limited to those studies where the WG and the regional study of annual maximum daily precipitation incorporate the E-GDP distribution function.
When no additional information is available, calibrating the WG with the sample , in general, provides better results than leaving the ξ parameter as default; however, the CV increases substantially as a result of the sample variability.
Different calibration values were tested for scenario 2:
(). Given the actual length of the available precipitation records, the usual reliable quantile estimates do not go beyond T = 200 years (in the best case), thus, using
seems to be the most reasonable option to calibrate the WG. Notwithstanding this, the abovementioned calibration
values were tested for the sake of the analysis. It must be taken into account that the calibration
values cannot be considered for comparison since they have been forced to the regional value.
Using for calibration leads to systematic overestimations of all quantile estimates. This is explained by the behaviour of the E-GDP distribution function; changes in the shape parameter ξ translate into increases or decreases of the estimated quantiles at a different rate. Both
and
, however, considerably reduced the RRMSE and CV values of all quantiles, especially for those of high return period. It is worth noting here that a slight underestimation in all
below the calibration quantile is observed. This is explained by the use of a heavy-tailed distribution function (i.e. E-GPD), where it has been demonstrated that these types of distributions perform well for extremes but usually do not appropriately capture low or moderate precipitation events (Caron et al. Citation2009).
performed poorly compared to
and
, slightly underestimating all quantiles and increasing the value of both RRMSE and CV.
Having set scenario 2 as the information scenario providing the best results in terms of reduction of the uncertainty, and as the most reasonable option for a reference quantile, an analysis was conducted of sensitivity to the population extremality. Since parameters
and
were proved to not substantially affect the upper tail of the E-GPD, this extremality was introduced in the synthetic population by means of increasing the value of the parameter ξ {0.09, 0.11, 0.13 and 0.25}. shows the results of the Monte Carlo simulation for each of the synthetic populations. It can be appreciated that both the RRMSE and the CV tend to increase with the value of the parameter ξ, this being more important in the case of low frequency
, which, in line with the conclusions of Breinl et al. (Citation2017), means that the more extreme the climate is, the worse the WG performs. This reinforces the idea that stochastic generation of daily precipitation should be tailored to the climatic conditions (Li and Shi Citation2019).
Additionally, an analysis of the sensitivity to the sample length was conducted. A 30-year period was set as a standard reference period by the World Meteorological Organization (WMO Citation2011), and it has been a common practice to use this in most climate-related studies. However, and as noted previously, WG generation is based on the observed statistics of the available observations, therefore, longer samples should supposedly lead to better quantile estimations (less uncertainty). Since we drew from a 66-year sample, a standard sample length of 60 years was selected for all analysis. Not considering the potential issue of the nonstationarity of longer sample sizes, we repeated the Monte Carlo simulations for three different sample lengths (i.e. 60, 90 and 120 years) for scenario 0 and scenario 3. Although a slight reduction in both RRMSE and CV could be appreciated in the case of scenario 3, while it was imperceptible for scenario 0, no major improvements can be highlighted even after doubling the length of the observations. This, at least for semi-arid climates, means that the 30-years assumption might not be enough to capture normal climate. Incorporating a regional study of annual maximum daily precipitation, however, clearly adds more information in the calibration process than the length of the available observations. Therefore, these results indicate that, even in 50 years’ time, observations on their own will not be sufficient to appropriately estimate extreme precipitation quantiles; other sources of information will still need to be incorporated in the WG calibration process, and regional studies of annual maximum daily precipitation have been proven in this study to be a very good option in this sense.
6 Conclusions
The use of WGs has become a common practice in the hydrological community to extend the available meteorological records. Yet this approach is highly dependent on the available observations, especially in arid and semi-arid climates, due to their characteristic precipitation patterns. The short available records and the high spatio-temporal variability of these extreme events makes it difficult for WGs to obtain reliable low-frequency quantile estimates, since the main source of uncertainty still lies with the amount of information available.
This study presented an analysis of the uncertainty of the quantile estimates generated by a WG in different practical available information scenarios, with the focus on extreme events. An already tested WG that obtained satisfactory results (see Beneyto et al. Citation2020) was selected to undertake the analysis, integrating the different information scenarios by means of modifying the parameter ξ of the marginal distribution function. The aim of the study was to assess not the performance of the WG but the potential reduction in the uncertainty of the higher quantile estimates lying with the available information for the model calibration.
Our results show that, even with WGs incorporating new approaches to better capture extreme events (a heavy-tailed distribution function to model precipitation amounts, in our case), if no additional information is integrated in the model calibration process, low-frequency quantile estimates still present high uncertainty as a consequence of the uncertainty associated with the limited length of the current available records. Using only the available observations led to systematic underestimations of all quantile estimates, which increase with the return period. A different approach when no additional information is available (i.e. calibrating the WG with the sample ) was tested and produced slightly better results, although it retuned high values of CV, explained by the sample variability.
The importance of incorporating additional information in the model calibration when the input data is limited has been demonstrated. Furthermore, calibrating the WG with the regional provided better results than using the population ξ, which represents a clear advantage since the latter is limited to those studies where the WG and the regional study of annual maximum daily precipitation share the same distribution function.
Different calibration values were tested and showed that
was the most appropriate quantile to use. Lower
values led to overestimations of low-frequency quantiles due to the sensitivity of the parameter ξ to the lower quantiles, whereas higher quantiles did not provide a significant reduction in the uncertainty of the estimations.
Moreover, climate extremality was proven to be a key factor in the uncertainty of the quantile estimations, this being more evident for low-frequency quantiles, which evidences the special need to integrate additional information in the WG calibration process in these types of climates (i.e. arid and semi-arid climates), where most of the annual rainfall is concentrated in short extreme episodes, as in the case of the Spanish Mediterranean coast.
Finally, no significant reduction in the uncertainty of the estimations was found when analysing different sample lengths compared to the reduction obtained when incorporating additional information, which means that integrating a regional study of annual maximum daily precipitation provides more information than having an input data series 30 or 60 years longer.
These findings reveal that, independently of the WG, only relying on current or short- and medium-term available observations might lead to systematic underestimations of quantile estimates, especially those associated with low probabilities; therefore, there is an evident need to incorporate further information in the calibration process of the WG when estimating low-frequency quantiles, particularly in arid or semi-arid climates. In this study, it has been demonstrated that integrating a regional study of annual maximum daily precipitation is a good practice to deal with the lack of information of the available observations, providing satisfactory results in terms of reduction of uncertainty of the higher return period quantile estimates.
Disclosure statement
No potential conflict of interest was reported by the authors.
Additional information
Funding
References
- Ahn, K.H., 2020. Coupled annual and daily multivariate and multisite stochastic weather generator to preserve low- and high-frequency variability to assess climate vulnerability. Journal of Hydrology, 581, 124443. doi:10.1016/j.jhydrol.2019.124443
- Ailliot, P., et al., 2020. Stochastic weather generator for the design and reliability evaluation of desalination systems with renewable energy sources. Renewable Energy, 158, 541–553. doi:10.1016/j.renene.2020.05.076
- Ailliot, P., et al., 2015. Stochastic weather generators: an overview of weather type models. Journal de la Société Française de Statistique, 156, 101–113.
- Alfieri, L., et al., 2017. Global projections of river flood risk in a warmer world. Earth’s Future, 5 (2), 171–182. doi:10.1002/2016EF000485
- Beneyto, C., et al., 2020. New approach to estimate extreme flooding using continuous synthetic simulation supported by regional precipitation and non-systematic flood data. Water (Switzerland), 12, 1–16.
- Breinl, K., et al., 2017. Can weather generation capture precipitation patterns across different climates, spatial scales and under data scarcity? Scientific Reports, 7 (1), 1–12. doi:10.1038/s41598-017-05822-y
- Camarasa Belmonte, A.M. and Segura Beltrán, F., 2001. Flood events in Mediterranean ephemeral streams (ramblas) in Valencia region, Spain. Catena, 45 (3), 229–249. doi:10.1016/S0341-8162(01)00146-1
- Caron, A., Leconte, R., and Brissette, F., 2009. An improved stochastic weather generator for hydrological impact studies. Canadian Water Resources Journal, 33 (3), 233–256. doi:10.4296/cwrj3303233
- Chen, J., Brissette, F.P., and Leconte, R., 2010. A daily stochastic weather generator for preserving low-frequency of climate variability. Journal of Hydrology, 388 (3–4), 480–490. doi:10.1016/j.jhydrol.2010.05.032
- Chen, J., Brissette, F.P., and Leconte, R., 2011. Uncertainty of downscaling method in quantifying the impact of climate change on hydrology. Journal of Hydrology, 401 (3–4), 190–202. doi:10.1016/j.jhydrol.2011.02.020
- Chun, K.P., Wheater, H.S., and Onof, C., 2013. Comparaison des projections de sécheresse utilisant deux générateurs de données météorologiques du Royaume-Uni. Hydrological Sciences Journal, 58 (2), 295–309. doi:10.1080/02626667.2012.754544
- Cowpertwait, P., et al., 2013. Regionalised spatiotemporal rainfall and temperature models for flood studies in the Basque Country, Spain. Hydrology and Earth System Sciences, 17 (2), 479–494. doi:10.5194/hess-17-479-2013
- Cowpertwait, P.S.P., 1998. A Poisson-cluster model of rainfall: high-order moments and extreme values. Proceedings of the Royal Society A: Mathematical, Physical and Engineering Sciences, 454 (1971), 885–898. doi:10.1098/rspa.1998.0191
- Dai, C. and Qin, X.S., 2019. Assessment of the effectiveness of a multi-site stochastic weather generator on hydrological modelling in the Red Deer River watershed, Canada. Hydrological Sciences Journal, 64 (13), 1616–1628. doi:10.1080/02626667.2019.1661416
- Evin, G. and Favre, A.C., 2012. Further developments of a transient Poisson-cluster model for rainfall. Stochastic Environmental Research and Risk Assessment, 27 (4), 831–847. doi:10.1007/s00477-012-0612-y
- Evin, G., Favre, A.C., and Hingray, B., 2018. Stochastic generation of multi-site daily precipitation focusing on extreme events. Hydrology and Earth System Sciences, 22 (1), 655–672. doi:10.5194/hess-22-655-2018
- Furrer, E.M. and Katz, R.W., 2008. Improving the simulation of extreme precipitation events by stochastic weather generators. Water Resources Research, 44 (12), 1–13. doi:10.1029/2008WR007316
- Herrera, S., Fernández, J., and Gutiérrez, J.M., 2016. Update of the Spain02 gridded observational dataset for EURO-CORDEX evaluation: assessing the effect of the interpolation methodology. International Journal of Climatology, 36 (2), 900–908. doi:10.1002/joc.4391
- Hundecha, Y., Pahlow, M., and Schumann, A., 2009. Modeling of daily precipitation at multiple locations using a mixture of distributions to characterize the extremes. Water Resources Research, 45 (12).
- IPCC, 2022. IPCC AR6 WGII Sixth Assessment Report.
- Khazaei, M.R., Hasirchian, M., and Zahabiyoun, B., 2021. An improved daily weather generator for the assessment of regional climate change impacts. Theoretical and Applied Climatology, 146 (1–2), 475–487. doi:10.1007/s00704-021-03753-3
- Kotlarski, S., et al., 2017. Observational uncertainty and regional climate model evaluation: a pan-European perspective. International Journal of Climatology, 21, 3730–3749.
- Li, X. and Babovic, V., 2019. Multi-site multivariate downscaling of global climate model outputs: an integrated framework combining quantile mapping, stochastic weather generator and Empirical Copula approaches. Climate Dynamics, 52 (9–10), 5775–5799. doi:10.1007/s00382-018-4480-0
- Li, Z. and Shi, X., 2019. Stochastic generation of daily precipitation considering diverse model complexity and climates. Theoretical and Applied Climatology, 137 (1–2), 839–853. doi:10.1007/s00704-018-2638-7
- Llasat, M.C. and Puigcerver, M., 1990. Cold air pools over Europe. Meteorology and Atmospheric Physics, 42 (3–4), 171–177. doi:10.1007/BF01314823
- Mateu, J.F., 1974. La Rambla de la Viuda. Clima e Hidrología. Vol. 15. Cuadernos de Geografia, 47–68.
- Merz, R. and Blöschl, G., 2008. Flood frequency hydrology: 1. Temporal, spatial, and causal expansion of information. Water Resources Research, 44.
- Naveau, P., 2016. Modeling jointly low, moderate, and heavy rainfall intensities without a threshold selection. Water Resources Research, 52, 2753–2769.
- Papalexiou, S.M., 2018. Unified theory for stochastic modelling of hydroclimatic processes: preserving marginal distributions, correlation structures, and intermittency. Advances in Water Resources, 115, 234–252. doi:10.1016/j.advwatres.2018.02.013
- Papalexiou, S.M., 2022. Rainfall generation revisited: introducing CoSMoS‐2s and advancing copula‐based intermittent time series modeling. Water Resources Research, 58 (6), 1–33. doi:10.1029/2021WR031641
- Papalexiou, S.M., et al., 2018. Precise temporal Disaggregation Preserving Marginals and Correlations (DiPMaC) for stationary and nonstationary processes. Water Resources Research, 54 (10), 7435–7458. doi:10.1029/2018WR022726
- Papastathopoulos, I. and Tawn, J.A., 2013. Extended generalised Pareto models for tail estimation. Journal of Statistical Planning and Inference, 143 (1), 131–143. doi:10.1016/j.jspi.2012.07.001
- Paprotny, D. and Morales-Nápoles, O., 2017. Estimating extreme river discharges in Europe through a Bayesian network. Hydrology and Earth System Sciences, 21 (6), 2615–2636. doi:10.5194/hess-21-2615-2017
- Rajagopalan, B. and Lall, U., 1999. A k-nearest-neighbor simulator for daily precipitation and other weather variables. Water Resources Research, 35 (10), 3089–3101. doi:10.1029/1999WR900028
- Richardson, C.W., 1981. Stochastic modelling of daily precipitation, temperature and solar radiation. Water Resources Research, 17 (1), 182–190. doi:10.1029/WR017i001p00182
- Richardson, C.W. and Wright, D.A., 1984. WGEN: a model for generating daily weather variables. U.S. Department of Agriculture Research and Service, ARS, 8, 235.
- Salazar-Galán, S., et al., 2021. A process-based flood frequency analysis within a trivariate statistical framework. Application to a semi-arid Mediterranean case study. Journal of Hydrology, 603.
- Sharafati, A. and Pezeshki, E., 2020. A strategy to assess the uncertainty of a climate change impact on extreme hydrological events in the semi-arid Dehbar catchment in Iran. Theoretical and Applied Climatology, 139 (1–2), 389–402. doi:10.1007/s00704-019-02979-6
- Sharif, M. and Burn, D.H., 2006. Simulating climate change scenarios using an improved K-nearest neighbor model. Journal of Hydrology, 325 (1–4), 179–196. doi:10.1016/j.jhydrol.2005.10.015
- Vesely, F.M., et al., 2019. Quantifying uncertainty due to Stochastic weather generators in climate change impact studies. Scientific Reports, 9 (1), 1–8. doi:10.1038/s41598-019-45745-4
- Wilks, D.S., 1998. Multisite generalization of a daily stochastic precipitation generation model. Journal of Hydrology, 210 (1–4), 178–191. doi:10.1016/S0022-1694(98)00186-3
- Wilks, D.S., 2009. A gridded multisite weather generator and synchronization to observed weather data. Water Resources Research, 45, 10.
- Wilks, D.S. and Wilby, R.L., 1999. The weather generation game: a review of stochastic weather models. Progress in Physical Geography, 23 (3), 329–357. doi:10.1177/030913339902300302
- WMO, 2011. Guide to climatological practices, Naturaweb.Net.