
ABSTRACT
There is widespread concern about the shortage of secondary school teachers in England. Recruitment to initial teacher training regularly fails to meet its intake targets. The secondary school pupil population is increasing. Teacher vacancies have risen, and more teachers are reportedly leaving the profession prematurely. Despite considerable investment in a wide range of initiatives, costing millions of pounds, the government has acknowledged that it has been unable improve the situation substantially.
This paper presents time-series analyses of official data and documentary analyses of government publications. These suggest that teacher shortages are partly created by government policies themselves - including flaws in the selection system, and school funding system, the official extension of the education and training leaving age, and increases in the number of small schools. It is difficult when planning for teacher supply to anticipate the impact of such varied policy changes years ahead. Consequently, estimations of the numbers needed to be trained are hardly ever accurate.
This paper suggests a reconsideration of the current selection processes for initial teacher training, independent review of the Teacher Supply Model, and a long-term approach to teacher supply planning, considering other policy changes in a more coordinated way.
Introduction
Education systems all over the world strive to provide good quality education for its citizens. To achieve this requires a good supply of qualified and knowledgeable teachers, which has become more difficult in recent times because of challenges in recruiting and retaining teachers. Teacher shortages are a global concern. Many European countries and the US have reported serious shortages of teachers (European Commission Citation2015). Widespread media reports of teacher shortages both in England (Sky News Citation2017; Boffey and Helm Citation2015; Hazell Citation2018a) and the US (Williams Citation2018; Caitlin Citation2017; Passy Citation2018; Strauss Citation2016) have attracted newspaper headlines. The teacher shortage in the US is predicted to get worse because of increasing demands due to rising pupil population and higher teacher turnover. In England the situation has been variously described in the media as ‘alarming’, ‘disastrous’ (Hazell Citation2018b), and “UK’s worst-ever teacher shortage with some even going as far as calling it a ‘catastrophe’ (Hayes Citation2017). In the US a number of states have reportedly issued emergency permits to allow the hiring of untrained teachers to meet the increasing demands (Sutcher, Darling-Hammond, and Carver-Thomas Citation2016). In England, there are growing concerns that the situation is going to get worse as government data (Department for Education [DfE], Citation2016a) shows that teacher vacancies have tripled between 2011 and 2016, and more people are leaving the profession for reasons other than retirement. The demand for secondary teachers is expected to increase in the next two to three decades as pupil numbers grow (DfE, Citation2017a), but the number of teachers recruited has been unable to meet the demand for six years running since 2011/2012 (DfE, Citation2016b). At the same time there are predictions of real term funding cuts for schools (National Audit Office [NAO], Citation2016a). This means that there will be greater difficulties in recruiting the required number of teachers.
As on previous occasions, improvements in the economic and employment cycles, which make teaching a less attractive career, have been suggested as being behind the prevailing shortage of teachers (Dee and Goldhaber Citation2017; Aldeman Citation2015; Ingersoll Citation2011; Hutchings Citation2011; Dolton, Tremayne, and Chung Citation2003). As the Chief Economist at the Education Policy Institute (EPI) put it, ‘it is what you would expect in an economy that has been improving recently with the rate of pay of teachers declining’ (House of Commons Fifth report Citation2017, 7). Relatively poor pay, along with a heavy workload, are often cited as common reasons for teacher shortages (Borman and Dowling Citation2017; Hayes Citation2017; Hobson, Giannakaki, and Chambers Citation2009; Public Accounts Committee Citation2018; Eteach Citation2018; Foster Citation2018).
A standard response to such shortages is the use of incentives, usually financial, to encourage recruitment. Recent incentives introduced in England include bursaries and scholarships for trainees in shortage subjects, the upskilling and training of maths and physics teachers, and schemes to encourage potential teachers especially those in (traditional) English Baccalaureate subjects to return to teaching. Strategies to reduce teachers’ workload, mentoring and tutoring programmes have also been launched to encourage the retention of teachers. Similar initiatives had been used in the past (House of Commons Citation1990, Citation1997) and in other countries (Feng and Sass Citation2015). Most of these have not been evaluated by robust independent trials, and there is no real evidence on whether they worked. In fact, the DfE acknowledged that despite considerable investment in such interventions, they have been unable to solve the problem, or even to improve the situation very much (House of Commons 5th report, Citation2017).
One possible reason why these interventions do not work is that they tend to be based on analyses of short-term data, such as the number of teachers leaving or recruited in a particular year (Bloom Citation2017; Worth and Lazzari Citation2017), or on examining key variables in isolation, such as the number of teacher vacancies (DfE, Citation2018a; Eteach Citation2018; Smithers and Robinson Citation2008). These analyses often link simple changes to the economic and employment cycles and the reportedly poor pay and working conditions of teaching (Dolton, Tremayne, and Chung Citation2003; Worth, Bamford, and Durbin Citation2015; Eteach Citation2018). This approach is interesting, but relying on these kinds of analyses for evidence, tend to lead to policy solutions based on the short-term and directed at economic factors. Hence such policies may be treating the symptoms more than the cause.
Teacher demand and supply could be influenced by a number of factors, such as changes in the birth rates, and the economic context (the relative attractiveness of teachers’ pay and conditions), but also the supply of graduates overall, policy incentives for recruitment and retention, changes in education policies and school organisational structure (such as maximum class sizes, or new small schools). The interactions among these factors can be complex. Some of these factors actually work against each other. For example, reducing class sizes increases the demand for teachers, while education policies such as an increase in tuition fees for higher education (HE) may restrict supply.
This paper re-examines official figures relating to teacher supply and demand in England, such as teacher numbers in relation to pupil numbers, teacher recruitment figures and teacher vacancies to provide possible alternative explanations for the teacher supply ‘crisis’. It suggests some new approaches to addressing teacher shortages.
Data and methods used
This paper uses time-series analyses of government and official statistics to explore the complex interactions among the many variables of both demand and supply. Time-series analyses enable changes in the variables over time to be explored in relation to changes in policy. For example, since 1997 there have been four changes in government in England, and with each came changes in education policies. These policies do not operate in a vacuum and could have implications for teacher recruitment and retention. For this reason the longitudinal data on teacher supply is analysed in terms of reported policy changes during the period.
The issue is examined in stages from the number of pupils and teachers in schools through teacher vacancies and intake targets, to relevant policies and explanation for teacher numbers. This paper focuses more on teacher supply, and retention will be covered more fully in a future paper.
Examining indicators of teacher shortages
Pupil and teacher numbers
One of the most fundamental determinants of the number of teachers needed in any education system is the number of pupils. shows that although pupil numbers fluctuated over the years since 1971, the number of teachers available has tended to keep pace and change in the same manner. In general, changes in teacher numbers are in line with changes in pupil numbers although perhaps lagging behind pupil numbers by a year on occasions. The recent concern, as can be seen from 2014 onwards, was that pupil numbers had started to rise while teacher numbers continue to fall. This seems to support the prevailing story of a teacher supply crisis. However, this may be due to a delay in response to the initial teacher training targets. For example, pupil numbers increased from 2014 onwards, but teacher numbers have not so far. This is because the initial teacher training targets had been revised downwards two years previously, from 13,817 in 2012/2013 to 12,340 in 2013/2014, and so fewer teachers were recruited in 2014/15 – all of this despite a known increase in pupil numbers (see ). In 2007 the reverse happened when pupil numbers fell but teacher numbers continued to rise, and only started to fall in 2010. In 2015, the ITT intake target was increased by 33% from the previous year, and although recruitment increased it did not increase by 33% immediately. In the two subsequent years the number of new entrants struggled to keep pace. Policy changes in teacher training applications and admissions since 2013 may provide an explanation for the slow response to the increase in intake targets. This is discussed in a later section of the paper on alternative explanations for teacher supply.
Figure 1. Number of pupils and full-time equivalent qualified teachers in state-funded secondary schools in England, 1971 to 2017.
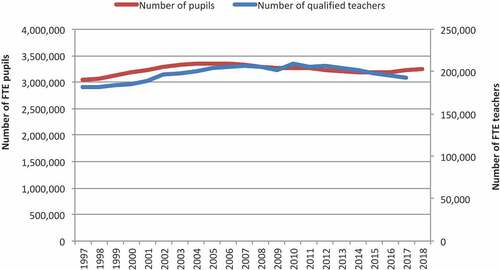
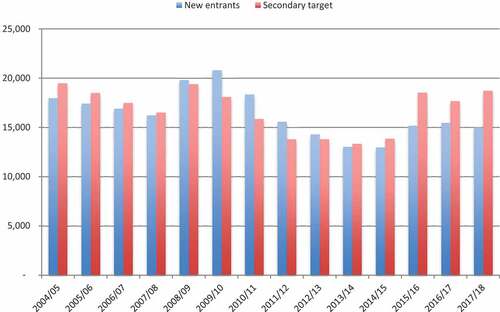
Figure 3. New entrants to secondary initial teacher training programmes, and targets, 2005–2018.
Pupil: teacher ratios (PTR)
These changes can also be portrayed as a pupil:teacher ratio (PTR), also used as common indicator of teacher shortage. Changes in the national PTR are largely due to the differential rates of growth in pupil and teacher numbers, as in , rather than simply a lack or surplus of teachers. From 1971 to 1980, although teacher numbers had increased with pupil numbers, the pupil:teacher ratio (PTR) fell during this period (). In 2004 the PTR reached its highest point at 17.1 before dropping to 15.5 in 2010. The usual economic and employment factors have been suggested as possible explanations. The argument was that the recession that started in 2007 meant that graduates were finding it difficult to find jobs. Teaching was seen as an attractive and more secure option. It was therefore easier to recruit and retain teachers. In reality the fall in PTR during this period was probably at least as much determined by the fall in pupil numbers from 2004, because of the time lag before teacher numbers also began to fall.
Figure 2. Secondary pupil: teacher ratios, 1971–2016.
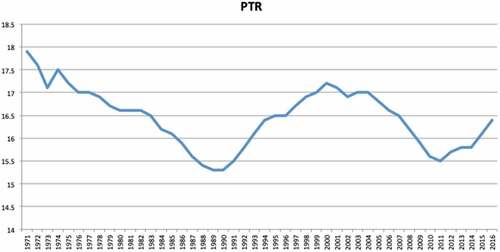
In the past 15 years, the PTR was lowest in 2011, and when it started rising again, this was seen by some as a sign of the beginning of a new teacher shortage, and that as the economy picked up it became more difficult to attract graduates. The economic theory, however, may not hold because the economy actually stalled and went into a double dip recession in 2011/2012 (Pettinger Citation2017). As also shown in , the economic cycle theory does not provide a satisfactory answer because there was actually a drop in teacher numbers between 2007 and 2009 just when the economic recession took hold. Rather, the fall in numbers corresponded with the fall in pupil numbers. In general, changes in PTR were largely due to differential rates of increase or decrease in pupil numbers relative to teacher numbers.
Table 1. Number of secondary schools, pupils and teachers.
Despite media stories about a teacher shortage, the PTR figure in 2016 was still lower than for many of the previous 48 years. Of course, conditions and demands in schools have also changed over time, but at first sight, and based only on pupil numbers, the current teacher shortage may be as much an issue of deployment as of the absolute number of teachers.
Teacher recruitment
Recent concerns about a teacher shortage may have been largely triggered by the difficulty in recruiting new teachers, for training (and thus to schools). By 2017, recruitment into initial teacher training had fallen short of the targets set by the government five consecutive years (most notably in 2015). The number of new entrants exceeded the intake targets from 2008 to 2013, but it continually failed to meet the targets from then onwards ().
The number of entrants to postgraduate secondary teacher training programme generally followed fluctuations in the intake targets (). Recruitment targets fell quite rapidly for several years (from 2008/2009 to 2011/2012) in line with intake targets. Between 2013/2014 and 2017/2018 intake targets were raised, the most dramatic increase was between 2014/15 and 2015/16 (an increase of 33%). Although recruitment had also increased it did not rise as quickly as the targets. The recent recruitment crisis may have more to do with the sudden raising of recruitment targets than simply a shortage of interested graduates. The major change was that the targets increased much faster than the growth of recruits over the last three years.
Intake targets have the habit of going up and down, jumping as between 2007 and 2008 and dropping rapidly from 2008 to 2011 and rising sharply between 2014/15 and 2015/16 before falling again from 2015/16 to 2016/17. Given that the bulk of entrants come from fresh graduates (or from BEd degrees lasting three years to produce), and the proportion recruited into teaching annually is fairly stable, we cannot expect to suddenly produce many extra graduates in one year to meet the increase in targets immediately. It is also interesting to note that the recruitment targets remained the same from 2011 to 2014/15 even though secondary school population was projected to increase between 2016/2017 and 2019/2020. This is perhaps because long-term estimations of numbers of new teachers needed are adjusted on a year-to-year basis. This is too short term.
Although the performance of the economy has again been suggested as an explanation for the difficulty in attracting new recruits, this explanation is not really necessary. Planning three or four years ahead could help ameliorate the discrepancy between targets and recruitment, by allowing phased growth rather than demanding near impossible growth over one year. For the 2018/19 cycle, a permissive approach was adopted allowing the top 25% of initial teacher training providers a guaranteed number of places for a three-year period. This could allow for more long term planning for some training providers. It would be interesting to see the effect of this change on the number of new entrants into teacher training.
Teacher vacancies
Once potential teachers have been trained, they must next join the workforce and be employed as a teacher in a (state-funded secondary) school. The number of advertised teacher vacancies in schools is also often taken as a sign of a teacher shortage. From 2011 to 2014 the number of teacher vacancies rose sharply after years of decline (). This was the cause of much concern even though the scale of demand was nowhere near that in 2001.
Figure 4. Teacher vacancies in secondary state-funded schools – 1997 to 2016.
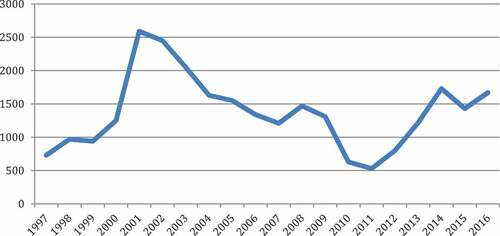
Teacher training recruitment targets are not clearly related in recent years to the balance of teacher vacancies (). From 2005 to 2011, the figures were correlated with R value of 0.92, but from 2012 to 2106 their correlation is on 0.41. While teacher vacancies rose from 2011 onwards, recruitment intake targets did not rise correspondingly, suggesting that teacher vacancies may be an artefact of other factors rather than simply a ‘shortage’ of teachers. In fact, used as a measure of demand, long-term teacher vacancies do not seem to be related either to recruitment or training targets. Vacancies are much more obviously linked to the economic cycle than either targets or teacher numbers (Gorard et al. Citation2006). Following the recession of 2007, money was scarcer and so fewer posts were available in schools. Once the economy started to recover, schools started to advertise for teachers again, and so the vacancy numbers rose ().
Table 2. Secondary teacher vacancies and recruitment intake targets.
In summary, teacher numbers have historically kept pace with pupil numbers, and recruitment to postgraduate initial teacher training has generally responded to changes in intake targets albeit with a lag of two years or more. At time of writing, the number of teachers is still falling while the number of pupils is rising again and this would cause a longer-term problem if the situation continues. The shortfall in initial teacher recruitment is due largely to rapid changes in intake targets, which can vary dramatically from year to year. Recruitment targets have always been planned only on a year-by-year basis, adjusting every year according to the number of pupils needed for the following year. These short-term adjustments in targets create problems. For example, while pupil numbers were projected to increase from 2014 onwards, intake targets had actually been lowered in the three years prior because planning was based only on short-term needs. There have been some changes in 2018 where some ITT providers are allowed unlimited allocations for three years.
As suggested above, the prevailing shortage of teachers may not be just a lack of individuals entering (or staying in) the profession. Some of the problem may in fact be due simply to other policy changes by governments, and the reliance on an imperfect teacher demand and supply model. The next section looks at some of the alternative explanations for teacher shortages.
Alternative explanations for teacher supply
Inadequate teacher supply model (TSM)
In England, the Department for Education (DfE) uses a statistical model – the Teacher Supply Model (TSM) – to estimate the number of teachers needed each year, and to inform funding allocation and the number of places (or targets) for Initial Teacher Training (ITT) one year in advance (Roberts and Foster Citation2017). TSM is the equivalent of the TSDQ (Teacher Supply Demand and Quality) project models used in the US and other countries to estimate the number of teachers needed in a given year. TSM is based on a number of assumptions, such as the predicted number of pupils and the economic conditions, as well as how schools might react to these. Such factors are difficult to predict with certainty, and are usually beyond the control of the government. The TSM does not take into account regional needs, and issues of deployment, and this is a major weakness in practice.
The TSM calculation of teacher numbers is based on the School Workforce Census, which is a snapshot measure carried out in November (from 2010 onwards), and therefore too late to influence recruitment for that academic year (House of Commons Citation2017). According to the General Secretary of NAHT (National Association of Head Teachers), this process may underestimate the number of teachers needed as schools would have filled their September vacancies by using unqualified or supply teachers as a stopgap measure, because classes cannot be allowed to run from the prior September without a teacher (House of Commons Citation2017).
Estimating the number of teachers is anyway made more difficult because of issues of data quality. Some of these were outlined in the School Teachers’ Review Body 26th report (Citation2016). For example, in 2013 there were 192 schools employing 4,800 teachers that did not make returns. These schools were therefore not included in the estimation (School Teachers’ Review Body Citation2016). There were also teachers previously in continuous service who were treated as having left because they were missing from one year’s service. To avoid systematically over- or under-estimating the number of entrants and leavers, schools that failed to provide a census return for two consecutive years were excluded from the calculations. Schools were also excluded where their numbers had changed by 20% or more from year-to-year. These tended to be schools that had difficulties making returns because of changing IT systems, or when making their first returns. The combined effect meant that about 5% of teachers were excluded in any one year. Therefore, using the TSM to determine teacher numbers can be problematic. This provides a partial explanation for teacher shortages because if the forecasts are not accurate, the number of teachers needed to be trained is likely to be somewhat out of proportion to the actual demand.
Other factors that can influence teacher demand and supply can be the direct result of government policy decisions, of a kind which could not be accurately predicted by the TSM. This is because although modelling for teacher supply has to make a number of assumptions based on these policy changes, this is often not possible in practice. These assumptions could only be built into the model when policy decisions have been confirmed. Where they are not confirmed, planning has to be based on a range of scenarios and a central estimate is often created and used (DfE, Citation2017c). The NAO analysis suggests that these scenario-based estimations can vary between 25,000 and 38,000 in total number of teachers (NAO Citation2016b). And situations like an unexpected election can change policy very quickly. But even if the number of new teachers required could be accurately predicted, it is not possible to increase the number of graduates within a year since estimations are planned only one year in advance. Time is needed for the growth of graduates to meet the increasing demand. Thus teacher shortages can be at least partly created by government policies – more so than the mere increase in pupil population. Government policies often do not seem very coordinated. One set of policies may increase demand for teachers while another well-intended change may actually reduce the supply. Although no one factor alone can be responsible for the teacher supply crisis, taken together they can exert considerable influence. These factors are rarely, if ever, discussed in relation to teacher shortages.
Other education policies influencing teacher demand
School funding
One important factor influencing teacher vacancies is school funding. In England, teacher vacancies are defined in terms of the number of posts advertised. With more money schools can hire more teachers, so demand for teachers, and hence advertise teacher vacancies. For example, when the Labour government came into office in 1997, education became a declared a priority, and increased investments were made in education. Spending per pupil grew rapidly from 1999 onwards with the biggest increase between 2000 and 2001 at 110 real terms index (). This was also the period which saw a sudden increase in advertised teacher vacancies from 1,250 in 2000 to 2,590 in 2001 (an increase of 107%).
Table 3. Funding per pupil in secondary maintained schools in England.
In 1996 and 1997 when there was a budgetary cut, 36.7% of schools surveyed reported having to reduce staffing, with 43.6% saying they may have to do so the following year (House of Commons Citation1997, Appendix 15). It was calculated that such reductions amounted to a loss of 0.7% teachers per school. Funding available and the number of teachers sought are clearly related.
The current teacher shortage is perhaps therefore partly a consequence of funding reforms. Under the Coalition government from 2010 a number of education reforms were introduced in 2011, one of which was the Pupil Premium, which allocates additional money to schools to support disadvantaged pupils. Local authorities were required to direct all the money they received through the Direct Schools Grant to schools with a few exceptions. Secondary schools with high proportions of pupils from low income families gained an additional 4.3% funding in 2012/13 compared to 2009/10 (Lupton and Thompson, Citation2015). The definition of disadvantage has also changed to include a wider range of pupils. This raised the amount of spending on Pupil Premium from £0.9bn in 2011/12 to £1.25bn in 2012/13, with a projected rise to £2.5bn by 2014/2015 (Jarrett, Long, and Foster Citation2016). ‘Disadvantaged children’ includes those who have been eligible for Free School Meals (FSM) in the past 6 years (not just those currently eligible), and looked after children. It also includes armed forces children, and those whose parents have died in service (DfE Citation2014). As a result, some schools now receive more money than before. Small schools serving rural areas also receive extra funding. For the secondary sector, the less deprived schools experienced real term losses of 2.5%, while the most deprived schools gained 4.3% in real terms income. With more money, some schools were able to hire more teachers leading to higher teacher vacancies (See Citation2011; See, Gorard, and White Citation2004). This may explain the rise in teacher vacancies between 2011/12 and 2013/14 (as seen in ).
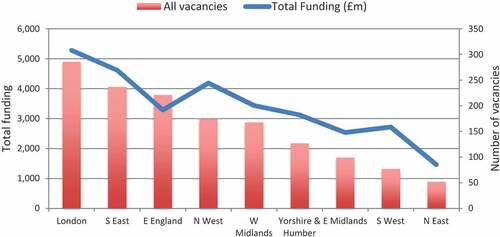
The relationship between teacher vacancies and school funding is clearer if we look at teacher vacancies at the regional level. shows that regions with high teacher vacancies such as London are also regions receiving the highest funding. The reverse is true of the North East and the South West, with the exception of East England where the number of vacancies is higher than funding suggests. One possible explanation for this could be the difficulties in recruiting teachers because of the lack of training places (NAO, Citation2016b; The Royal Society Citation2007, Figures 4.1 and 4.2). Further exploration is needed to understand this local phenomenon, which is outside the scope of this paper.
Figure 5. Total funding and teacher vacancies by regions, 2015.
Number and size of schools
Changes in the number and size of schools can also have implications for teacher vacancies. This factor is rarely if ever considered in policy discussions on teacher supply. Since 2011 the number and type of schools have increased. This period saw the introduction of Free Schools, Studio Schools, University Technological Colleges and increasing number of academies. This encouraged growth in the number of small schools like Free Schools, which are not always in areas of greatest demand for places. Although small in total number new schools create a high demand for teachers as they need the full complement of staff almost from the outset. This increases the demand for teachers. The long-term trend shows a close relationship between the number of schools and the number of teacher vacancies ().
Figure 6. Number of state-funded secondary schools, and teacher vacancies, 2002 to 2016.
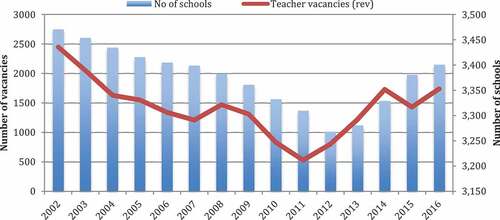
The government’s decision to increase the number of satellite grammar schools and free schools (DfE, Citation2018b) may exacerbate the teacher supply crisis further. The longer-term impact of this policy is yet to be seen, but if the trend continues as shown in , the situation is likely to worsen.
Extension of the education and training leaving age
The extension of the education and training leaving age from 16 to 17 in September 2013 and then to 18 from 2015 meant that more students now tend to stay in school for longer. The DfE forecast secondary school pupil numbers to rise by 7% (276,000) between 2014/15 and 2019/20 (NAO, Citation2016b). This means that more teachers were needed to cater for these students who may previously have left the system. Yet, recruitment targets for secondary initial teacher training were not raised four years prior to this policy announcement, as would surely have been needed, because a different administration was in power, and because pupil numbers were failing at that time (as seen in ). Yet neither did the new administration announce the new policy far enough in advance to permit the recruitment of sufficient new teachers. Trainee targets were raised only in 2015 the year when pupil numbers in each age cohort were expected to rise anyway.
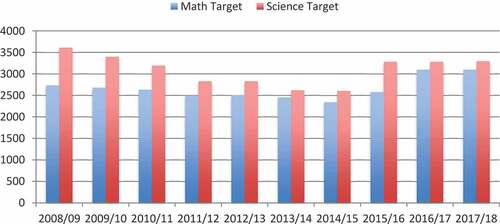
The recruitment targets were reduced from 2010 onwards for shortage subjects like maths and science despite the increase in teacher vacancies during that period (). Because the TSM could not react to such changes in policy years ahead there was a mismatch between demand and supply. As a result the recruitment targets were behind demand.
Figure 7. Initial teacher trainee targets for maths and science.
Changes to the curriculum
Policy changes in curriculum are also likely to affect the demand for teachers. One such policy was the introduction of the English Baccalaureate (EBacc) in 2010. This award requires secondary pupils to take five EBacc subjects including English, maths, the sciences, one humanities (history or geography) and a language. This is expected to include 90% of the pupils by 2025.
This policy clearly has the effect of increasing the demand for teachers in traditional shortage subjects, such as maths and the sciences. Policy changes in the maths curriculum, the introduction of the new GCSE (General Certificate for Secondary Education), and the removal of the option to take Core Science from 2016 meant that some pupils would have to take two instead of one science subjects at GCSE. All these would increase the number of teaching hours for teachers and hence demand. But as with new schools policy, and extending the leaving age, this new policy provided no time (or planning or funds or initiatives) for the required new teachers to be recruited.
Teaching is already taking a large proportion of graduates. Luckily the number of graduates in shortage subjects has been increasing over time. However, according to the 2016 HESA data, if the target for initial teacher training in maths were to be met 40% of maths graduates would still have to have been recruited (), and over a quarter of science graduates for recruitment to science (). And these are subjects where there is reported unmet demand from industry and other employers as well. So unless the number of home domiciled undergraduates in the so-called shortage subjects is increased even further, or intake targets are lowered, then recruitment into teacher training is likely to fall short in the years to come.
Table 4. Number of home domiciled first degree qualifiers (Maths).
Table 5. Number of home domiciled first degree qualifiers (Science).
Policies affecting the supply of teachers
While some government policies have indirectly led to an increase in the demand for teachers, as illustrated above, other policies have the effect of suppressing the supply of teachers.
Admissions policy to higher education institutions
Reports of the recent teacher supply crisis in England started in 2014/2015 when initial teacher training recruitments had failed to meet secondary subject intake targets for three consecutive years since. Secondary physics and maths remained the most difficult subjects to recruit to with 29% of training places apparently unfilled (NAO, Citation2016b). A combination of reasons was suggested for this shortfall, such as the discontinuation of paying teachers’ tuition fees, and the economic recovery. What is less often discussed are admissions policies to higher education, which can have a real and relatively quick impact on the number of teachers trained.
In England the number of people recruited into teacher training is in many ways artificially controlled by government policy interventions. Since 2013 the number of routes to teacher training has increased. There are now eight main routes into teacher training. These are university-led postgraduate and undergraduate, School Direct (SD) fee paying and salaried, School-Centred Initial Teacher Training (SCITT), Teach First, Troops to Teachers and Researchers in Schools. Traditionally, initial training for secondary school teachers was undertaken via university-led postgraduate courses. In 2013, the number of places allocated to SD (where trainees receive their training in schools) was increased. This was a decision by the then education secretary to give schools greater control over the recruitment and retention of teachers. However, SD was reportedly unable to fill a large number of places, leading to schools having to return their allocations to the National College of Teaching and Leadership (NCTL) – an agency for the DfE whose function was to ensure a provision of sufficient number of qualified teachers and maintain the quality of the teaching profession with oversight of the training of teachers.
At the same time, universities had to turn away qualified applicants because NCTL refused to increase the limited number of places offered to universities (Universities UK Citation2013). In the 2015/16 cycle universities were allowed to recruit only up to 75% of capacity (NAO, Citation2016b) although this rule has now been relaxed. NCTL also did not allow allocations to be transferred between routes and subjects (NAO, Citation2016b; Universities UK Citation2013). This meant that the unfilled places for School Direct could not be taken up by universities even where they clearly had spare capacity.
Additionally, there was a mismatch in terms of recruitment dates. School Direct applications ended at the end of the school term, but universities were still receiving applications after this date (Universities UK Citation2013). However, because of the reduced number of places given to universities they were not able to take in any more applications. Universities UK reported that 37% of science and 26% of maths applications to universities were received after 15 July (the closing date for School Direct applications). This meant that a large number of potential trainees were turned away at the first hurdle. All of this shows that any teacher shortages are not necessarily a case of people not wanting to go into teaching, but rather a result of uncoordinated and really rather incompetent policy decisions.
On top of this, admission into teacher training was made more difficult with the raising of the minimum entrance requirements (sensible though such measures might be in isolation). Since 2013 applicants had to pass tests in literacy and numeracy before they can start training. The limitation to only three re-sits in these tests per candidate means that those who fail would drop out before they even start training (DfE, Citation2012). And they have to wait for two years before they could have another go. Candidates also have to show evidence of applying for training before they could take the test, and this incurs a £24 fee. Some postgraduate trainees also need to take a Subject Knowledge Enhancement course (SKE) before commencing training. But places available for SKE are announced later in the recruitment cycle. This means that ITT providers are unable to make firm offers to these people before the end of the cycle (Universities UK Citation2014). Research in the US (Podolsky et al. Citation2016; Levin and Quinn Citation2003) found that late hiring had a detrimental effect on candidates’ decisions to accept job offers. By the time offers are made these qualified candidates may have accepted job offers or training positions elsewhere.
At the time of writing, the limit on the number of attempts for the skills test has been removed, and the first three attempts are now free (DfE Citation2018d). The application cost to postgraduate teacher training has now been reduced to £1 for the 2018 applications (Universities and Colleges Admissions Service [UCAS], Citation2018). In the 2017/18 cycle of recruitment, such caps were removed for category 3 subjects (traditionally hard-to fill subjects like maths and physics) for all providers (Roberts and Foster Citation2017) and apparentlyall caps are now removed except for PE and primary trainees. However, NCTL said that they would still ‘intervene to ensure that the proportion of trainees in school-led provision grows compared to 2015/16, by stopping university recruitment if it reaches a certain level’ (NAO, Citation2016b, section 3.9, p. 40). They may also intervene to prevent any provider from growing beyond their share in certain regions (NCTL, Citation2016). It is obvious that such interference over the numbers applying for teacher training can limit the supply of teachers.
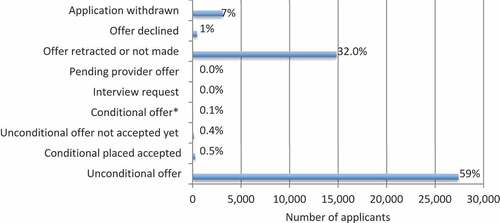
According to the Carter Review, an independent review of Initial Teacher Training (ITT) courses (DfE, Citation2015), potential applicants also found the variety of routes to initial teacher training confusing. Reportedly this had put some off applying. UCAS data for 2014 to 2016 show that under 60% of applicants were accepted over the four-year period from 2014, the period when talks of a teacher supply crisis began (). shows that less than 30% of all applications in 2017 were successful across all subjects. A large proportion of applicants (32%) were not accepted because they did not meet the conditions of their offer ().
Figure 8. Applicants and acceptances to all ITT courses for England and Wales, 2014–2017.
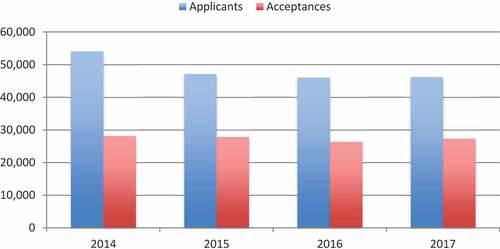
Figure 9. Acceptance rates by subjects for 2017.
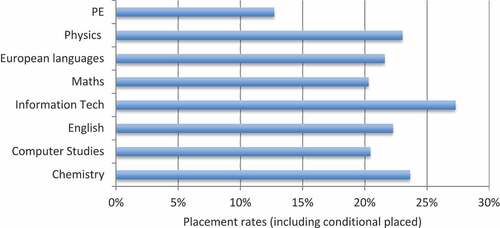
Figure 10. Applicants’ application outcomes for all ITT courses (2017).
shows the number of applications and acceptances to initial teacher training courses in England for the secondary sector only. For the 2017 cycle, a large proportion of applications were rejected, did not lead to an offer, or applicants withdrew their applications. Only 21% of all applications were successful.
Table 6. Number of applications and acceptances to secondary ITT by each training programme type for England only, 2017.
A report commissioned by NCTL (Matthias Citation2014) provided some anecdotal evidence suggesting that the common reasons for withdrawal or rejection from application were financial barriers, candidates applying to routes for which they were ineligible and unavailability of training schools within commuting distance from home. In England, for some routes such as School Direct, applicants have to find a training school before they can be accepted into training, but not all schools can offer training places. Only schools that are judged as ‘good’ or ‘outstanding’ by Ofsted (National College for Teaching and Leadership Citation2015) are accredited. Applications can be rejected if candidates cannot find a school to do their training. If true, this means that a very large proportion of potential or aspiring teachers are being needlessly rejected and so wasted by the system set up to recruit them.
Selection practice by teacher training providers
While it is true that the high rejection rates may be due to a number of unsuitable applications, perhaps especially in some subjects, it is also the case that a large number may be rejected because of the stringent demands by DfE and Ofsted. For example, applicants applying to teach biology are required to have high level physics and chemistry qualifications. Teacher training providers are also assessed on their recruitment and completion rates by Ofsted (Office for Standards in Education), which leads to risk-averse practices. It is possible that training providers select applicants on what they think would be the likely end results. ITT providers therefore have to be wary of who they select as they could lose their guaranteed allocations or damage relationship with schools if unsuitable/uncommitted candidates were selected. They are therefore less likely to accept applicants that they are not sure about. In the 2018 recruitment cycle over 80% of applications to shortage subjects like maths and physics were rejected despite the removal of the cap on the number of teachers to be trained (Ward Citation2018). shows that London receives the highest number of applications but it has the lowest acceptance rate (17%). This suggests that it is not the relative poor pay and unattractiveness of teaching that put people off wanting to go into teaching. London is the most expensive area to live in. The DfE has suggested that teacher training providers were overly selective (H. Ward personal communication, 22 May 2018), but this may simply be because they had to protect the reputation of the institution since they are being judged on their success rates, which could affect the number they are allowed to recruit the following year. Such wastage in the system at a time when there is a high demand for teachers is difficult to understand. This is an area that needs further exploration – to understand why candidates were rejected. The current selection process is like a ‘black art’ because the selection criteria are never very explicit.
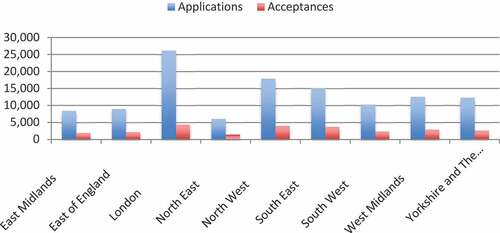
Figure 11. Applications and acceptances by regions, 2017 cycle.
Unequal distribution of initial teacher training providers
Some commentators have argued that the shortage of teachers in some areas is in some way related to the uneven distribution of ITT (Initial Teacher Training) providers. Although the number of ITT providers had increased in recent years these were not necessarily in areas of greatest demand for more teachers (House of Commons Citation2016; ). ITT providers tend to be concentrated in urban areas such as London (NAO, Citation2016b Fig 21). Referring back to shows that the number of vacancies in the East of England is higher than the funding levels suggest. This is probably because, as Howson (Citation2017) pointed out, there are fewer teacher training providers in the East of England and thus the region has greater difficulties in attracting new teachers. Also, schools which are not doing well are not allowed to offer training courses, thus making it even more difficult for them to recruit teachers (NCTL 2015). This put another layer of barriers to potential candidates especially in places where teachers are most needed (NAO Office, Citation2016b).
Undergraduate tuition fees reform
The introduction of the undergraduate tuition fees reform which raised tuition fees to £9,000 in 2012/13 at a time when teacher vacancies were rising and demand for teachers increasing was described as a ‘significant dampener’ according to Carter (Citation2017). Universities UK (Citation2015) reported a significant fall in Other Undergraduate entrants (44.6%) between 2004/05 and 2013/14 for full-time entrants and 52.7% for part-time entrants during this period. In 2016 the maintenance grants for undergraduates in England was scrapped, and the cap on tuition fees was raised from 2017/18 to allow fees to increase with inflation. Such policy changes are likely to have an effect on teacher recruitment, perhaps especially from, and in, disadvantaged areas. .
Discussion
What are the problems?
It is clear from this reanalysis of official data and review of reports by experts and other independent bodies that workforce planning is complex, and that the teacher supply ‘crisis’ is more than just about pupil and teacher numbers. Teacher supply is subject to political interference (See, Gorard, and White Citation2004). While one set of policies might act to increase demand another suppresses supply. Policies to increase the number and diversity of schools, school funding reforms, the extension of school and training leaving age, the introduction of the English Baccalaureate and changes in the GCSE curriculum can have the effect of increasing the demand for teachers. But policy reforms on initial teacher training, raising the tuition fees and the removal of education grants, on the other hand have been artificially restricting the supply of teachers. This is absurd.
The TSM, however, is not able to respond to such policy changes years ahead, and thus planning a teaching supply pipeline is difficult. Artificially setting the numbers to be trained using a model that is based on a number of unlikely assumptions is always likely to be problematic.
Furthermore, other factors impacting on teacher supply are also missing in the estimation. UCAS data for 2007 to 2017 shows that between 41% and 61% of all applicants to postgraduate initial teaching were unplaced/withdrawn (Graduate Teacher Training Registry [GTTR], Citation2013; Universities and Colleges Admissions Service (2014, 2015, 2016) Citation2017). This was even worse than in 2002 where 49% were denied places (White, Gorard, and See Citation2006). And only 11% of teachers on the Return to Teaching scheme secured teaching jobs. Email communication with TES (Times Educational Supplement), who interviewed teacher training providers, suggested various reasons for low acceptance rates, the main reason being that candidates were deemed unsuitable for teaching (H. Ward personal communication, 22 May 2018). Because training providers are assessed based on their success rates it encourages them to accept only candidates judged to have a greater chance of completion. These are complexities in the recruitment process that have not been integrated into models of teacher supply. All of this suggests that the prevailing teacher supply problem is not simply a lack of willing numbers. Unless these different government policies affecting demand and supply of teachers are considered, initiatives to improve recruitment and retention are not likely to be effective in solving staffing problems.
Proposed solutions
A more joined-up policy decision within the dfe
One of the problems identified in this paper is the lack of coherence within the government. Policies that have an impact on teacher demand are often made independently of other policies that can have the opposite effect of suppressing supply. For example, stricter admissions criteria into teacher training were introduced and the quota for the number of trainees for HEIs was lowered at about the same time as the new curriculum (e.g. GCSE Science), the EBacc and extension of education leaving age were introduced. A more coordinated approach to policy-making is clearly needed. Preparatory measures should be taken before any major reforms are implemented. As the Public Accounts Committee (Public Accounts Committee Citation2016, 3) report suggested, the government’s approach was ‘reactive and lacks coherence’ and ‘shows no sense of leadership or urgency in making sure there are sufficient new teachers to meet schools’ future needs.’
Therefore, policy reforms that could have an impact on teacher demand should take into account the supply end of the pipeline. Planning may have to be made at least three years ahead to allow for growth in number of graduates and to allow for adjustments to ITT intake targets, to cope with any future increase or decrease in demand.
Remove planning for teacher supply from politics
Related to the first point is the need for longer term planning of teacher supply. Although the DfE does have a 10-year forecast, it cannot anticipate policy changes that are susceptible to changes in government. Estimating accurately the number of teachers needed each year is thus difficult, if not, impossible. Because planning for teacher supply has always been tied to politics it rarely plans beyond four years since governments do not generally know if they will still be in power after four years. Political agenda can also change according to the changing philosophy of whoever is in charge at the time. Therefore, planning for teacher supply should not be a political but a national decision. This could ensure some stability making long-term planning feasible.
Independent evaluation of the TSM
While the Teacher Supply Model has its strengths, it has not been able to predict accurately the number of teachers needed (NAO Citation2016b) and does not account for local and regional demands (NAO Citation2016b). So far no evaluation has been carried out to examine the effectiveness of the existing model and how it could be improved. Perhaps an independent evaluation of the model is needed.
Re-think the ITT application and selection process
Currently, more applicants are being rejected than accepted before they even start training, and it is not even clear what the selection criteria are. Perhaps a universal minimum criteria, in terms of academic qualifications or experience, could be used for entry into all initial teacher training (to avoid disparity in terms of quality of applicants), and selection criteria via interviews could be made more explicit. Perhaps an investigation into the selection process practiced by teacher training providers could be carried out to understand the reasons for the low success rate among applicants. The current selection process for initial teacher training could be radically revised with selection taking place at the end of the training, and trainees with potential identified for in-school internship where they spend a year practicing teaching under a mentor. This makes for more accurate assessment of the candidates’ potential or suitability to teach.
A central application system could be introduced where graduates apply to teach in schools and allocation to schools is made centrally, as has been tried in countries like France and Singapore. This can help ease regional recruitment shortages. Schools will be allocated the number of newly trained teachers according to their needs. This also avoids the situation where trainees’ offers have to be retracted because they could not find placements in schools. At the end of the training, schools can then apply for the trainee to stay on in the school or not.
Ways could be devised to simplify the application process to reduce the likelihood of applicants applying for the wrong course.
Rather than screening at the time of hire, the evidence on heterogeneity of teacher performance suggests a better strategy would be identifying large differences between teachers by observing the first few years of teaching performance and retaining only the highest-performing teachers (Staiger and Rockoff Citation2010).
Review of policies on ITT
There have hitherto been no independent impact analyses of many of the key policy initiatives. For example, the removal of the cap on tuition fees especially for postgraduate teaching training, which incurs an additional year of study, may be a deterrent for potential teachers. This has not been evaluated properly. There have also been no evaluations of the impact of the stricter criteria for admissions (e.g. limit on the number of professional tests that can be taken and the need to pass the test before training), the changes in the number of training places for teacher training providers, and the Subject Knowledge Enhancement course. Now that these entry criteria have been revised, whether they have led to an improvement in recruitment has yet to be seen. And whether these have an impact on the quality of teachers also needs to be evaluated. A wider debate on these issues would be welcome.
Robust evaluations of recruitment incentives
There have also been no robust evaluations of the many strategies used to tackle the teacher supply issue. These are costly and should be carefully evaluated to determine those that have promise of success so that the less effective ones could be discontinued. Robust and independent impact evaluations of policy initiatives are needed before more investments are made and further interventions introduced. Despite no impact evaluations being conducted on such incentives, they have been employed every time there is a shortage of teachers.
Conclusion
The issue of teacher supply is complex and the aim of this paper is to take one aspect of the debate – the influence of politics – to highlight the need to include policies in the discussion of teacher supply and demand. Uncoordinated policies need to be taken into account when tackling teacher shortages. Although the policies discussed here relate to England because the data is specific to England, similar issues are experienced elsewhere in other countries and in other professions, and some lessons can be learnt for all of these contexts. The principles of analyses that involve evaluations of policies that affect initial teacher training, and structural changes such as reduction in class sizes or pupil:teacher ratios, school numbers, changes in the curriculum and school funding are relevant to other contexts facing similar problems. Our analysis of the current situation in England can be applied to other countries in providing a better understanding of the causes of teacher shortages. Hopefully, this paper will lead greater public debate and awareness of the role of government policy as an important contributing factor to the teacher supply issue.
Disclosure statement
No potential conflict of interest was reported by the authors.
Additional information
Funding
Notes on contributors
Beng Huat See
Dr Beng Huat See is Associate Professor at the School of Education, Durham University, and a Fellow of the Durham University Evidence Centre for Education (DECE) - https://www.dur.ac.uk/dece/. Professor Stephen Gorard is Director of DECE, and a Fellow of the Academy of Social Sciences.
References
- Aldeman, C. 2015. “Teacher Shortage? Blame the Economy.” Education Next. October 8. http://educationnext.org/teacher-shortage-blame-the-economy/
- Bloom, A. 2017. “Teacher Training Numbers Plummet for Shortage Subjects.” Times Educational Supplement, January 5. https://www.tes.com/news/school-news/breaking-news/teacher-training-numbers-plummet-shortage-subjects
- Boffey, D., and T. Helm. 2015. “Shortage of Teachers Set to Spark New School Crisis.” The Guardian, August 29. https://www.theguardian.com/education/2015/aug/29/shortage-teachers-new-schools-crisis-uk-trainee-shortfall
- Borman, G., and N. Dowling. 2017. “Teacher Attrition and Retention: A Meta-Analytic and Narrative Review of the Research.” Review of Educational Research 78 (3): 367–409. doi:10.3102/0034654308321455.
- Caitlin, O. 2017. Schools Throughout the Country are Grappling with Teacher Shortage. https://edition.cnn.com/2017/08/21/health/teacher-shortage-data-trnd/index.html
- Carter, J. 2017. Whither Teacher Training. HEPI Report 95. Oxford, England: Higher Education Policy Institute.
- Dee, T., and D. Goldhaber. 2017. Understanding and Addressing Teacher Shortages in the United States: The Hamilton Project. Washington, DC: Brookings.
- Department for Education. 2012. New Tougher Tests for Trainee Teachers. London, England: DfE. https://www.gov.uk/government/news/new-tougher-tests-for-trainee-teachers
- Department for Education. 2014. Fairer Schools Funding: Arrangements for 2015-2016. London, England: DfE. https://www.gov.uk/government/uploads/system/uploads/attachment_data/file/332652/Fairer_schools_funding_aarrangements_for_2015_to_2016.pdf
- Department for Education. 2015. Carter Review of Initial Teacher Training (DFE-00036-2015). London, England: DfE.
- Department for Education. 2016a. School Workforce Census. London: DfE.
- Department for Education. 2016b. Initial Teacher Training (ITT) Census: 2016-2017. London, England: DfE.
- Department for Education. 2016c. Schools, Pupils and Their Characteristics. London, England: DfE.
- Department for Education. 2017a. School Workforce Census. London, England: DfE.
- Department for Education. 2017b. Initial Teacher Training (ITT) Census: 2017-2018. London, England: DfE.
- Department for Education. 2017c. Postgraduate Initial Teacher Training Places and the Teacher Supply Model, England (2017/18). London, England: DfE. https://assets.publishing.service.gov.uk/government/uploads/system/uploads/attachment_data/file/655038/SFR42_2017_TSM_Main_Text.pdf
- Department for Education. 2018a. Factors Affecting Teacher Retention: Qualitative Investigation. Research Report. London, England: DfE. https://assets.publishing.service.gov.uk/government/uploads/system/uploads/attachment_data/file/686947/Factors_affecting_teacher_retention_-_qualitative_investigation.pdf
- Department for Education. 2018b. Schools that Work for Everyone: Government Consultation Response. May 2018. London, England: DfE. https://assets.publishing.service.gov.uk/government/uploads/system/uploads/attachment_data/file/706243/Schools_that_work_for_everyone-Government_consultation_response.pdf
- Department for Education. 2018d. Measures Announced to Ensure Talented Trainees Get into Teaching. London, England: DfE. https://www.gov.uk/government/news/measures-announced-to-ensure-talented-trainees-get-into-teaching
- Department for Education and Skills. 2002. Departmental Annual Report. London, England: Stationery Office.
- Department for Education/Department for Business Innovation and Skills. 2012. The National Archive: Schools, Pupils and Their Characteristics. http://webarchive.nationalarchives.gov.uk/20120506052914/http://www.education.gov.uk/rsgateway/sc-schoolpupil.shtml
- Dolton, P., A. Tremayne, and T. Chung. 2003. The Economic and Teacher Supply. A Paper Commissioned by the Education and Policy Division, OECD for the Activity Attracting, Developing and Retaining Effective Teachers. Paris, France: OECD.
- Eteach. 2018. Attract, Recruit, Retain: Teacher Recruitment for a Modern Education. The Eteach Report 2017-2018. Camberley, Surrey: Eteach.
- European Commission. 2015. Joint Report of the Council and the Commission on the Implementation of the Strategic Framework for European Cooperation in Education and Training (ET (2020). Brussels: European Commission. Accessed August 16, 2018. http://ec.europa.eu/dgs/education_culture/repository/education/documents/et-2020-draft-joint-report-408-2015_en.pdf
- Feng, L., and T. Sass 2015. “Financial Incentives to Promote Teacher Recruitment and Retention: An Analysis of the Florida Critical Teacher Shortage Program.” SREE Conference, Spring. https://files.eric.ed.gov/fulltext/ED562333.pdf
- Foster, D. 2018. Teacher Recruitment and Retention in England. Briefing Paper Number 7222. London, England: House of Commons Library.
- Gorard, S., B. H. See, E. Smith, and P. White. 2006. Teacher Supply: The Key Issues. London: Continuum.
- Graduate Teacher Training Registry (2013) Graduate Teacher Training annual statistical report 2013. London, England: GTTR
- Hayes, P. 2017. “Five Reasons for UK’s Worst Ever Teacher Shortage.” Huffpost, February 26. http://www.huffingtonpost.co.uk/patrick-hayes/teacher-shortage_b_9319692.html
- Hazell, W. 2018a. “Senior DfE Official: Teacher Supply Problems ‘Very Severe’ and Getting Worse.” Times Educational Supplement. https://www.tes.com/news/senior-dfe-official-teacher-supply-problems-very-severe-and-getting-worse
- Hazell, W. 2018b. “‘Alarming’ New Stats Show Teacher Recruitment down by a Third.” Times Educational Supplement. https://www.tes.com/news/alarming-new-stats-show-teacher-recruitment-down-third
- Hobson, A., M. Giannakaki, and G. Chambers. 2009. “Who Withdraws from Initial Teacher Preparation Programmes and Why?” Educational Research 51 (3): 321–340. doi:10.1080/00131880903156906.
- House of Commons. 1990. The Government Response to the Second Report from the Education, Science and Arts Committee Session 1989-90. The Supply of Teacher for the 1990s. London, England: HMSO.
- House of Commons. 1997. Education and Employment Committee First Report. Teacher Recruitment: What Can Be Done? Vol. II. London, England: Stationery Office.
- House of Commons (2016). Training new teachers. Third Report of Session 2016-2017. London, England: House of Commons.
- House of Commons. 2017. Recruitment and Retention of Teachers. Fifth Report of Session 2016-17 (HC199). London, England: House of Commons.
- Howson, J. 2017. “Free for All ITT [Web Log Post].” https://johnohowson.wordpress.com/tag/teacher-shortages/
- Hutchings, M. 2011. What Impact Does the Wider Economic Situation Have on Teachers’ Career Decisions? A Literature Review. DfE Research Report DfE-RR136. London, England: DfE.
- Ingersoll, R. 2011. “Do We Produce Enough Maths and Science Teachers?” Kappanmagazine.org 92 (6): 37–41.
- Jarrett, T., R. Long, and D. Foster. 2016. School Funding: Pupil Premium. House of Commons Library. London, England: House of Commons.
- Levin, J., and M. Quinn. 2003. Missed Opportunities: How We Keep High- Quality Teachers Out of Urban Classrooms. Brooklyn, N.Y.: New Teacher Project.
- Lupton, R., and S. andThompson 2015. “The Coalition’s Record on Schools: Policy, Spending and Outcomes, 2010-2015.” SPCC Working Paper 13. Social Policy in a Cold Climate. London.
- Matthias, C. 2014. Qualitative Research with Shortage Subject Teaching Candidates: The Journey to Teacher Training. Report for the National College for Teaching and Leadership. London, England: DfE.
- National Audit Office. 2016a. Financial Sustainability of Schools. (HC 850 Session 2016-2017). London, England: National Audit Office.
- National Audit Office. 2016b. Training New Teachers. London: DfE.
- National College for Teaching and Leadership. 2015. Arrangements for ITT Accreditation Submissions, February 2015. London, England: DFE.
- National College for Teaching and Leadership. 2016. The Allocation of Initial Teacher Training Places: Methodology for the 2017/18 Academic Year. London, England: DfE.
- Passy, J. 2018. “Why America’s Teacher Shortage Is Going to Get Worse.” New York Post. https://nypost.com/2018/02/14/why-americas-teacher-shortage-is-going-to-get-worse/
- Pettinger, T. 2017. “The Great Recession, 2008-2013 [Web Log Post].” https://www.economicshelp.org/blog/7501/economics/the-great-recession/
- Podolsky, A., T. Kini, J. Bishop, and L. Darling-Hammond. 2016. Solving the Teacher Shortage: How to Attract and Retain Excellent Educators. Palo Alto, CA: Learning Policy Institute.
- Public Accounts Committee. 2016. “Training New Teachers.” Third report of session 2016/17. London: House of Commons
- Public Accounts Committee. 2018. Retaining and Developing the Teaching Workforce. 17th Report of Session 2017-2019. HC 460. London, England: House of Commons.
- Roberts, N., and D. Foster. 2017. Initial Teacher Training in England. Briefing Paper No. 6710. London, England: House of Commons.
- The Royal Society. 2007. A State of the Nation’s Report on the UK’s Science and Mathematics Workforce. London: Royal Society.
- School Teachers’ Review Body. 2016. School Teachers’ Review Body Twenty-Sixth Report, Cm 9302. London: HMSO.
- See, B. H. 2011. Understanding Teacher Supply in England and Wales. Saarbrücken: LAP Lambert Academic Publishing.
- See, B. H., S. Gorard, and P. White. 2004. “Teacher Demand: Crisis, What Crisis?” Cambridge Journal of Education 34 (1): 103–123. doi:10.1080/0305764042000183151.
- Sky News. 2017. “Teacher Supply Crisis Hitting Schools in England.” https://news.sky.com/story/england-schools-suffering-from-teacher-supply-crisis-report-claims-10776066
- Smithers, A., and P. Robinson. 2008. Physics in Schools IV: Supply and Retention of Teachers. London, England: Gatsby Charitable Foundation.
- Staiger, D., and J. Rockoff. 2010. “Searching for Effective Teachers with Imperfect Information.” Journal of Economic Perspectives 24 (3): 97–118. doi:10.1257/jep.24.3.97.
- Strauss, V. 2016. “The United States’ Growing Teaching Shortage: How It Looks State by State.” Washington Post. https://www.washingtonpost.com/news/answer-sheet/wp/2016/10/18/americas-growing-teaching-shortage-how-it-looks-state-by-state/?noredirect=on&utm_term=.bb2d686bdb1e
- Sutcher, L., L. Darling-Hammond, and D. Carver-Thomas. 2016. A Coming Crisis in Teaching: Teacher Supply, Demand and Shortages in the US. Palo Alto, CA: Learning Policy Institute.
- Universities and Colleges Admissions Service. 2018. “The UCAS Teacher Training Fee Is Now Just £1.” March. https://www.ucas.com/connect/blogs/ucas-teacher-training-application-fee-now-just-1
- Universities and Colleges Admissions Service (2014, 2015, 2016). 2017. “UCAS Teacher Training End of Cycle Data Resources. UCAS Analysis and Research.” https://www.ucas.com/data-and-analysis/ucas-teacher-training-releases/ucas-teacher-training-end-cycle-2016-data-resources
- Universities UK. 2013. “Parliamentary Briefing: Initial Teacher Training.” http://www.universitiesuk.ac.uk/policy-and-analysis/reports/Documents/2013/briefing-initial-teacher-training-nov-2013.pdf
- Universities UK. 2014. “The Impact of Initial Teacher Training Reforms on English Higher Education Institutions.” https://www.universitiesuk.ac.uk/policy-and-analysis/reports/Pages/impact-of-initial-teacher-training-reforms.aspx
- Universities UK. 2015. “Patterns and Trends in Higher Education 2015.” http://www.universitiesuk.ac.uk/policy-and-analysis/reports/Documents/2015/patterns-and-trends-2015.pdf
- Ward, H. 2018. “Exclusive: 100% Rejection for Aspiring Teachers in Shortage Subjects.” Times Educational Supplement. https://www.tes.com/news/exclusive-100-rejection-aspiring-teachers-shortage-subjects
- White, P., S. Gorard, and B. H. See. 2006. “What are the Problems with Teacher Supply?” Teaching and Teacher Education 22 (3): 315–326. doi:10.1016/j.tate.2005.11.002.
- Williams, A. 2018. “Teacher Shortage in Mississippi [Web Log Post].” http://www.wtok.com/content/news/Teacher-shortage-475850893.html
- Worth, J., S. Bamford, and B. Durbin. 2015. Should I Stay or Should I Go? NFER Analysis of Teachers Joining and Leaving the Profession. Slough, England: NFER.
- Worth, J., and G. Lazzari. 2017. Teacher Retention and Turnover Research. Research Update 1: Teacher Retention by Subject. Slough, England: NFER.