
ABSTRACT
Pupil Premium funding has been provided to schools in England since 2011, to help overcome socio-economic segregation between schools, and reduce the poverty attainment gap. Yet there is little evidence such an approach is effective. Some important stakeholders are considering whether Pupil Premium should stop or be re-routed. It is therefore essential to know whether the policy has helped in the eight years since its inception. Evaluating the impact of such a funding policy is fraught with difficulties because of changes over time in the economy, legal definitions, prevalence of disadvantage, and metrics used. Previous research has generally ignored these, and the role of length and depth of disadvantage. Hence, previous estimates of the attainment gap are insecure. This paper introduces a new analysis, based on the National Pupil Database that considers changes in the prevalence of FSM-eligibility, private school attendance, GDP and the duration of individual poverty. Net of such factors, the results show that segregation has declined unexpectedly since 2011, suggesting that the Pupil Premium may be working. The policy should continue, while research looks at the long-term impact on the poverty gap. Meanwhile, the funding could be re-calibrated to be fairer to areas with longer-term disadvantage.
Introduction
This paper concerns two linked problems in compulsory education with potentially lifelong impact, appearing in some form in all education systems worldwide, and apparently worsening over time (Chmielewskia Citation2019). One problem is that socio-economically less advantaged students have lower average attainment outcomes at school, and poorer opportunities once they have left school. In England, poverty as represented by eligibility for free school meals (FSM), and being registered as having a special educational need or disability, are the most important known challenges facing pupils when they start school (Gorard and Siddiqui Citation2019). And attainment at school, and continuation in education after school, are heavily patterned by similar indicators of disadvantage both in the UK (Lessof et al. Citation2018), and elsewhere (Rutkowski et al. Citation2018; Hanushek et al. Citation2019). For example, by Key Stage 4 (KS4) at around age 16, pupils eligible for free school meals (FSM) gain an average of 243 points (in GCSE and equivalent qualifications) compared to 319 for non-eligible pupils. This is a considerable attainment gap with an ‘effect’ size of 0.78 (Gorard Citation2018). Almost twice as many non-eligible as FSM-eligible pupils then continue with academic study after the age of 16, gain at least the equivalent of two A-levels at grade E in KS5, and enter higher education at a traditional age.
These attainment and participation gaps provide an indication of an underlying unfairness in the education system. Of course, such ‘effect’ sizes do not imply that relative poverty is their sole cause – and the term ‘effect’ size is really a misnomer, actually representing here just a standardised difference between two means. Many other factors such as talent, motivation, and a ‘learner identity’ may play a role in creating these gaps (Gorard Citation2018). The gaps may also be related to the kinds of opportunities available to different sections of any society. In England, these opportunities would include the kinds of schools pupils go to, and who they go to school with (Gorard Citation2015). The second problem, therefore, is that poorer children are clustered to some extent in particular economic regions, areas of housing and schools. This social and economic ‘segregation’ is potentially damaging in a variety of ways – such as lowering aspiration and participation for individuals, and reducing national and regional social and ethnic cohesion (Danhier Citation2018; Hewstone et al. Citation2018). According to an analysis of longitudinal data for England by Dickerson, Maragkou, and McIntosh (Citation2018), this peer effect is more serious for lower-attaining and more disadvantaged pupils. SES segregation between schools can also act to deter more qualified teachers from working in heavily disadvantaged schools (Copeland Citation2018).
Both problems presumably have long-term solutions beyond education, such as reducing the economic and other differences between regions or social groups. In the shorter term, and for the current school cohorts, other approaches are being tried at school level. This paper looks at the introduction of additional funding for schools in England to provide improvement programmes for disadvantaged pupils – the Pupil Premium (PP) policy. This funding is tied to individual pupils meeting the eligibility criteria and provided to the schools they attend. The policy therefore differs from one based on giving money to poorer families on condition that they children attend school (Baird, McIntosh, and Özler Citation2011; De Janvry et al. Citation2006; Morley and Coady Citation2003), or to regions, as with the Opportunity Areas (DfE Citation2018a) or Excellence in Cities policies in England, and it differs from a policy based on extra funding for schools themselves that is not tied to their intake, such as the original Specialist Schools and then the Academies programme (Gorard Citation2005). The first approach is less relevant in a more developed country like England where school enrolment is compulsory by law and attendance is already high. The other two approaches run the risk that the funding is not used for those most in need in those areas or schools, and that there is no provision for funding to cease where it leads to those areas or schools no longer being the most disadvantaged (Gorard Citation2018).
The Pupil Premium is more like the additional funding that mainstream schools had already received for individual pupils with statements of special educational needs or disability. Both funds are intended to assist those pupils facing long-term challenges in accessing the curriculum. The evidence on the impact of such funding for poorer pupils is mixed but promising (Henry, Fortner, and Thompson Citation2010). Holmlund, McNally, and Viarengo (Citation2010), using what they term a ‘back-of-envelope calculation’, report that increased expenditure on schools is linked to improved school outcomes. Steele, Murnane, and Willett (Citation2010), and Glazerman et al. (Citation2013) suggest that providing financial incentives to attract suitably qualified staff to poorer schools is effective (although it is hard to retain the staff once the finance stops). However, Mbiti et al. (Citation2019), in a very different context, conducted a randomised control trial suggesting that simply giving extra money to schools had no direct impact on test scores (unless perhaps coupled with teacher incentives). Evaluations by Hough and Loeb (Citation2013), and Strand (Citation2010) did not find strong evidence that any schools are particularly effective for specific disadvantaged groups, in the way that the Pupil Premium might demand. The evidence on the impact of providing such funding direct to schools is therefore unclear, and results are probably contingent on specific context and purpose.
The National Governance Association reported that schools do not always ring-fence Pupil Premium funding (NGA Citation2018). Commentators are saying that the Pupil Premium is not being effective and calling for the money to be used for school general funds (Allen Citation2018). And the all-party parliamentary group on social mobility consider that PP should be renamed the Social Mobility Premium and used more to recruit, develop and retain teachers (Staufenberg Citation2019). With this kind of uncertainty about its likely impact and future, we need to know urgently if PP works as it is, or is in need of modification with the funding being spent otherwise or provided differently. However, deciding this is not as simple as it might appear at first sight. This paper explains why.
What is the Pupil Premium, and what is it for?
In April 2011, the Coalition government introduced Pupil Premium (PP) funding for schools in England. It was allocated to schools taking children from low-income families who were known to be eligible for free school meals (FSM), and a much smaller number of children who had been looked after by the state continuously for more than six months (Education and Skills Funding Agency Citation2018). The premium was described as, ‘additional’ funding provided to publicly funded schools, in proportion to their intake of disadvantaged pupils. The schools involved were infant, junior, primary, middle, secondary, high schools, special schools and pupil referral units. In 2012/13, PP was extended to include pupils known to have been FSM-eligible in any of the past six years (EverFSM6). A smaller premium is also paid for pupils having parents in the armed forces, and now for pupils whose parent(s) had died while in the armed forces (Foster and Long Citation2018). By 2018, PP was funded at £2,300 per looked-after pupil, £1,320 per EverFSM6 pupil at primary school, and £935 at secondary. For some primary schools, PP funding amounts to over £150k per annum, and for some secondary schools over £300k. Subsequently, similar policies have been introduced in the other home countries of the UK, including Pupil Equity Funding (PEF) in Scotland.
Schools are required to use PP funding to support low-income and other target pupils, but they can choose how to do this. This includes spending for the benefit of such pupils at other maintained schools, or via community facilities. Schools do not have to spend PP directly on teaching activities and can introduce programmes related to attendance, behaviour, personal development or parental engagement, for example. In descending order of frequency, school heads report that they see PP as being intended to raise the attainment of disadvantaged pupils, close the attainment gap in their school, improve engagement with PP parents and the attendance of PP pupils, close the attainment gap nationally, and reduce exclusions from school for PP pupils (Fellows and Barton Citation2018). None mention addressing segregation as a concern, perhaps because this can never be assessed in a single school.
From the outset, a key purpose of PP funding was to help reduce the ‘achievement gap’ between children coming from richer and poorer families (Gov.uk Citation2010; NASEN Citation2014; Copeland Citation2018). School performance tables in England now include results for the attainment of pupils who attract PP, and the school inspection body Ofsted looks at how effectively schools are using their funding to increase the achievement of disadvantaged pupils (DfE Citation2019). Oftsed and the Department for Education (DfE) can suggest that a school must review its provision for disadvantaged pupils, where this is considered unsatisfactory. The Educational Endowment Foundation, set up in England at the same time as the Pupil Premium, has now had 8 years to help generate and disseminate secure evidence for schools on how best to use funding to reduce the attainment gap. Although the effects of their work will be muted when looking at the whole school system, there ought to be signs of its impact. One research question for this paper is therefore:
1) How can we judge whether the Pupil Premium is linked to a reduction in the attainment gap between poor children in England and their peers?
When some of the original planning took place to introduce what became the Pupil Premium, it was also clearly intended to address the related problem of social and economic ‘segregation’ between school intakes. This concern emerged partly from evidence given to successive House of Commons Select Committee investigations into school admissions and segregation – about how less segregated school systems perform better and how, if school admissions could address this, it could help to reduce the tail of low achievement in England (House of Commons Citation2004).
In originally proposing the Pupil Premium, Freedman and Horner (Citation2008) suggested that it would ‘act as an incentive for schools to stop cream-skimming children from wealthier areas as they will lose out financially’ (41), and ‘give their neighbouring schools located in more disadvantaged communities the resources to attract middle-class parents’ (9). The idea was still there in 2010 just before the launch, with the new coalition government stating that it had the intention of ‘reducing any disincentive that schools might have to recruit such pupils’ (Gov.uk Citation2010). The then Education Secretary said ‘What we wanted to do is see how we could give priority in admissions to children from poorer homes’ and ‘historically, we haven’t achieved as well as we should, particularly given the nature of Britain’s stratified and segregated education system’(The Guardian Citation2014).
To some extent, this emphasis on reducing the ‘tail’ of low achievement by incentivising schools for admitting disadvantaged pupils has subsequently been rather lost. Instead, the emphasis has tended to be on direct involvement in raising the attainment of disadvantaged pupils, wherever they attend school. There were doubts originally about whether the premium was large enough to reduce any disincentive that schools may have for attracting lower attaining and disadvantaged pupils, and whether it could reduce social segregation between schools (Chowdry, Greaves, and Sibieta Citation2010). Radical changes to the intake of schools might also have been hindered by the Schools Admissions Code. However, in December 2014 the government published a revised admissions code that permitted all admission authorities in England to prioritise disadvantaged children in their admission arrangements (Foster and Long Citation2018). A second question for this paper is therefore:
2) How can we judge whether the Pupil Premium is linked to a reduction in the between-school segregation of poor children in England?
Before a description of the methods used in the new research described in this paper, the problems in addressing both research questions are discussed, using prior literature and official data, as appropriate. Where it is possible to provide indicative estimates of the attainment gap and segregation before and after 2011, these are provided. However, it is not the purpose of the paper to provide definitive versions of either, but to explain the problems in conducting such an evaluation, propose a way forward, and suggest what to do about PP funding in the meantime.
Generic problems in identifying disadvantaged pupils for comparison
In order to assess whether disadvantaged and non-advantaged pupils are getting more evenly mixed in schools since 2011, or whether the attainment of the two groups is growing closer, it is necessary to identify pupils as belonging to one of these two groups – disadvantaged or not. The definition for receipt of Pupil Premium is straightforward, and the majority of cases are defined by being eligible for free schools meals. However, identifying the two groups in any year, and tracking changes in attainment/segregation for the two groups over time is not straightforward.
One area for misclassification to the two groups is where pupils are living in relative poverty but are not known to be FSM-eligible. Based on HMRC household income figures, it is estimated that 11% of pupils in 2013 who are entitled for FSM in terms of household income are not officially registered (Lord, Easby, and Evans Citation2013), a drop from 14% in 2012. This drop may be because schools now have more of an incentive, in terms of extra PP funding, to identify disadvantaged pupils among those that they teach. If so, this figure is likely to continue falling. In 2012, schools and local authorities were encouraged by the DfE to persuade parents to register for FSM, even if they do not want the meals, because of the PP funding the school would then attract. Local authorities were also allowed to check data held by HMRC and other government offices to see if any of their pupils who qualify but had not registered (Foster and Long Citation2018). However, some schools have reported a reluctance to chase up missing data, in case publicising the Pupil Premium upset other struggling families who are not eligible, or encouraged PP families to insist that their child had the precise amount of funding spent on them only (Carpenter et al. Citation2013). The DfE has suggested that around 100,00 pupils are still not registered for free schools despite being eligible in theory, and that this leads to schools missing out on a total of £93m per year in Pupil Premium (Speck Citation2019). More research is needed on how these pressures have changed the numbers registered, but it is understandably difficult to gain permission to access HMRC data, and even more difficult to link it to individual pupil data, within the constraints now created by GDPR legislation.
Complicating the problem of identification of PP pupils is missing data. Every year the NPD shows that about 4% of pupils in state-maintained schools are missing any value for FSM-eligibility which is actually a three-way value – yes, no, and don’t know (Gorard Citation2012). The ‘don’t know’ pupils tend to be even more disadvantaged than the FSM-eligible pupils, are more likely to have special educational needs, to be in special schools, recent arrivals at school, and/or to be from some ethnic minority groups such as Travellers. They are entered for fewer formal examinations and gain lower qualifications at every stage of education (Gorard Citation2018). The pupils missing data are not evenly spread but clustered both by area and school. Because they are missing data they are either ignored in the segregation/attainment gap calculation or treated as not disadvantaged. Either compromise distorts the results. For example, treating them as non-disadvantaged, as the DfE usually does, makes the computed attainment gap appear smaller than it should be, because these lower average attaining pupils are mixed in with the non-disadvantaged and generally higher attaining group of pupils. But ignoring the missing cases instead also artificially reduces the scale of the real gap, because the missing cases tend to be disproportionately highly disadvantaged and lower attaining.
The proportion of pupils registered as FSM-eligible also obviously changes as economic conditions change (historically from nearly 20% of the school population to just above 11%). In general, a growth in GDP reduces the proportion of FSM-eligible pupils, and a reduction in GDP leads to more FSM-eligible pupils. And although the legal definition of FSM entitlement has remained reasonably constant, there have been changes in the law. Most recently, in November 2017, all recipients of Universal Credit qualified as eligible for FSM (and so for PP funding), but plans to change Universal Credit to a net earnings threshold in April 2018 could potentially increase the number eligible by around 50,000 pupils (Foster and Long Citation2018).
This complicates comparisons over time because the FSM-eligible group will sometimes contain pupils who would not have been eligible in prior years, and vice versa. Any change in the definition or prevalence of those known to be disadvantaged will change the apparent attainment gap even without any actual change in actual attainment. The number and proportion of pupils registered for FSM will affect the measurement of the attainment gap, and any assessment of how segregated disadvantaged pupils are, between areas and schools. Ignoring the kinds of factors discussed so far will make local and national changes in the economy, law and handling of FSM, appear as changes in the attainment gap (even though the actual level of attainment for either group might remain constant). But taking them into account makes the calculation of a simple attainment gap between disadvantaged pupils and the rest more complex than is usually portrayed in a comparison just between those known and not known to be disadvantaged in each year (or area or school).
Generic problems in measuring change in the attainment gap over time
A lesser difficulty, faced when assessing possible changes brought about by the introduction of PP in 2011 relates to changes in how attainment is assessed in schools in England. For example, Key Stage 3 (KS3) levels were abolished in 2014/15, and so it is no longer possible to consider KS3 results for many years after PP, and at KS2 point scores are used instead of levels (Fellows and Barton Citation2018). A new grading system for GCSEs at KS4 was introduced for 2017, making comparisons between years before and after less clear.
Until 2014, the preferred official metric used to create the attainment gap was the difference between the percentage of FSM-eligible and non-eligible pupils achieving five A*-C GCSE grades (or equivalent) including English and maths at KS4, or achieving level 4 or above in reading, writing and maths at KS2. This approach was used by Hutchings et al. (Citation2012) to evaluate the London Challenge impact on the attainment gap, by the think tank Demos (Exley Citation2015), the National Audit Office (Citation2015), and the Public Accounts Committee (Citation2015). A similar approach is still being used by the EEF (Citation2017), and the DfE (Citation2018b, Table 10). None of their claims about changes over time take account of changes in the scale of the attainment figures from which the gap emerged – termed the ‘politician’s error’ (Gorard Citation1999). From 2015/2016 onwards, a new metric was used to judge attainment at KS4 – attainment 8 (the total score in the best 8 GCSEs or equivalent) and Progress 8 (the value-added progress score based on Attainment 8). Since 2014, the DfE have assessed the PP attainment gap at any stage by ranking all pupils by their attainment score, and then finding the difference between the average rank of PP and non-PP pupils (scaled to be between 0 and 10).
Changes such as these hinder any long-term time-series analysis of the kind often presented for claims about the impact of PP, and considered in this paper, although some of these can be addressed by using standardisation and the use of ‘effect’ sizes. Using the DfE ranked measure, the attainment gap at KS2 appears to have dropped from 3.34 in 2011 to 2.90 in 2018 (DfE Citation2018c), and at KS4 from 4.07 in 2011 to 3.66 in 2017 (DfE Citation2018d). However, this drop cannot simply be attributed to the Pupil Premium because the same metric was not used before 2011, and the DfE have not gone back before 2011 to recalculate the gap using the newer method, and there is therefore no evidence in these reports of what would have happened in the absence of Pupil Premium (i.e. there is no counterfactual result). According to the Education Policy Institute (Citation2017), this gap has been reducing very slowly and erratically since at least 2007, with no clear difference before and after 2011 The Social Mobility Commission (Citation2016) used a different and simpler approach, of dividing the difference in raw scores between the two groups by the raw score of the disadvantaged group. Using this proportionate approach, they also report that the gap has been falling slowly, but again not necessarily more so since 2011.
We found no prior studies relating socio-economic segregation between schools to the impact of the Pupil Premium (but see below).
Methods used in this paper
The data used for the analyses in this paper comes from the National Pupil Database with records for all pupils in maintained schools in England who reached the age of 16 in 2015/2016. The 2015/16 records include the reported characteristics and school attainment for each pupil for as many years as they had previously been at school in England. This includes whether pupils were known to be eligible for FSM in each year at school, registered for PP, their total KS2 points scores, capped total KS4 (GCSE equivalent) points scores, and the local authority in which they attended school. These variables are used to create attainment gaps calculated as ‘effect’ sizes – the difference between the mean KS scores for FSM-eligible and non-eligible groups, divided by the overall standard deviation of the scores – at national and local level. They are also used to create variables representing the proportion of FSM-eligible pupils who were eligible for only one year while at school, for only two years at school, and so on. This dataset is linked to the proportion of pupils in each local authority area attending fee-paying schools. Pupils missing data on one or more key variables have a new category added for ‘missing’ or, where the variable is a real number, a new flag variable created to mark whether that number is missing or not. This retains all cases successfully so that all analyses use the same N, while respecting missing data and permitting it to be assessed accurately in the context of each finding. This approach was used, and shown to be effective, in Gorard and Siddiqui (Citation2019), for example.
The data is presented in cross-tabular form by local authority, and as cross-plots comparing pupil characteristics with attainment gaps. The variables are also combined at local authority level in a multiple regression model, having the local authority attainment gap as the outcome variable, and the other variables as predictors.
For this paper, and while awaiting access to all NPD records and seeking funding to analyse them, the analysis for 2015/16 is the only one available at an individual level. The analyses at local authority level portray the variation in duration of poverty and private school use that affect calculation of the attainment gap for areas, and economic regions, and illustrate the kinds of variation in the attainment gaps that also appear at school-level and over time. For example, in recent years, the percentage of pupils in England eligible for FSM has changed from nearly 16% in 2014 to 12% in 2018. In 2014 the percentage ranged from 8% in the South East to 16% in London, and in 2018 from 10% to 23%. The kinds of variation between areas described in this paper therefore also act as a proxy for the kinds of variation that will be found in annual changes in FSM eligibility and private school use.
Further information comes from the school-level annual schools census (SLASC) available via the DfE. This dataset is valuable here, despite being at school – rather than individual-level, because it is easily available for many years. It includes the proportion of pupils eligible for FSM in each school, and the proportion of pupils registered as having special educational needs (SEN), for each year from 1989 to 2018. These are used to create indices of national segregation (the extent to which FSM or SEN pupils were clustered in schools with others like them) using the Gorard Segregation Index (GS) (see Gorard Citation2018), and the Index of Dissimilarity D as a check. These two indices have been shown to give the same substantive results in almost all contexts (Gorard Citation2009). National figures are also computed from SLASC for each year, including the proportion of SEN and FSM-eligible pupils in the system. From 1989 to 1992, eligibility for FSM was not registered, and so actual take-up of FSM is used instead for those years, and dealing with this kind of abrupt change of measurement is one of the advantages of using GS rather than D (Gorard and Taylor Citation2002). Changes in GDP for each year 1989 to 2018 are used as an indicator of the health of the economy, taken from the website (https://www.ons.gov.uk/economy/grossdomesticproductgdp).
Line graphs are used to help the reader see long-term trends clearly, even though the data is in discrete points representing the value for each year. The results are displayed as cross-plots, correlated with each other, and used in three regression models. These models had the GS index for FSM-eligibility and SEN, and D index for FSM from 1989–2018, respectively, as outcomes. The predictors were the prevalence of FSM (or SEN) in each year, annual changes in GDP, and whether the year was before 2011 or not (when PP was introduced). The model has two steps, with the second step adding only whether the year was before 2011 or not. These analyses were used to assess the possible impact of PP, net of economic and other factors. The school-level figures do not have the detail of the individual level data from 2015/16 (above), but they do span nearly 30 years and so they directly address issues of change over time.
Findings
Further issues in measuring the official attainment gap
Receipt of PP is mostly defined on the basis of eligibility to FSM, but the latter is a categorical measure which in most cases is based on a threshold of income for entitlement. This means that there is variation within the FSM-eligible category (and outside it), both in terms of how far below that threshold any pupil’s family income is, and how long pupils have been FSM-eligible during their school career. This has important implications for computing the attainment gap at local and school levels, as will be illustrated below. It will also influence the national attainment gap over time, as the proportion of short-term FSM-eligible pupils changes with economic and other conditions, but this pattern cannot be demonstrated here because the available individual data is only for one year. Instead, variation between local authorities, in the graphs below, shows the sensitivity of any attainment gap to the precise nature of poverty involved.
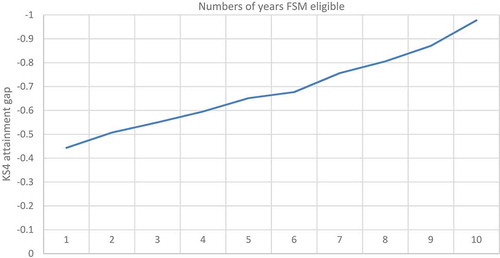
shows that the attainment gap (‘effect’ size), for FSM-eligible pupils compared to pupils never eligible for FSM, is substantially greater for every year that pupils are known to be eligible for FSM, by the end of KS4. The ‘effect’ size for pupils only eligible for a year or two, compared to never-FSM, is around −0.5 but it is −1 for pupils who are eligible throughout their schooling, again compared to never-FSM. In fact, the difference in the ‘effect’ size between longest-term and shortest-term FSM-eligible pupils is greater than the difference between short-term FSM-eligible pupils and those who were never eligible. Therefore, simply dividing pupils into EverFSM6 as disadvantaged and never-FSM as not disadvantaged in order to calculate the gap ignores important variation in levels of disadvantage relating to attainment, and will give a misleading picture of the true attainment gap in any school or local area. Put another way, the attainment gap should be expected to be lower in areas, schools, or years, with more FSM pupils known to be only temporarily eligible, because this sub-group will have higher average attainment than other FSM-eligible pupils.
Figure 1. Comparison of attainment gap by years FSM, England, KS4 capped points, 2015
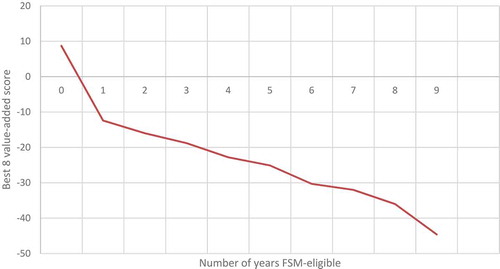
This shows that comparing eligible with non-eligible pupils using raw scores, as in many studies looking attainment gap, can be misleading. Yet this is the kind of evidence that the Pupil Premium Awards used in praising or rewarding schools for having low or declining PP attainment gaps (https://www.pupilpremiumawards.co.uk/ppawards2017/en/page/home). The Pupil Premium Awards also used the value-added Progress 8 scores, as a supposedly fairer measure of pupil progress and school performance, and purportedly independent of the raw level of attainment. What shows is that the problems in cannot be avoided by using value-added or Progress 8 scores. Despite value-added being intended to be independent of the underlying raw-scores, it is not (nor is it stable, Gorard Citation2018). The same flaw creates a situation where the only group that has average positive value-added progress in England consists of those pupils who are never eligible for FSM. All groups of pupils ever eligible for FSM for any amount of time have negative progress scores, and these scores are substantially lower for every year that a pupil is known to be eligible (just as with Attainment 8). The longest term disadvantaged pupils have very low progress scores indeed, and therefore years, areas or schools with proportionately more of this group will tend to have lower progress and higher attainment gaps as well.
Figure 2. Comparison of best 8 value-added scores by years FSM, England, KS4 capped points, 2015
Just like pupils with missing data (above), the longer-term FSM-eligible pupils with much lower average attainment and progress are not evenly spread between areas and schools (and will also vary over time with the economy). For example, EverFSM6 pupils in the relatively poor authority of Middlesbrough tend to have been eligible for over four times as long as the supposedly equivalent EverFSM6 pupils in the relatively rich Buckinghamshire (Gorard Citation2018). This example from our prior analysis has now been picked up by the Social Mobility Commission to illustrate the mistakes being made in policy (Speck Citation2019). Since average attainment is lower for long-term FSM-eligible pupils, this means that simply computing an attainment gap between Ever- and never-FSM pupils will seriously misrepresent the challenges faced by poorer areas, by schools with poorer intakes, and the chances of their pupils making good progress. The Pupil Premium Awards, London Challenge, Ofsted reports and many other real-life judgements are being inadvertently unfair here. The DfE (Citation2019) advice to schools that they should compare their disadvantaged pupils’ performance with the national average for non-disadvantaged pupils, would lead to the same misrepresentations.
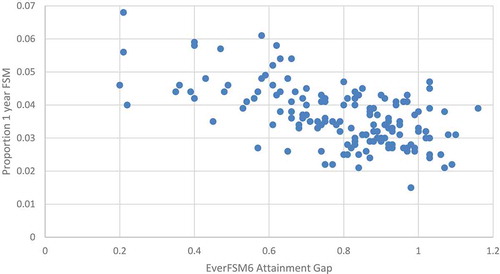
shows what a difference this issue could make to the results. Using the EverFSM6 attainment gap at a local level, it is clear that local authorities in England with high attainment gaps have fewer EverFSM6 pupils who have only been eligible for one year in their school (and proportionately more long-term FSM-eligible pupils). This is because these pupils, while labelled disadvantaged, have much higher average attainment than pupils with longer-term eligibility (as shown above).
Figure 3. Comparison of local authority EverFSM6 attainment gap by proportion of pupils FSM-eligible for only one year, KS4 capped points, 2015
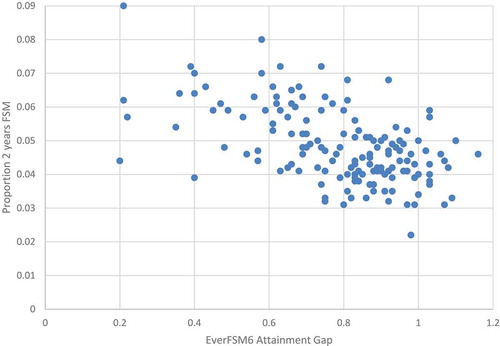
shows that the same pattern arises when considering EverFSM6 pupils who have only been eligible for two years. Conversely, areas with low attainment gaps have a high proportion of EverFSM6 pupils, eligible for only one or two years over their school careers. If this factor is not taken into account, the official attainment gaps will partly represent the pre-existing duration of relative disadvantage in any area, school, or year, rather than something directly attributable to the schools or teachers there. Therefore, to be fair, comparisons between schools, regions and years should take into account the depth and duration of poverty of the pupils involved.
Figure 4. Comparison of local authority EverFSM6 attainment gap by proportion of pupils FSM-eligible for only two years, KS4 capped points, 2015
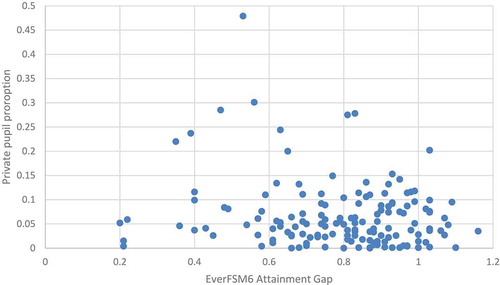
Another factor that is ignored in presentations of the attainment gap at any level of aggregation over time is the proportion of pupils in any area or year not in state-maintained schools. If the pupils attending private provision are not included in the attainment gap calculation, because it is not clear whether they are FSM-eligible or not, this may distort the result. shows that there is wide variation in private schooling by local authority (from 0 to almost 50% of local pupils). These figures will also vary from year to year and with the economy. If the kinds of pupils attending private school tend to have higher than average attainment for their area, then the skimming effect will make it look as though areas with high private school use have lower attainment gaps. The relatively high attaining private pupils will not appear in the non-disadvantaged group, artificially reducing the average for that group, and so reducing the apparent gap with disadvantaged pupils. The picture in the graph is messy, but it shows that the areas with the highest gaps do tend to have low private school attendance, and several areas with especially high private attendance do have relatively low attainment gaps.
Figure 5. Comparison of local authority EverFSM6 attainment gap by proportion of pupils in private schooling, KS4 capped points, 2015
A simple regression model, using only these three variables (proportion of pupils in each local authority attending private schools, FSM-eligible for one year, or for two years only) explains about 55% (R = 0.74) of the variation in the EverFSM6 attainment gaps between local authorities. But none of the these explanatory variables is a measure of attainment, so this suggests that well over half of the variation in the official attainment gap is nothing to do with how well equivalent disadvantaged pupils are doing in any area or school. Nor is it to do with the impact of any educational initiative. And there may be other factors than these that are also not measures of attainment that can help explain these gaps. The coefficients for the model are in , showing that the size of the attainment gap in any area is negatively related to the local number of privately educated and shorter-term FSM-eligible pupils. Each factor tends to reduce the apparent size of the gap – either by removing pupils with a higher average attainment from the calculation, or by treating everyone who ever registered for FSM as being equally disadvantaged. The same kind of differences would occur across years, as the economy changes, and none of these differences would be to do with changes in measures of attainment or with the impact of the Pupil Premium.
Table 1. Non-attainment predictors of the local attainment gap
Using the simple, commonly used, EverFSM6 attainment gap, official results suggest that the poverty gradient is lowest in most of the London and inner-London authorities, and highest in areas further north like Lincolnshire, Cumbria, Hartlepool and Cheshire. Using instead the residuals from this new regression model as an estimate for the attainment gap, accounting for private school intakes and shorter-term disadvantage, does not completely transform the picture (Appendix to ). But it does change the emphasis considerably. For example, both Leicestershire and Warrington have relatively high raw attainment (EverFSM6) gaps, higher than average for England, and might be considered therefore to be failing their disadvantaged pupils to some extent (, column 1). Leicestershire has fewer short-term than long-term disadvantaged pupils, and about the same proportion of private pupils as the national average (6%). Warrington has fewer short-term disadvantaged pupils and almost no private pupils. Both areas therefore end up with substantial negative residuals from the regression model, meaning that their attainment gaps can actually be considered as much lower than the overall average for England, once these other explanatory variables are accounted for. There is therefore an argument that, far from failing their disadvantaged pupils, both authorities are doing relatively well in this regard, given the more precise nature of their local school intakes.
Table 2. Examples of authorities from London and the north of England, 2015
Westminster and Lambeth in central London, on the other hand, show the opposite pattern. Both have low raw attainment gaps, noticeably lower than the national average of 0.82, but considerable short-term, as opposed to long-term, disadvantage. Lambeth has 6% of pupils eligible for only two years, compared to 4% nationally, and 3% in Warrington. In addition, Westminster has a very high private school attendance (29%). Once these factors are accounted for, the residuals suggest that these two London attainment gaps are higher than might be expected from the raw figures, and well above the average for England. Taking long-term disadvantage seriously matters. The detailed analysis here is based on only one year group (due to current unavailability of longer-term data). So the next step is to access as many years of NPD as are available to get a fuller picture of whether the attainment gap for long-term disadvantaged pupils, and only for those in the state-sector affected by PP, has changed since 2011. Until that happens, we will not know the impact of PP on the attainment gap.
Further issues in measuring changes in socio-economic segregation
A further question is whether the Pupil Premium is linked to a reduction in SES segregation between schools. The question faces many of the same problems as the attainment gap – in terms of defining the two groups (disadvantaged and the rest) in a consistent way over time. However, as with the attainment gap, it may be possible to make some progress in addressing the segregation question by considering first the other determinants of segregation (as explained, for example, in Gorard Citation2015). This is possible using SLASC data as far back as 1989. The possible determinants include school diversity, rules for allocating school places, and local residential segregation, but all of these are relatively minor in impact. For any indicator of disadvantage, the biggest determinant of segregation is its prevalence. The scarcer any pupil characteristic is the more segregated between schools it has been shown to be.
For example, segregation by Special Educational Need (SEN) has fallen nationally since 1989 (starting at near 0.5 in ). It reaches a low of around 0.22 in around 2006, and then begins to rise slightly again. This trend correlates with R = −0.86 with the increase and the plateau of pupils identified as having SEN in mainstream schools over that historical period (Gorard Citation2018). The changes are probably the result of a policy of inclusion from the 1990s onwards and the increasing identification and labelling of non-visible challenges or disabilities, rather than more general changes in school place allocation.
Figure 6. Segregation by SEN and FSM, England 1989 to 2018
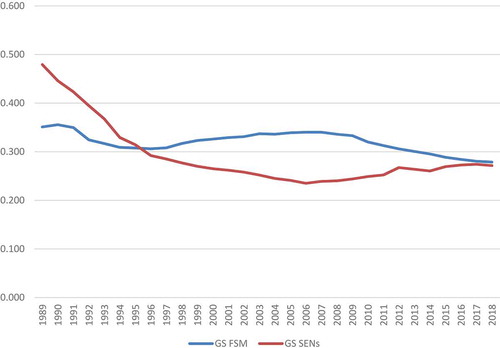
Segregation between schools by poverty (FSM) has a more cyclic pattern over time, moving up and down several times over 26 years (from a high of around 0.35 in 1989 to a low of about 0.28 in 2018 in ). This cyclic pattern means that the (linear) correlation between prevalence and segregation is lower for FSM (−0.41) than for SEN (−0.86). But there is just as strong a pattern, at least until 2011. shows the trend for the prevalence of FSM pupils in England, defined as the proportion of pupils known to be eligible for free school meals. It almost exactly mirrors the pattern for segregation by FSM. When there are more poor pupils, such as in an economic recession after 2007, and a drop in GDP growth, segregation drops accordingly in the following year, and vice versa. This does not mean that school places are being allocated differently or that pupils are moving schools. It may simply mean that at a time of economic recession, some pupils not previously considered as being disadvantaged are now being labelled as eligible for FSM – which is, as already shown, an important factor to take into account both in assessing segregation and computing the ‘attainment gap’ over time.
Figure 7. Segregation by FSM, and FSM prevalence, England 1989 to 2018
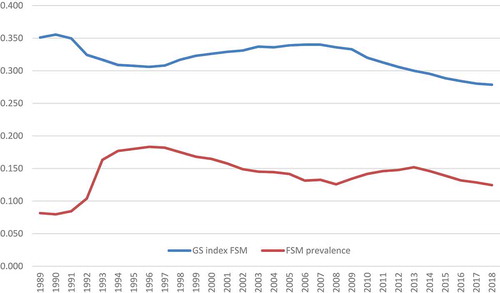
The exception to this historical trend is from 2012 onwards, when FSM prevalence drops while segregation drops as well. This could be an indication that the Pupil Premium (introduced from 2011) started to change how strongly poor pupils were clustered in schools, and that PP is therefore being successful in these terms. This suggestion is strengthened by the fact that whatever is happening with FSM after 2011 is not also happening with SEN (where segregation is going up slightly, as shown in ). The change for FSM is not a general decrease of clustering of pupils of specific types because it is not happening for SEN (or other indicators such as ethnicity, or having a first language other than English).
Overall though, the cycle of FSM prevalence appears to be key to understanding changes in FSM segregation (and the attainment gap) over time. This means that prevalence must be taken into account when attempting to judge the impact of the Pupil Premium policy on how evenly poor pupils are distributed between schools. We are looking for a change in segregation, net of changes in FSM prevalence. This is modelled as follows.
summarises three similar regression models, each with two steps. The first two have an estimate of FSM segregation for each year as the predicted outcome variable, one based on the GS index and the other using the D index (see methods). The D index is used to reassure readers that the findings are not somehow specific to the GS index. The third model has SEN segregation as the predicted variable, and this is used to check for spurious patterns in the FSM segregation results. SEN pupils already received extra funding and were not specifically addressed by PP, and therefore the pattern for them should be different to that for FSM. The initial predictors for each model are FSM prevalence and GDP changes for each year, in the first step, and then whether the Pupil Premium is in effect (i.e. whether the year is before 2011 or not) in a second step. In the first two models, the majority of variation is explained by whether the year is before or after 2011 and the onset of PP funding. This suggests again that PP may have had an impact on the level of between-school segregation, and this suggestion is confirmed in the third model, in which PP should be less relevant, and where appropriately very little variation is explained in the second step. Having accounted for economic factors, the years after the Pupil Premium do indeed seem to have bucked the historical trend for segregation, however measured, and as portrayed in .
Table 3. R from four regression models predicting between-school segregation, 1989–2018
Nevertheless, in all models a considerable amount of variation is predictable from the economic/prevalence factors in Step 1. This must be taken into account when comparing trends in segregation and other possible determinants. For completeness, shows the coefficients for each of these models. In each model, FSM prevalence is related to the outcome. Using GDP change if FSM prevalence is available does not improve the model at all, so it is omitted here. Net of these influences, and as also shown in the R scores from , there is still a role for whether the date is after the Pupil Premium was launched or not.
Table 4. Coefficients from four regression models predicting between-school segregation, 1989–2018
Discussion
Pupil Premium funding has been provided to schools in England since 2011, to help overcome socio-economic segregation between schools, and reduce the attainment gap between disadvantaged pupils and their peers. It was introduced in the usual uncontrolled way and has never been robustly evaluated. An irony here is that the funding is meant to be spent on clearly evidence-informed interventions by schools (often taken to mean those programmes successfully tested by randomised control trial, or equivalent).
The raw-score attainment gap has been suggested by others as declining to some extent since 2011, but perhaps no more than it declined before 2011. The problems with these prior analyses – conducted by the DfE, Ofsted, EEF, Demos, the National Audit Office, the annual Pupil Premium awards, and of the apparent success of the London Challenge, among others – are detailed in this paper. As a corpus, they take no account of changes over time in the economy, or the legal definitions of indicators of disadvantage, and so the prevalence of disadvantage (and are complicated by changes in the metrics used and in the way attainment has been assessed). Worse, the length and depth of any indicator of disadvantage is usually ignored and, because such factors are clearly related to attainment and progress, the estimates of the attainment gap at any level of aggregation are therefore problematic. A substantial part of the change in the attainment gap in any year, area or school is linked to factors such as private school attendance, the economy and the duration of poverty (none of which are strictly anything to do with attainment levels, but become confounding variables unless accounted for).
There has been no previous research linking changes in socio-economic segregation between schools and the Pupil Premium Policy. And there is very little work anywhere looking at long-term changes in the attainment gap (Hanushek et al. Citation2019). The school-level analysis conducted here, taking into account changes in the prevalence of FSM-eligibility presumably linked to the economy, private school attendance and the duration of poverty, shows that since 2011 segregation has declined uniquely in an era where prevalence also declined. The Pupil Premium may be working in this respect, and so pressure to alter or end it should be resisted until we know more. More detailed work needs to be done with multiple cohorts of individual pupil data, and a fuller range of potential explanatory variables, in order to judge whether national and local changes in attainment/segregation are largely the product of changes in allocating cases to the two groups being compared. Or whether there is a good prime facie case that the Pupil Premium has produced the desired impacts. We urgently need a more stable method of defining the two groups over historical time periods, and so assessing changes in both segregation and the attainment gap more accurately.
In the meantime, this paper should be read as a caution that we do not yet know how best to assess the link between the Pupil Premium and either attainment or segregation. Policy-makers and other commentators therefore need to be considerably more tentative when acting on the assumption that they can tell whether particular schools, types of schools, or areas have indeed acted to reduce the attainment gap, and so on. No claim, such as that the London Challenge succeeded in reducing the gap, should be taken seriously unless and until a definition of the two groups is used that means the same thing over time (i.e. that a pupil defined as disadvantaged in 1 year would also be so defined for every year). Otherwise, the claim might just be based on the impact of the recession, or a change in the law. Policy and expenditure based on such a claim could be wasteful or even damaging. Also in the meantime, there are calls, based partly on our prior evidence on this, to reform the Pupil Premium so that the rate of funding is at least partly based on the length of time a pupil has been eligible for FSM (Henshaw Citation2018; Social Mobility Commission Citation2019).
Disclosure statement
No potential conflict of interest was reported by the authors.
Additional information
Funding
Notes on contributors
Stephen Gorard
Stephen Gorard is Professor of Education and Public Policy, and Director of the Evidence Centre for Education, Durham University (https://www.dur.ac.uk/). He is a Fellow of the Academy of Social Sciences, member of the British Academy grants panel, and Lead Editor for Review of Education. His work concerns the robust evaluation of education as a lifelong process, focused on issues of equity, especially regarding school intakes. He is author of around 30 books and over 1,000 other publications. He is funded by the ESRC to investigate measures of educational disadvantage and how such measures can be used for educational improvement.
Nadia Siddiqui
Dr Nadia Siddiqui is Associate Professor at Durham University Evidence Centre for Education, and Fellow of the Higher Education Academy. She is an introducer for the ESRC Grant Assessment Panel for secondary data analysis, and is investigating the relationship between measures of household income and indicators of disadvantage, and the uptake of STEM opportunities.
Beng Huat See
Dr Beng Huat See is Associate Professor at Durham University Evidence Centre for Education, and a Fellow of the Royal Society of Arts, Fellow of the Higher Education Academy and the Wolfson Research Institute at Durham University. She is a member of the ESRC Grant Assessment Panel and grants reviewer for the National Centre for Science and Technology Evaluation of Kazakhstan. Her work largely involves reviews and synthesis of evidence in education, evaluation of large-scale RCTs and re-analysis of secondary data.
References
- Allen, R. 2018. “The Pupil Premium Is Not Working.” https://rebeccaallen.co.uk/2018/09/10/the-pupil-premium-is-not-working/
- Baird, S., C. McIntosh, and B. Özler. 2011. “Cash or Condition? Evidence from a Cash Transfer Experiment.” The Quarterly Journal of Economics 126 (4): 1709–1753. doi:10.1093/qje/qjr032.
- Carpenter, H., I. Papps, J. Bragg, A. Dyson, D. Harris, K. Kerr, L. Todd, and K. Laing. 2013. Evaluation of Pupil Premium. London: DfE. http://dera.ioe.ac.uk/18010/1/DFE-RR282.pdf
- Chmielewskia, A. 2019. “The Global Increase in the Socioeconomic Achievement Gap, 1964 to 2015.” American Sociological Review 84: 517–544. doi:10.1177/0003122419847165.
- Chowdry, H., E. Greaves, and L. Sibieta. 2010. “The Pupil Premium: Assessing the Options.” IFS Commentary C113. https://www.ifs.org.uk/comms/comm113.pdf
- Copeland, J. 2018. “A Critical Reflection on the Reasoning Behind, and Effectiveness Of, the Application of the Pupil Premium Grant within Primary Schools.” Management in Education. doi:10.1177/0892020618781234.
- Danhier, J. 2018. “How Big Is the Handicap for Disadvantaged Pupils in Segregated School Settings?” British Journal of Educational Studies 66 (3): 341–364.
- De Janvry, A., F. Finan, E. Sadoulet, and R. Vakis. 2006. “Can Conditional Cash Transfer Programs Serve as Safety Nets in Keeping Children at School and from Working When Exposed to Shocks?” Journal of Development Economics 79 (2): 349–373. doi:10.1016/j.jdeveco.2006.01.013.
- DfE. 2018a. “Opportunity Area Programme.” https://www.gov.uk/government/publications/opportunity-area-programme-research-and-analysis
- DfE. 2018b. “National Curriculum Assessments at Key Stage 2 in England, 2018 (revised).” https://assets.publishing.service.gov.uk/government/uploads/system/uploads/attachment_data/file/764997/Key_stage_2_text_v7.pdf
- DfE. 2018c. “National Curriculum Assessments at Key Stage 2 in England, 2018 (revised).” https://assets.publishing.service.gov.uk/government/uploads/system/uploads/attachment_data/file/764135/Key_stage_2_text_v6.pdf
- DfE. 2018d. “Revised GCSE and Equivalent Results in England, 2016 to 2017, SRF 01/2018.” https://assets.publishing.service.gov.uk/government/uploads/system/uploads/attachment_data/file/676596/SFR01_2018.pdf
- DfE. 2019. “Pupil Premium: Funding and Accountability for Schools.” https://www.gov.uk/guidance/pupil-premium-information-for-schools-and-alternative-provision-settings?utm_source=2e5c52b2-c00c-4268-82c5-e809ff49194d&utm_medium=email&utm_campaign=govuk-notifications&utm_content=immediate#measuring-the-effectiveness-of-your-approach
- Dickerson, A., K. Maragkou, and S. McIntosh. 2018. “The Causal Effect of Secondary School Peers on Educational Aspirations.” CVER Discussion Paper Series - ISSN 2398-7553, October. http://cver.lse.ac.uk/textonly/cver/pubs/cverdp017.pdf
- Education and Skills Funding Agency. 2018. “Pupil Premium Grant 2018 to 2019.” https://www.gov.uk/government/publications/pupil-premium-conditions-of-grant-2018-to-2019/pupil-premium-2018-to-2019-conditions-of-grant
- Education Endowment Foundation. 2017. “The Attainment Gap.” https://educationendowmentfoundation.org.uk/public/files/Annual_Reports/EEF_Attainment_Gap_Report_2018_-_print.pdf
- Education Policy Institute. 2017. “Closing the Gap? Trends in Educational Attainment and Disadvantage.” August.
- Exley, S. 2015. “Pupil Premium ‘has Failed to Close Attainment Gap’, Thinktank Claims.” Times Educational Supplement, September 4.
- Fellows, T., and M. Barton. 2018. “Spotlight on Disadvantage.” National Governance Association. https://www.nga.org.uk/About-Us/Campaigning/Spotlight-on-Disadvantage.aspx
- Foster, D., and R. Long. 2018. “The Pupil Premium.” House of Commons Library Briefing Paper 67007. file:///C:/Users/nbuser/Downloads/SN06700%20(1).pdf
- Freedman, S., and S. Horner. 2008. “School Funding and Social Justice.” Policy Exchange. https://www.policyexchange.org.uk/wp-content/uploads/2016/09/school-funding-and-social-justice-oct-08-3.pdf
- Glazerman, S., A. Protik, B. Teh, J. Bruch, J. Max, and E. Warner. 2013. “Transfer Incentives for High-performing Teachers: Final Results from a Multisite Randomized Experiment.” Executive Summary, NCEE 2014-4004. Washington, DC: National Center for Education Evaluation and Regional Assistance, Institute of Education Sciences, US Department of Education.
- Gorard, S. 1999. “Keeping a Sense of Proportion: The “politician’s Error” in Analysing School Outcomes.” British Journal of Educational Studies 47 (3): 235–246. doi:10.1111/1467-8527.00116.
- Gorard, S. 2005. “Academies as the ‘future of Schooling’: Is This an Evidence-based Policy?” Journal of Education Policy 20 (3): 369–377. doi:10.1080/02680930500117321.
- Gorard, S. 2009. “Does the Index of Segregation Matter? the Composition of Secondary Schools in England since 1996.” British Educational Research Journal 35 (4): 639–652. doi:10.1080/01411920802642389.
- Gorard, S. 2012. “Who Is Eligible for Free School Meals?: Characterising FSM as a Measure of Disadvantage in England.” British Educational Research Journal 38 (6): 1003–1017. doi:10.1080/01411926.2011.608118.
- Gorard, S. 2015. “The Complex Determinants of School Intake Characteristics, England 1989 to 2014.” Cambridge Journal of Education 46 (1): 131–146. doi:10.1080/0305764X.2015.1045446.
- Gorard, S. 2018. Education Policy: Evidence of Equity and Effectiveness. Bristol: Policy Press.
- Gorard, S., and N. Siddiqui. 2019. “How Trajectories of Disadvantage Help Explain School Attainment.” SAGE Open 9: 215824401882517. forthcoming. doi:10.1177/2158244018825171.
- Gorard, S., and C. Taylor. 2002. “What Is Segregation? A Comparison of Measures in Terms of Strong and Weak Compositional Invariance.” Sociology 36 (4): 875–895. doi:10.1177/003803850203600405.
- Gov.uk. 2010. “Government Announces Pupil Premium to Raise Achievement.” https://www.gov.uk/government/news/government-announces-pupil-premium-to-raise-achievement
- The Guardian. 2014. “State Schools May Prioritise Poorest Pupils in Admissions Revamp.” The Guardian, July 22. https://www.theguardian.com/education/2014/jul/22/state-schools-prioritise-disadvantaged-pupils-admissions-reform
- Hanushek, E. A., P. E. Peterson, L. M. Talpey, and L. Woessmann. 2019. “The Achievement Gap FAILS TO CLOSE: Half Century of Testing Shows Persistent Divide between Haves and Have-nots.” Education Next 19 (3): 8+.
- Henry, G., C. Fortner, and C. Thompson. 2010. “Targeted Funding for Educationally Disadvantaged Students: A Regression Discontinuity Estimate of the Impact on High School Student Achievement.” Educational Evaluation and Policy Analysis 32 (2): 183–204. doi:10.3102/0162373710370620.
- Henshaw, P. 2018. “Call to Use FSM History to Better Target Pupil Premium.” SecEd, February 7. http://www.sec-ed.co.uk/news/call-to-use-fsm-history-to-better-target-pupil-premium/
- Hewstone, M., A. Ramiah, K. Schmid, C. Floe, M. van Zalk, R. Wolfer, and R. New. 2018. “Influence of Segregation versus Mixing: Intergroup Contact and Attitudes among White-British and Asian-British Students in High Schools in Oldham: England.” Theory and Research in Education 16: 179–203. doi:10.1177/1477878518779879.
- Holmlund, H., S. McNally, and M. Viarengo. 2010. “Does Money Matter for Schools?” Economics of Education Review 29 (6): 1154–1164. doi:10.1016/j.econedurev.2010.06.008.
- Hough, H., and S. Loeb. 2013. “Can a District-level Teacher Salary Incentive Policy Improve Teacher Recruitment and Retention?” Policy Brief 13-4, Policy Analysis for California Education, PACE. https://www.aeaweb.org/articles?id=10.1257/aer.101.3.460
- House of Commons Education and Skills Committee. 2004. “Secondary Education: School Admissions Fourth Report of Session 2003–04 Volume II.” https://publications.parliament.uk/pa/cm200304/cmselect/cmeduski/58/58ii.pdf
- Hutchings, M., C. Greenwood, S. Hollingworth, A. Mansaray, and S. Rose with Minty, S. and Glass, K. 2012. “Evaluation of the City Challenge Programme.” https://www.gov.uk/government/uploads/system/uploads/attachment_data/file/184093/DFE-RR215.pdf
- Lessof, C., A. Ross, R. Brind, C. Harding, E. Bell, and G. Kyriakopoulos. 2018. “Understanding KS4 Attainment and Progress: Evidence from LSYPE2.” Research report, DFE. https://assets.publishing.service.gov.uk/government/uploads/system/uploads/attachment_data/file/748514/Understanding_KS4_LSYPE2_research-report.pdf
- Lord, A., J. Easby, and H. Evans. 2013. “Pupils Not Claiming Free School Meals.” DfE. https://assets.publishing.service.gov.uk/government/uploads/system/uploads/attachment_data/file/266339/DFE-RR319.pdf
- Mbiti, I., K. Muralidharan, M. Romero, Y. Schipper, C. Mandak, and R. Rajani. 2019. “Inputs, Incentives, and Complementarities in Education: Experimental Evidence from Tanzania.” NBER Working Paper No. 24876. https://www.nber.org/papers/w24876
- Morley, S., and D. Coady. 2003. From Social Assistance to Social Development: Targeted Education Subsidies in Developing Countries. Washington DC: Peterson Institute Press: All Books.
- NASEN. 2014. “The Pupil Premium A Quick Guide to Maximising the Impact of Additional Funding for Disadvantaged Pupils.” file:///C:/Users/czwc58/Downloads/pupil_premium.pdf
- National Audit Office. 2015. “Funding for Disadvantaged Pupils.” June, 11.
- NGA. 2018. “Characteristics of the Most Effective Pupil Premium Strategies Revealed in Research Report.” National Governance Association. https://www.nga.org.uk/News/NGA-News/July-2018-Sept-2018/Characteristics-of-the-most-effective-pupil-premiu.aspx
- Public Accounts Committee. 2015. “Funding for Disadvantaged Pupils.” HC 327, 9 October
- Rutkowski, D., L. Rutkowski, J. Wild, and N. Burroughs. 2018. “Poverty and Educational Achievement in the US.” Journal of Children and Poverty 24 (1): 47–67. doi:10.1080/10796126.2017.1401898.
- Social Mobility Commission. 2016. “State of the Nation 2016: Social Mobility in Great Britain.” November. https://assets.publishing.service.gov.uk/government/uploads/system/uploads/attachment_data/file/569410/Social_Mobility_Commission_2016_REPORT_WEB__1__.pdf
- Social Mobility Commission. 2019. “State of the Nation 2018–19.” https://assets.publishing.service.gov.uk/government/uploads/system/uploads/attachment_data/file/798404/SMC_State_of_the_Nation_Report_2018-19.pdf
- Speck, D. 2019. “Schools Lose £93m a Year in Pupil Premium.” TES, June 7. https://www.tes.com/news/exclusive-schools-lose-ps93m-year-pupil-premium
- Staufenberg, J. 2019. “Re-focus Pupil Premium on Teacher Retention and CPD, Say MPs.” Schools Week, February 21. https://schoolsweek.co.uk/re-focus-pupil-premium-on-teacher-retention-and-cpd-say-mps/
- Steele, J., R. Murnane, and J. Willett. 2010. “Do Financial Incentives Help Low-performing Schools Attract and Keep Academically Talented Teachers? Evidence from California.” Journal of Policy Analysis and Management 29 (3): 451–478. doi:10.1002/pam.v29:3.
- Strand, S. 2010. “Do Some Schools Narrow the Gap?” School Effectiveness and School Improvement 21 (3): 289–314. doi:10.1080/09243451003732651.
Appendix
Table A1. Lowest adjusted (residual) attainment gaps, local authorities, England 2015
Table A2. Lower adjusted (residual) attainment gaps, local authorities, England 2015
Table A3. Higher adjusted (residual) attainment gaps, local authorities, England 2015
Table A4. Highest adjusted (residual) attainment gaps, local authorities, England 2015