
ABSTRACT
This article analyses the mechanisms that contribute to differences in educational choice in the transition from the second to the third stage of secondary education in Flanders, a highly tracked educational system. The study programme chosen in the eleventh grade, besides being quite predictable from the educational position in the tenth grade and school performance, is also affected by social class, ethnic background and gender. Using data gathered from pupils, their parents and their teachers, this study (N = 4389) tests a broad range of factors put forward by rational action theory, cultural reproduction theory and the Wisconsin status attainment model. As proposed by rational action theory, relative risk aversion affects educational choice. However, it does not explain the SES effect. Pupils’ academic self-esteem and their time perspective do have some potential to explain SES differentials in educational choice, as hypothesised by rational action theorists, and as can be expected from cultural explanations for educational inequality as well. In addition, expectations of significant others (parents, as well as teachers) are important predictors for subsequent educational choice and explain part of SES differences. Finally, classic cultural indicators of the parental home do not seem to affect educational choice beyond their effects on performance.
1. Introduction
Social inequalities in educational attainment can be attributed to social differences in both educational performance and in the educational choices that pupils, or their parents, make. The French sociologist Boudon (Citation1974) referred to these two components in the production of educational inequality as the primary and the secondary effects of social stratification on educational attainment. He stressed that the secondary effects of stratification – the educational attainment differentials after removing the primary effects – are at least as important as their primary effects, even when these stand out much less than performance differences. Because educational choices transform quantitative performance differences into categorical differences, they have cumulative, often irreversible, effects on educational careers and attainment.
In this article, we analyse educational choice in the transition from the second to the third stage of secondary education (at about the age of 16) in Flanders (northern part of Belgium). By providing context on Flanders as a case, we contribute to keeping the scope of the current literature on educational choice broad. A large body of the literature is informed and tested mostly based on a limited number of countries (mostly the US, the UK, Germany, Sweden, the Netherlands, and in fewer numbers Denmark and France). At least when considering educational systems as systems, and considering the (historically grown) unicity of each educational system, it is important to involve studies from other countries both in theory development and testing. Characteristic of Flemish secondary education is its very detailed structure of multiple stages successively branching out into a variety of educational programmes, offering many routes for continuing on track and downward but not upward mobility.
The literature on educational choice often links these choices to educational tracking. Indeed, in many educational systems, choice is an important determinant of educational attainment, in particular when in the context of early tracking, children and their parents must choose between tracks that lead to different educational degrees (Jacob and Tieben Citation2009; Van de Werfhorst and Mijs Citation2010), increasing social background effects on educational attainment (Heisig, Elbers, and Solga Citation2020). As in the Netherlands and Germany, Flanders has a highly tracked educational system, which not only introduces choice at an early age but forces making choices at successive branching points in secondary education. Studies tend to focus on the initial educational (track) choice. Fewer studies explicitly analyse educational choice at later transitions in secondary education. However, opportunities for mobility between tracks at the later stages often strengthen the initial advantages of socially privileged groups (Jacob and Tieben Citation2009; Buchholz et al. Citation2016; Henninges, Traini, and Kleinert Citation2019). With age, young people’s decision-making might become more independent of parents, necessitating research to test whether the factors that explain the early choices affect the later choices similarly. In addition, these later choices in secondary education tend to be crucial for the transition to higher education, increasing the relevance of these later choices considering the growth of higher education.
We use a large-scale and very rich panel dataset on pupils’ educational careers, which allows us to study the mechanisms that explain educational choice differentials in the final stage of secondary education in Flanders. Data was collected from pupils, from their parents and from their teachers, as well as measures of educational performance, in tenth grade, which we linked to pupils’ subsequent educational position in eleventh grade (prospective study design).
2. Explanations for educational choice differentials
The most widely cited explanatory model for social differences in educational choice in the current literature was developed by Breen and Goldthorpe (Citation1997). From rational action theory, their model assumes that individual’s educational decisions result from their evaluation of the perceived probability of success; the expected costs (direct and opportunity costs, material as well as social and cultural factors); and the expected utility of a particular educational investment. Socioeconomic differentials in resources and constraints enter into each of these three elements, which explains socioeconomic differences in educational choice. Socioeconomic differences in the utility of educational levels are assumed to follow from the mechanism of relative risk aversion by which is meant that individuals avoid downward social mobility because they aim at maintaining their family’s social position (status maintenance). It implies that lower social class children aim less high because at some point, when they have reached a position similar to their parents – a threshold that they reach earlier than higher class children – continuing to a higher educational level is not necessary to avoid downward social mobility, and might entail higher costs.
The main advantage of this rational action model is that it breaks down the complex process of educational decision-making into different elements that can be studied separately in empirical research. A very high number of studies have, indeed, applied this rational action perspective. Some studies looked into the role of costs and probabilities of success (e.g. Barone et al. Citation2018; Bernardi and Cebolla-Boado Citation2014; Daniel and Watermann Citation2018; Holm, Hjorth-Trolle, and Jæger Citation2019; Tolsma, Need, and de Jong Citation2010). Most of these confirmed that these factors affect educational choice as hypothesised; and ability or performance alone do not seem to explain socio-economic differentials in self-assessed success probabilities.
Many findings have also been reported supportive for the status maintenance motive in educational decisions, although most empirical studies do not operationalise the mechanism but rather test the model indirectly (Barone, Barg, and Ichou Citation2021). Other studies, on the other hand, focused more explicitly on the relative risk aversion mechanism (e.g. Gabay-Egozi, Shavit, and Yaish Citation2010; Holm and Jæger Citation2008; Jæger and Holm Citation2012; Stocké Citation2007; Van de Werfhorst and Hofstede Citation2007; Zimmerman Citation2020). Their conclusions vary more, and suggest that the mechanism might be relevant for educational decisions but seems to able to explain only a rather limited part of socioeconomic differentials in educational choice.
Several authors have argued for the need to scrutinise the conceptualisation of social differences in the perceived utility of (additional) education (e.g. Tutić Citation2017; Barone, Barg, and Ichou Citation2021). Breen, van de Werfhorst, and Jæger (Citation2014) developed a model within the rational action framework that included individual risk aversion and the time perspective of pupils or students to attain status (which they call time discounting preference; see also further) as central predictors capable of producing the relative risk aversion mechanism. Individual risk assessments seem less important for higher SES students, who can draw on parental resources to pursue long-term objectives of high status.
This rational action theory perspective on educational choice, which focusses explicitly on educational decision-making beyond educational performance differences, integrates many insights from research on educational inequalities. Nevertheless, complementing this with a number of insights from sociological perspectives that focus on socioeconomic differences in educational attainment more in general might further improve our understanding of the mechanisms of educational inequality. In particular, from two research traditions, we highlight elements that are related to social differences in perceptions on the utility of education.
First, from cultural reproduction theory (Bourdieu and Passeron Citation1977), the concept of cultural capital is used to explain social class differences in educational attainment. Cultural resources are more readily available in higher social classes and are closely related to the kinds of knowledge, behaviour and attitudes that are most highly valued by teachers and in education more general. Related to the notion of cultural capital is the notion of social capital. Membership of social networks adds to social capital, which enables us to maintain favourable social positions, as do other resources (Bourdieu Citation1986) and provides parents with information relevant to making well-informed educational choices (Coleman Citation1988; Boone and Van Houtte Citation2013; Seghers, Boone, and Van Avermaet Citation2019; Forster and van de Werfhorst Citation2020).
A study in the Netherlands by Van de Werfhorst and Hofstede (Citation2007) concluded that cultural capital, even though relevant for educational performance (primary effects of social class on educational attainment), did not seem to affect educational choice net of educational performance (secondary effects), whereas the relative risk aversion mechanism did seem to be a powerful predictor of further schooling ambitions. In sociology of education studies, however, cultural capital has often been operationalised as high-status cultural participation (highbrow culture; e.g. Jæger Citation2009; Van de Werfhorst and Hofstede Citation2007). From a Bourdieuian perspective cultural capital entails much more, which is important in particular for understanding educational inequality (e.g. Reay Citation2004; Calarco Citation2014), such as parents’ strategic knowledge of the educational system and pupils ‘sense of entitlement’ (Lareau Citation2015; Emery et al. Citation2020). A Flemish study on the transition from primary to secondary education (Boone and Van Houtte Citation2013) also did not find strong effects of cultural capital (also measured more broadly, centred on knowledge of the educational system) and social capital, but concludes from qualitative research that social perceptions of and parents’ opinions on educational options do seem important for understanding class differences in educational choice.
Second, perceptions of the utility of education, relative risk aversion or time-discounting preferences, and in particular social differences therein, can be related to the influence of others in educational decision-making. Research by the Wisconsin school (Sewell, Haller, and Ohlendorf Citation1970; Sewell, Hauser, and Wolf Citation1980; Sewell and Hauser Citation1975) extended the model of status attainment of Blau and Duncan (Citation1967), to model how social positions are passed on from parents to the next generation. Characteristic for the Wisconsin-model, is the central role of expectations of significant others (parents, teachers and peers) and aspirations of pupils themselves to explain why children from higher SES more than others move on to higher education and end up in higher status occupations, even when taking into account differences in educational performance (Haller and Portes Citation1973; Bozick et al. Citation2010; Gregory and Huang Citation2013). A recent study (Zimmerman Citation2020) evaluated the role of elements of the rational choice perspective as well as social influence mechanisms (cf. Wisconsin model of status attainment) in educational aspirations of German pupils and concludes that both rational choice factors (i.e. costs, perceived probability of success and the motive of status maintenance) and social influences (i.e. parents’ expectations and friends’ aspirations) explain aspirations and the secondary effects of class (differentials controlled for performance differences).
In our study, we analyse educational choice – controlled for educational performance – and include elements from all three perspectives: key elements proposed by rational action theory related to relative risk aversion and time discounting preference; indicators for social and cultural capital (also more broadly measured, i.e. by the direct measurement of pupils’ perception of the utility of education); and expectations of ‘significant others’ (Wisconsin model) thus capitalising on the strength of our data collected from different relevant actors (pupils, teachers and parents). Informed by the findings of the previous studies cited above, we expect that the indicators from the rational action perspective will have substantial effects for educational choice, although not always explain differences by social class. We expect these effects to remain also when taking into account additional predictors from the other perspectives. Cultural capital will have no direct effect for educational choice (only through affecting attainment), at least as measured by classic indicators. And we expect a significant impact of others’ expectations. In addition, we expect that a more direct measure of the perceived utility of education could be important for educational choice, as well as explain (part of) social class differentials in educational choice.
3. Context of the study: Flemish educational choices
In Belgium, the language communities (Dutch, French, and German speaking communities) are responsible for educational policy. Flanders is the Dutch-speaking northern part of Belgium. Flemish education is regarded as of high quality, but with large social inequalities in educational transitions (Boone and Van Houtte Citation2013) and learning outcomes (e.g. OECD Citation2016), in part due to its system of (early) tracking. Primary education in Flanders is comprehensive, and study options start to diverge in secondary education (see also ). Secondary education starts at age of 12 (grade 7), and consists of six grades (sometimes seven), organised in three stages, which pupils are supposed to complete at the age of 18 (age of compulsory education). From the second stage (grade 9) on, education is organised in four types (or track levels): general (ASO; broad foundation for tertiary education), art (KSO; combines general education with active art education), technical (TSO; emphasis on general and technical subjects) and vocational education (BSO; practice-oriented, preparing for the labour market). The first stage (grades 7 and 8) consists of two streams, with an A class that gives access to general, art and technical education and a B class (for pupils with learning difficulties) which grants direct access to vocational education only.
Figure 1. The structure of the educational system in Flanders.
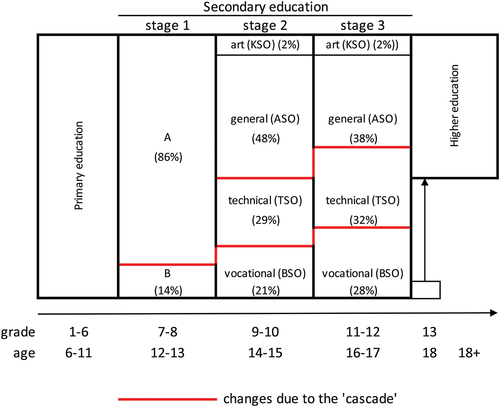
Pupils not only need to choose between these four types but also between different study programmes (‘studierichtingen’). Each track level offers a set of specific study programmes, characterised by specific subjects and accents. The number of different study programmes increases in each stage: (1) in the first stage, sets of optional subjects supplement the common core curriculum; (2) from the second stage (grade 9) on, study programmes start to diverge more; (3) in the third stage (grade 11) study programmes specialise even further, preparing for specific occupations or educational pathways in tertiary education. Examples of study programmes in academic education are Latin and Sciences in the second stage, and Latin-Mathematics and Modern Languages-Economics in the third stage, in technical education Business Administration, Construction Techniques and Tourism. Subject choice is not the most accurate term to describe these study programmes, as these consist of core subjects common for all programmes (e.g. first language, mathematics and physical education) supplemented with grouped sets of other subjects. This also allows secondary schools to group pupils in classes based on the choice of study programme.
At each of the three stage transitions in secondary education, pupils need to make an educational choice. Every choice limits some subsequent options, even though their consequences are often more implicit than explicit. First, within secondary education, choices are not presented as hierarchical and changing educational type or study programme is officially possible until within the third stage. In practice, however, tracks and study programmes have different prestige, and movements between tracks are mostly in one direction (from general to technical to vocational education, ‘upward’ mobility is possible only in exceptional cases). In fact, starting secondary education in the most demanding and prestigious study programmes, and changing later, because of learning problems, to less demanding tracks or programmes, is quite common (this is called the ‘cascade’ system, resulting in a distribution of pupils over tracks that changes with their progression through the educational system: declining proportions in general education and increasing proportions in vocational education, see ). This type of ‘downward’ mobility takes place often without even having to repeat a year (repeating years in case of ‘failure’ is another common route taken by pupils to be able to continue in the same track).
Second, access to tertiary education is very liberal. Anyone who graduates from secondary education (in vocational education only after an extra year) is allowed to enrol in higher education. Participation in specific study programmes is not required for enrolment in specific higher education institutions or programmes, nor do grades or achievement levels matter (except for Medicine for which applicants need to pass an entry exam). However, both transition rates and success probabilities vary strongly with type and study programme. For each secondary education’s study programme Flemish education policy even calculated the probabilities of success in tertiary education, which are used to inform and improve pupils’ educational choice of study programme in secondary education. Previous research (Pinxten et al. Citation2012) also found that (in the academic track) educational choice in this last stage is affected by occupational interests more than in the earlier stage in which prior achievement is a more important predictor of option choice.
These particular elements of the Flemish educational system – the class groups based on choice of study programme, the hierarchical nature of the tracking system, although more covert than structurally embedded – affect pupils’ life in many ways. Previous research has shown large differences between pupils from different educational tracks both in educational performance (Van de Gaer et al. Citation2006) and in how pupils feel (e.g. sense of futility Van Houtte Citation2016; Van Houtte and Stevens Citation2015; self-esteem Van Houtte, Demanet, and Stevens Citation2012; Van Praag et al. Citation2017; academic self-concept Dockx, De Fraine, and Vandecandelaere Citation2019; perceptions of education Spruyt et al. Citation2016).
4. Data and methods
For this study, we use unique data that were collected as part of the LiSO project (Dutch abbreviation for Trajectories in Secondary Education), which is a panel study following a cohort of pupils from the start until the end (six grades) of secondary education in Flanders. The LiSO data collection started in September 2013 with pupils who were in the first grade of the first stage (grade 7) of secondary education in 57 schools (regional sampling, representative of Flanders, except for the art track; Stevens et al. Citation2015). For our current study, the sample consisted of pupils from the same schools who were surveyed in Spring 2017 and who were then in the tenth grade (end of the second stage) of secondary education (including but not limited to pupils from the initial cohort). This sample consists of 6585 pupils from 56 schools (response rate of 92%; Van den Branden et al. Citation2018c).
For our analyses of educational choice, we excluded pupils from the vocational track (19,4%), because in many ways this group in Flemish educational system is treated differently: it takes an additional year to obtain the degree of secondary education, they have much fewer opportunities for changing tracks (if changing tracks they have to repeat their grade), their only real options are to switch to special education or to leave full-time secondary education for part-time (dual system) vocational education, both implying a different type of educational choice (and routes that are not taken very often; in our sample by less than 2%). In addition, we focussed on those pupils (84,4%) who could make an unrestricted choice, that is, their options were not limited by the school itself (i.e., received a so-called A-attest in tenth grade). In this way, we put our assessment of social differences in educational choices to a conservative test (as restricted choices result from low study performance). These selections and a small number of missing values on the dependent variable (see further) result in a final sample size of 4389 pupils from 55 schools and 31 different study programmes in grade 10. These pupils are distributed over 261 unique combinations of schools and study programmes. This illustrates that not all possible combinations exist, i.e. schools typically offer a number of study programmes, but not all. In our models, we account for this clustering in both schools and study programmes (by including these as two cross-classified factors at the second level in our models, see further in 4.4 Method).
The LiSO instruments and surveys offer a lot of information on potentially relevant factors for educational choice differentials. In May 2017 (tenth grade), pupils were administered tests and a range of questions including school-related perceptions and more individual attitudes (many of the latter were specifically included by us to test the mechanisms of educational choice) within the classroom. At the same time, teachers were surveyed both in general and with specific questions about each of their pupils. Finally, data was also collected from the parents who were surveyed in the first wave that their child was part of the LiSO project.Footnote1
We linked these data to the actual educational choice that the pupils make afterwards, in the transition to the next year (third stage/eleventh grade). Because of this prospective research design – educational choice is linked to attitudes and opinions that are surveyed before the transition is made – the causality is clearer than, as in most studies on educational inequality, with the use of cross-sectional data – when questions about attitudes and motives to understand the mechanisms are linked either to (retrospective) educational choices or track changes in the previous educational trajectory or to expectations about future educational decisions or educational aspirations.
4.1. Dependent variable: educational choice
To assess the educational choices that pupils make in the transition after the fourth grade, information about their educational position in the next school year was retrieved from the schools during the next school year and from searches in administrative data on school enrolments by the Department of Education. For 99,0% of the original group of pupils of the tenth grade, the subsequent educational position could be traced (The 66 pupils that could not be found in the educational register, either dropped out or moved on to a non-Flemish educational institution).
To characterise the educational choices that pupils make in the transition from the second to the third stage (tenth to eleventh grade), we needed to find a way to compare study programmes of their tenth-grade origin (31) with those of their destination in the eleventh grade (74). Even though study programmes are organised within track levels and study domains describing the main subject orientations, the educational structure does not define the succession of study programmes from the second to the third stage. To proceed, first we determined for each of the study programmes in the second stage, the most common study programme chosen in the third stage (based on sample counts), which we call the standard choice (in a purely statistical sense) (e.g. for Sciences this is Sciences-Mathematics, for Economics this is Modern Languages-Economics, Elektromechanics for Elektromechanics, Office Administration-Languages for Trade-Languages). In all 31 cases, this standard choice is a destination programme with the same track level and subject domain as the study programme of origin. Clearly, for the majority of pupils (68,8%) the specific study programme that is chosen is the programme that is chosen most often by peers from their previous study programme. Next, we related the other study programmes of destination to these standard follow-up programmes, by comparing the track level and hours of mathematics (as indicators of the level of mathematics, and more in general of the level of complexity and tempo of instruction). Combining these two steps, our educational choice measure consists of two categories: ‘staying on track’ with pupils who continue in a study programme in the same track level and with the same number of hours of mathematics (or more, although this is rare) as in the standard continuation programme (82,5%), or they move ‘downwards’, to less demanding study programmes, which includes those pupils that change track level (2,8%, in the direction of academic over arts, technical to vocational) as well as those that choose a study programme in the same track level but with fewer hours of mathematics (14,7%). The use of the level of mathematics in this operationalisation is a pragmatic choice, as there is no generally agreed upon classification of study programmes in Flanders. We do not imply that mathematics is the sole or best criterion to evaluate different study programmes, however study programmes with an important mathematics component are generally perceived as academically challenging and prestigious, and the number of hours proved to be useful for a longitudinal characterisation of pathways. Indeed, characteristic of the standard follow-up programmes as identified above based on size, is their relatively high number of hours of mathematics: from the same starting position, the standard choice is the option in which the number of mathematics is the highest (or equally high) compared to the alternative options that students in reality choose (not necessarily compared to students in other programmes of origin). We take this to suggest that students (and their parents) aim at maintaining a high level of mathematics, much in the same way as they aim at maintaining their track level. This characterisation of educational choice matches the general opportunity structure in Flemish education, with almost no possibilities for upward mobility.
4.2. Independent and control variables
Our measure for SES is a standardised score resulting from Item Response Theory scoring (i.e. using nominal response model analysis; Chalmers Citation2012) based on parents’ reports of both parents’ educational levels, their working situations and occupational classes, and family income category (for details on these variables see Vandenbroeck et al. Citation2017), as well as administrative data on educational deprivation (e.g. school allowance and educational deprivation of the neighbourhood) which in Flanders are used to provide schools with a high concentration of disadvantaged pupils with additional means. See also sample descriptives in (including imputed values, see also our handling of missing values further).
For migration background, we include the generation of migration (based on register data for pupils’ nationality, and the parents’ reports on the country of birth of the pupil, of each of the parents and of all the grandparents). Overall, 19.4% of our sample has some migrant background. Migrant background is underestimated for those whose parents did not fill out the survey (6.4%) because in the case of missing data for countries of birth we could only use nationality to either assign them to the reference category of Belgians or to first-generation migrants. In addition, we include the use of a foreign language as indicator for a migrant background, which is available from the administrative data without missing values (8.2% speaks another language at home than Dutch, which is the instruction language).
Other background variables that we include, are gender (51.2% girls), and whether pupils have moved between communes between the 2 years of observation (1.4%) because that increases the probability that they also changed schools and so perhaps also curricular track.
Educational performance was measured by a competence test for mathematics (Van den Branden Citation2018b) and a reading test (Van den Branden Citation2018a). For the respective tests, 33 and 35 test items were developed that reflected the learning goals defined for the specific grade in secondary education and were based on frequently used books. Item-Response Theory (IRT) analyses revealed that both tests reflect a unidimensional construct, indicating that they are a valid measure of students’ math and reading skills. Cronbach’s alphas range between .77 and .83. IRT was used to calculate scores for overall math and overall reading achievement, taking the difficulty of the items and students’ performance into account. In the models for educational choice, the effect of the reading test score, however, was not statistically significant, and became almost zero once also the mathematics test scores were included (correlation .533), so for the final analyses reported here only the mathematics scores are kept.Footnote2 To these tests we add, based on the age of the pupil, whether the pupil is older than the age group s/he is in at school, which suggests that year repetition has occurred in the previous educational trajectory (18,1%).
4.3. Explanatory variables
Pupils were asked to report on their academic proficiency in general, and with regard to mathematics specifically. As the mathematics self-concept has stronger effects than the general academic self-concept, and the latter has no effect when controlled for the former, we only include the mathematics self-concept (six items taken from the SDQII, Marsh Citation1992; α = .917; items are listed in ). We include this measure of pupils’ subjective evaluation of their performance next to their actual performance, to tap into the role of perceived probability of success (key factor in rational choice model of educational choice), but already in the early status attainment models its importance was recognised (and linked to the role of significant others).
Table 1. Description of key variables.
We include a measure for relative risk aversion, as was developed in Van de Werfhorst and Hofstede (Citation2007), which is comprised of 4 (out of originally 6) items that tap into the desire to do (at least) as well as their parents (see , α = .70).
In addition, we include time discounting preference (Breen, van de Werfhorst, and Jæger Citation2014), which is measured as the choice that pupils make between jobs with short term average earnings versus low short term but higher earnings on the long term, or something in between.
Parents were also asked about a wide range of behaviours they engage in with their child (talking, reading and cultural participation), from which a score for stimulating home climate is calculated (11 items; α = .74) which we use as main indicator for cultural capital. Parents also answered questions about the amount of social contacts they have with neighbours, their children’s friends, … from which we calculated a score for social capital (six items; α = .83).
To broaden the measurement of the cultural perspective on education, we include pupils’ view on education in terms of whether they see education as a means for self-realisation (intrinsic utility of education). This was constructed from reasons that pupils think that going to school is useful (three items; α = .77). This view on education corresponds to, amongst others, teachers’ opinions on education and is associated to cultural capital – pupils with more cultural capital are more inclined to see education as a means of self-realisation and self-accomplishment (Spruyt et al. Citation2016).
Finally, we include measures of expectations of the pupils as well as of significant others. Parents were asked about their child’s future educational career, we use two indicators: do they think that their child will finish secondary education in the academic educational track, and do they think that their child will start higher education at a university. The likelihood of each option was rated by the parents on a 5-point scale. Pupils themselves rated these options in the same way as the parents did. We also include expectations held by class teachers about the successfulness of the future school career of the pupil – three statements rated on a 5-point Likert scale (α = 0.95).
For the analyses, we replaced missing values on explanatory variables using multiple imputation by chained equations (MICE). The number of missing values varies by source, with virtually no missing values for administrative data (below 1%), up to about 3% for student test and questionnaire data, and higher proportions of missing data due to missing teacher survey information (up to 12.9%) and missing parent questionnaire information (up to almost 8%). The imputation was performed on the full set of the analyses variables, including the dependent variable as well as the group variables (fixed effects modelling). Modelling was adapted to the measurement level of the variables: Bayesian linear regression and predicted mean matching were used for the continuous variables (applying the first method for the six variables with many different values, due to scale construction based on at least four Likert items and the second method for the other scale variables based on fewer items), polytomous logistic regression and logistic regression for the multicategory and binary variables, respectively. We generated 10 complete datasets. Results of the repeated complete data analyses were combined by averaging estimates and with adjusted standard errors using Rubin’s rules (using the R-libraries mice, broom.mixed and mitml).
4.4. Method
In two ways do we assure to adequately measure social background differences in educational choice in this transition. First, as explained above, our measurement of the educational choice is defined relative to pupils’ initial positions – do they continue on track in the third stage or move downwards compared to their study programme in the second stage. In this way, we assess only the realistic options that are left given the position (for many positions simply assessing whether a specific study programme is chosen, does not make any sense). In addition, we assess the SES effect after controlling for educational performance. This effect refers to what is called the secondary effect of social background, i.e. the effect of SES on the choices that pupils make independent of educational performance differences. Because of our focus on the educational choice in the transition from the second to the third stage, and the strict selection of the sample, our test of the secondary effect is conservative.
We use multilevel analyses (see also note 4 on the software used) to analyse the educational choice that pupils make in the transition from the second to the third cycle, with the pupils as level one units nested – cross-classified – into schools and the curricular tracks of origin as second-level units. Using schools as grouping level is standard practice and addresses the issue of within-school correlated residuals. By including the study programmes of origin as grouping level, results are compensated for the fact that our measurement of educational choice, even this relative measurement, is not independent from the study programme of origin, as for different programmes the range of probable continuation options can vary (in more demanding study programmes demotion is more prevalent; this also clarifies why social background and test scores in are lower among the group that stays on track). The two groupings, schools and study programmes are not nested; we treat them as cross-classified i.e. we define pupils as being members of schools as well as, but independently, of the study programmes.Footnote3 Because the type of educational choice is binary, we use multilevel logistic regression models. From the unconditional mean model, it is clear that it is important to include both level two factors, as the proportion of variance of educational choice (ICC or intra-class coefficient) is .101 for the schools and .336 for the curricular track groups, both adding to 43.7% of the variance occurring at the level two grouping variables.
Table 2. Sample descriptives of pupils making the transition from second to third cycle (fourth to fifth grade) (selection based on attestation and educational track; N = 4389) – percentages or mean scores on imputed data.
The reported parameters are logit effect parameters. Model fit can be compared between models by looking at the log likelihood, and the AIC or BIC measures that incorporate model complexity. We also report a measure of explained variance (R2) which was only recently developed for generalised mixed-effect models: the marginal coefficient of determination or Pseudo-R-squared which represents the variance explained by the fixed effects (Nakagawa and Schielzeth Citation2013).Footnote4 In our models, it measures the contribution of pupil-level covariates in explaining the total variance. It is a conservative measure, as the variance at level two is rather large, but it allows us to compare the amount of variance explained by different sets of variables in the models.
Because effect parameters of different logistic models cannot be simply compared (as these depend on the error variance of the model, which depends on the predictors in the model), to evaluate how much effects are reduced (or explained) by adding additional explanatory variables, we estimated the amount of mediation of SES-effects, with unbiased parameters using the method of Karlson, Holm, and Breen (Citation2012).Footnote5
5. Results
We estimate (see ) first, a model with background characteristics (Model 1), and second, we add the indicators for educational performance (Model 2). Next, in addition to these factors, Model 3 estimates the effects of the indicators of the rational choice perspective on educational choice. Finally, we add indicators relevant to the cultural capital perspective (Model 4), and indicators related to the expectations of significant others and pupils themselves (Model 5) to see if and how these perspectives might add to the explanation of the educational choice and SES differences. The final Model 6 estimates the effects of all indicators simultaneously.
Table 3. Results logistic multilevel analyses for mechanisms in educational choice: Staying on track in transition from second to third stage (N = 4389).
5.1. Educational choice differentials
In Model 1 background characteristics are related to staying on track in the transition from the second to the third stage in secondary education. Pupils from higher SES background stay on track more often than pupils from more disadvantaged socio-economic families. The odds are 25% (exp(0.229) = 1.26) higher for an increase in SES with one standard deviation. For migration background, a few differences are found: the odds to stay on track are 40% higher for second-generation migrants (exp(0.333) = 1.40) than for pupils without a migration background, and even almost twice as high (exp(0.663) = 1.94) for pupils whose language at home is different from the instruction language in school, i.e. Dutch (controlled for SES). Thirdly, gender matters: girls more often than boys move downward (their odds for staying on track are only 63% of boys’ odds). We also included having moved to a different commune between the second and third stages as a control variable, as it could be related to changing educational programmes, but its effect is not statistically significant.
In Model 2, we control for educational performance. The scores of pupils on the mathematics test administered in the second stage affect the subsequent educational choice strongly, which is also clear from the rise in the pseudo-R2 from 1.9% to 9.0%. More interesting is whether educational performance explains background differences in educational choice. From comparing Model 2 and Model 1 it appears that ethnic background effects are not due to differences in educational performance. SES and gender effects can be attributed to performance differences for some part, but certainly not entirely (67% of the SES effect and 37% of gender is explained by the performance indicators – mediation effects estimated with unbiased parameters). Even after controlling for educational performance, significant differences remain – staying on track is more likely for high SES pupils, second-generation pupils, pupils using a different language at home, and boys.
From these results, we can conclude that higher SES pupils, in making the transition from the second to the third stage in secondary education, are more likely to stay on track instead of moving downward to a study programme with fewer hours of mathematics or in a lower track level. These effects (and explained variance) are rather small, as could be expected for this homogeneous sample (selection on educational type and previous performance) and this (final) stage in secondary education, but confirm that indeed educational choice generates differences. Next, we look into the mechanisms that might explain why higher SES pupils in this transition are more likely to stay on track.
5.2. Educational choice: explanatory mechanisms
Model 3 focuses on the key factors advanced by the rational choice perspective on educational decisions: pupils’ academic self-concept, relative risk aversion and time-discounting preference. This model has a higher predictive power (pseudo-R2 increases from 9.0% to 13.8%). Pupils’ perception of their educational performance (controlled for their actual performance) matters in particular: pupils who think more highly of their mathematical performance, are more likely to continue on track (net of actual performance in mathematics), with odds more than twice as high for a one standard deviation increase. In addition, pupils with high scores on the relative risk aversion scale, and with a high time discounting preference (preference for long-term returns), are more likely to stay on track than others. Although the SES effect seems to increase when including these indicators, when we – naively – compare the parameters (with Model 2), mediation analysis (adjusted for bias due to residual variance) reveals that about 14% of the SES-effect is explained by the factors in Model 3. Looking at the mediation effects for each of the factors separately, however, some important differences emerge. Pupils’ mathematics self-concept is important (33% mediation) and also differences in time discounting preferences help explain part of the SES differences in educational choice (13% mediation). The scale for relative risk aversion is a notable exception: the calculated mediation effect is even negative suggesting a suppressor effect (the indirect effect being the opposite of the direct effect).
Model 4 adds characteristics related to cultural capital as provided by the parents about the culturally stimulating home climate and social capital, and pupils’ appreciation of education for its intrinsic value. The classic indicators for social and cultural capital have no statistically significant impact. The same is true for the attitude of pupils regarding the intrinsic value of education, although pupils who perceive education as a means for self-realisation more strongly, tend to stay on track in the transition from the second to the third grade more often than others (p = 0.079; when leaving out the control for academic self-concept, its effect is strong, i.e. 0.168, and statistically significant at the p < 0.001 level).
From Model 5 it is clear that, on top of the key rational choice indicators, the expectations (all were measured before the transition is made) of each of the actors involved contribute to explaining the educational choices that are made: high expectations of parents, high expectations of teachers and high expectations of pupils, are all linked to pupils staying on track in the transition from the second to the third stage of secondary education (controlled for educational performance and position). Adding these expectations increases R2 from 13.9% to 20.6%, and increases the explanation of the SES-effect from 19.4% to 71.8%.
Pupils’ expectations for secondary education have the strongest effect parameters. Both pupils’ expectations about going to university and their expectations for finishing secondary education in the academic track matter. Parents’ expectations about their child’s education, are important as well (even though the effects are not reaching the significance level of 0.05 when estimated simultaneously – as they are interrelated, but they do when leaving out one of the two from the model). In particular, parents’ expectations for higher education (i.e. going to university) have a stronger positive effect (0,145 and p = 0.082; 0.178 and p = 0.019 when leaving out the expectations for academic track in secondary education) than their expectations for secondary education (0.168 and p = 0.046 when estimated without parents’ expectations for university).
Finally, teachers’ assessments of pupils’ educational achievement and future success are a strong factor predicting subsequent educational choice, even when controlled for parents’ and pupils’ own expectations. Pupils whose teachers assess them as being more able and likely to have a successful educational career, are more likely to continue on track in the transition to the third stage (odds increase with 44% for a one standard deviation increase). However, the expectations of teachers do not explain as much of the SES differential in educational choice (25.9% mediation) as the expectations of parents and pupils themselves (37.0% and 79.6%, respectively, estimated in separate models).
5.3. What explains SES effect in educational choice?
Model 6 includes all the factors of the previous models. From this model, we conclude that quite a few factors affect who stays on track in the transition from the second to the third stage (and increase the pseudo-R2 substantially: from 9.0% in Model 2 to 20.5%). Pupils’ academic self-concept and expectations are particularly important, followed by the expectations of parents and the assessment by their teachers of their educational achievement potential. The cultural and social capital indicators, again, do not matter much for educational choice independent of school performance. The two attitudes related to the rational choice perspective are moderately important.
However, the factors that are most important in explaining different educational choices do not necessarily explain SES differentials in educational choice. The parental home environment and opinions with regard to education do not reduce the SES-effect (but, the parents’ expectations do). Controlling for relative risk aversion strongly increases the effect size of SES instead of lowering it (calculated mediation is negative: −64%), since lower SES pupils demonstrate having higher relative risk aversion, which in turn is related to higher odds of staying on track. The only factors that explain (mediate) SES differences in educational choice are the expectations of significant others, pupils’ own expectations, self-concept and time preferences.
6. Discussion
In this article, we analysed educational choice in a highly tracked educational system, for the transition to the last stage of secondary education, controlled for educational performance. By providing context on the Flemish case, we contribute to the literature by adding another country to the knowledge body, thus broadening the scope of countries considered. In addition, by studying educational choice in the final stage of secondary education, our estimate of choice differentials is conservative, as previous educational performances as well as decisions have shaped to a large extent the options that are left to pupils. Nonetheless, in this later stage, and even in our homogeneous sample (excluding pupils from vocational education and those for whom the school decided to restrict the options to choose from), the SES-effect shows up, which confirms that social differences occur also in this type of educational choice.
Turning to the mechanisms we analysed, we can conclude that not a single element, but rather quite a few different factors help explain educational choice and social differences therein, underscoring the complexity of the decision-making process. On the other hand, the absence of any effect of the ‘classic’ parental home indicators is striking, as these characteristics are often deemed very important for educational attainment and have been identified in theories and research as being relevant in explaining better school outcomes for higher SES pupils and students. In our analyses, the characteristics of the parental background such as cultural capital and social capital did not affect educational choice (controlled for SES) and did not help to explain why higher SES pupils are more likely to stay on track. This finding proved to be robust in some additional analyses that we did.Footnote6 Other authors, focusing on educational choice, had similar findings (Boone and Van Houtte Citation2013; Van de Werfhorst and Hofstede Citation2007). Rather, as was also concluded by Van de Werfhorst and Hofstede (Citation2007) and confirmed in our analyses of pupils’ scores on the standardised mathematics testFootnote7, it seems that ‘cultural capital’ – at least as classically measured by high-brow culture participation – is important for educational attainment by affecting educational performance, but not for understanding the process of educational choice (net of educational performance).
On the other hand, the relative risk aversion measure did predict educational choice: pupils with higher relative risk aversion stayed on track more. The measure was designed to tap into the relative risk aversion mechanism that is central to the rational action theory approach of educational choice, referring to status maintenance and the idea that for pupils the utility of taking a higher level educational step diminishes when they have reached the level necessary to achieve the same status as their parents. Specifically, it was measured as the ambition of pupils to do as well as (or better than) their parents. We use a scale borrowed from Van de Werfhorst and Hofstede (Citation2007) and our finding matches theirs that relative risk aversion affects pupils’ educational expectations positively. In addition, we find, as did these authors, that relative risk aversion is not related to their educational performance.7
Relative risk aversion thus seems important in understanding the process of educational choice. However, both in our models and in a number of previous studies (Stocké Citation2007; Van de Werfhorst and Hofstede Citation2007; Gabay-Egozi, Shavit, and Yaish Citation2010; Zimmerman Citation2020), it does not explain (in a statistical sense) that higher SES pupils choose more ambitiously. Rather, including it in the model, increased the effect parameter of SES. This is because lower SES pupils on average score higher on the relative risk aversion measure. Van de Werfhorst and Hofstede (Citation2007) however, stress the fact that relative risk aversion is something that is universal for all pupils, independent of social class. And because it implies relative status positions that are aimed for – relative to their parents’ positions, which would translate to different absolute positions by social class – they still consider it to be an important mechanism to understand differential educational choice. Interpreted that way, the relative risk measurement is rather a different kind of formulation of pupils’ long-term aspirations. Perhaps, the measure does not quite capture the component of avoiding social demotion; perhaps a formulation of the relative risk aversion mechanism, which could try to grasp some kind of threshold in the aspired position or that would focus more on the fear of not attaining parents’ position, could help understanding the SES differentials in educational choice better (some authors indeed argue for focusing on these other aspects, e.g. Tutić Citation2017; Barone, Barg, and Ichou Citation2021).
Whereas relative risk aversion did not offer a real explanation, other indicators did explain (some of) the SES effect for educational choice. Besides the expectations of ‘significant others’, two factors that fit into the rational choice perspective on educational choice, helped explain why – at equal performance levels – higher SES pupils stayed on track more often: their higher academic self-concept and their higher time discounting perspective (preference for the larger salary in the long term). It is self-evident that pupils who have good mathematical skills (performance) and who think they do (self-concept) more often choose the study option with the higher number of hours of mathematics (which they realistically can choose from their position). The self-concept also explained half of the effect of the mathematics test scores, suggesting that better educational performance contributes to more ambitious educational choice, in large part because it enhances pupils’ self-confidence (although it might also be the other way around). Being more confident about one’s own skills and capabilities (in terms of mathematics, which is, however, strongly related to their general academic self-concept) most likely matches with higher estimates of the probability of success in the more demanding study programme (in terms of relative number of hours of mathematics). Expected success probabilities are a central element in the rational choice perspective for educational choice. The time discounting preference was also introduced as an explanatory factor in the literature inspired by this perspective.
Looking beyond the rational choice perspective, turning to cultural reproduction theory (Bourdieu and Passeron Citation1977), can clarify the meaning of these two factors and in particular their relationship with SES. In our models we see that a positive academic self-concept is related to a higher valuation of education for its intrinsic utility (i.e. what it contributes to personal development and self-realisation). Pupils who value the intrinsic quality of education more also stayed on track more (but this effect disappears after control for academic self-concept and teachers’ expectations), and higher SES pupils attach more value to the intrinsic value of education. These findings suggest that those higher SES pupils with a high academic self-concept choose to pursue a more demanding educational route also out of intrinsic motivation. In addition, the long-term perspective of higher SES pupils clearly resonates with their valuing of education as a means to self-realisation (which is also a central value in education) rather than the short-term time perspective out of economic necessity (cf. taste differences in Bourdieu Citation1979 who refers to the ‘gout de nécessité’ of working class), as well as to the self-evident expectations of (future) good positions (‘sense of entitlement’, Lareau Citation2015).
Finally, turning to the expectations of different actors, our results confirm that the educational choice as we operationalised it (relative measure), is related to high expectations for future educational attainment (absolute measures). From our analyses, it is clear that expectancies of all actors involved matter for the decision that is being made in the transition to the third stage of secondary education (net of actual educational position and performance). We do find some variations in the effects of the expectancies – each actor’s expectations affect the educational decision in a somewhat different way. Pupils stay on track more if their teachers have high expectations. Teachers’ expectancies explain part of the SES-effect (i.e. 26%), but the SES effect (pupils from higher SES stay on track more) is explained more when taking into account the expectations of parents or pupils’ themselves. Parents’ expectations are important, but it seems that the expectation that their child will go to university (which implies expectations for the academic track in secondary education) is what matters most. And finally, also pupils’ own expectations matter, not only their expectations for higher education but also their expectations for the shorter term (the end of secondary education).
It may not be surprising that pupils’ educational decisions reflect their own expectations as well as their academic self-concept, or their parents’. The contribution of teachers’ assessments of the pupils’ academic potential to SES differentials in educational choice, however, deserves some elaboration. There are multiple ways in which these can enter into pupils’ decision: perhaps teachers are particularly well placed to assess pupils’ potential (and then it is just a better measure of educational performance), but it can also be the case that teachers’ beliefs about pupils’ academic potential have real effects. First, these beliefs could be, mostly unconsciously, transferred into their behaviour and interactions with these pupils (cf. the Pygmalion effect, Rosenthal and Jacobson Citation1968). Second, these beliefs could also, more explicitly, be communicated to pupils (or their parents) by means of explicit study guidance or even formal curricular track choice recommendations (i.e. teacher track recommendations tend to be biased in favour of students from advantaged socio-economic backgrounds; e.g. Sneyers, Vanhoof, and Mahieu Citation2018; Timmermans et al. Citation2018). So, from these findings, we believe future research should look into the specific ways that teachers’ perceptions get transformed into their students’ actual choices.
The strong effects of expectations of ‘significant others’ for future educational positions make Gregory and Huang (Citation2013) conclude that positive expectations can be promotive for low SES-pupils. The problem, however, is that teachers’ expectations might be biased. Previous studies have documented that teachers tend to hold lower expectations for low SES students than for middle-class students (Wang, Rubie-Davies, and Meissel Citation2018). In our study, where student achievement was controlled for, teachers, on average, underestimated the academic potential of lower SES-pupils and held higher expectations for higher SES-pupils than could be expected from their respective educational performance. Indeed, teachers’ perceptions and expectations might be informed by beliefs and stereotypes about social class (Lorenz Citation2016; Turetsky et al. Citation2021), causing their expectancies to become part of the process of reproduction of social inequality.
One of the main limitations of our study is that we study just one particular transition rather late in a system of progressive educational differentiation. As we have emphasised, our estimate of the SES-effect is conservative. And even though we find similar tendencies as well as similar factors that come up as in other studies, it would be interesting to compare the mechanisms explaining educational choice at this transition with one earlier in the educational career. In addition, we are not able to single out which characteristics of the Flemish educational system exactly might condition or create these educational differentials, and perhaps it is even the interplay between many of them (i.e. the early, extensive, progressive tracking system, school classes organised by study programme choice, general perceptions on track levels and study programmes, the absence of standardised testing, the strong but covert rather than structurally embedded impact of educational choice for educational trajectories in tertiary education, etc.).
7. Conclusion
Summarising, different mechanisms indeed seem at play for educational performance and educational choice. Van de Werfhorst and Hofstede (Citation2007) concluded that cultural capital, while relevant for performance, does not seem relevant for understanding educational choice, for which the relative risk aversion mechanism of rational action theory is of particular importance. Our findings are quite similar to theirs: classic indicators of the home environment have no effect for educational choice (net of performance), but do affect educational performance, and relative risk aversion does affect educational choice and not educational performance.
However, relative risk aversion only offers indirect evidence (no ‘statistical’ explanation) to explain educational choice differentials; we also found other factors than relative risk aversion, which help explain educational choice and in particular also explain part of SES differentials in educational choice. The factors explaining the higher probability of staying on track among higher SES-pupils – net of educational performance – are, the expectations of teachers, parents and pupils on the one hand, and pupils’ perceptions of their academic capability, and their time discounting preferences – factors, which are meaningful mainly from other than rational choice theoretical perspectives. Our results do not only confirm the crucial role of expectations of significant others (cf. Wisconsin status attainment model), but, in our opinion, illustrate also the significance of a cultural perspective, not only for educational performance but also for educational choice, and not in particular because of specific cultural participation patterns (i.e. strict measurement of cultural capital), but rather because of the values that are transmitted between generations and how these, together with the expectations of teachers, shape the aspirations, academic self-concept and time perspective of pupils (and their parents).
In conclusion, our study of the Flemish case illustrates how tracked educational systems can reproduce social inequalities quite covertly. Educational choices at different branching points in secondary education are hardly presented as high-stakes choice, and officially access to higher education is not restricted to education types or programmes. Nonetheless, higher SES pupils remain on track more often whereas lower SES pupils move down the educational ladder more often, losing out on future opportunities in higher education, as the study programme in secondary education is a good predictor for trajectories and success rates in higher education. Indeed, students’ SES is related to their success in higher education, probably precisely because of this particular combination in Flemish education of almost unrestricted access to tertiary education (and low tuition fees as well) and higher SES students that are better prepared because of their selection into more advantageous educational pathways (similar to the conclusions in De Clercq et al. Citation2021 which relate to the French-speaking education system in Belgium). From a social and policy perspective, a clear conclusion follows: educational choice introduces or amplifies educational differences. Almost by definition. In the context of a highly tracked educational system, such as in Flanders, with a clear hierarchy of different tracks, and ample room for individual choice, these differences translate into social inequalities. In particular, it is problematic that the educational structure offers no routes for upward mobility, but almost continuously offers the opportunity to move down. That back door, always open, allows pupils to leave study programmes rather elegantly (as it is not seen as failure), which adds to its attractiveness, both for pupils or parents and for teachers and policymakers, but also masks the social reproduction as this type of switching between educational programmes does not enter into statistics on educational failure. Organised in this way, educational tracking not only inevitably contributes to social reproduction but also covers up the inequality it generates.
Data availability
The LiSO-data are maintained by the KU Leuven (https://www.lisoproject.be). The datasets generated for this study are available on request from the corresponding author.
Ethics statement
Ethical review and approval was not required for the study on human participants in accordance with the local legislation and institutional requirements. Written informed consent to participate in this study was provided by the participants’ legal guardian/next of kin.
Supplemental Material
Download MS Word (17.3 KB)Acknowledgments
We would like to thank the data collection team at the Centre for Educational Effectiveness and Evaluation at KU Leuven for their efforts in collecting and providing us with the data of the LiSO-study.
Disclosure statement
No potential conflict of interest was reported by the author(s).
Supplementary material
Supplemental data for this article can be accessed online at https://doi.org/10.1080/02671522.2023.2178497
Additional information
Funding
Notes
1. In addition, parents who had not filled in a parent questionnaire in an earlier wave were asked to do this again. The exact wave that parents filled in the parent questionnaire is not the same for all students. So the information obtained from the parents is not equally accurate (in terms of how close to the decision moment at the end of the tenth grade).
2. The final model, which includes the estimation of the reading and the mathematics test scores simultaneously, is available in the Supplementary material.
3. Clusters vary in size: school size ranges from 1 to 271 (median 65, mean 80), curricular tracks from 1 to 930 (median 45, mean 142). Even though some clusters have small group sizes (e.g. <10: 3 schools, 4 study programmes; 10–20: 6 schools, 4 study programmes), these numbers are large enough to obtain accurate estimates, in particular as our analyses focus on the effects of covariates at the pupil level (cf. simulations for multilevel cross-classified models in Chung et al. Citation2018; Doedens et al. Citation2022, in very different contexts and with cluster sizes as small as 10 on average, indicate that even small group sizes allow for accurate estimates of the effects of level 1 covariates).
4. Estimations are done with the Linear mixed effects models (lme4) package in R-project (Bates et al. Citation2015), which uses maximum likelihood estimation. The R-squared is estimated using the Multi-model inference (MuMIn) package in R-project (Bartoń Citation2019).
5. Following Karlson, Holm, and Breen (Citation2012), we re-estimated the reference models by including the residuals of the mediation variables (on all of the other variables in the reference model), and use the SES-effect in these models as the parameter to compare the SES-effect of the model which includes the mediation variables with. We report the result of this comparison (i.e. the proportion that the effect is reduced by including the mediation variables) as the amount of ‘mediation’.
6. We put the conclusion that parental home indicators do not explain (beyond SES) educational choice to two further tests. First, we ran models in which the controls for the rational choice indicators as well as educational performance are left out, but even then, the parental home indicators do not affect educational choice. Second, we also looked at other indicators of the parental home, i.e. parents’ evaluations about the importance of education and different kinds of parental home involvement and parent–teacher interactions. The indicators for parental involvement and parent–school interactions were only measured later (so the strict causal order of the other analyses does not apply here). These additional tests only confirm the conclusion that indeed for educational choice, the traditional indicators of the parental home (cultural capital, social capital, evaluation of education, home involvement) are not a driving force to explain educational choice.
7. We tested how the same explanatory factors affect educational performance itself, the other component in the process of (differential) educational attainment, as well as the educational position in the fourth grade, before making the transition to the last cycle of secondary education, which is also shaped by previous educational performance and decision making. For these additional analyses, the causal order (again) is however less clear-cut than in our analyses of educational choice, in particular with regard to pupils’ attitudes which were measured at about the same time that the educational performance was assessed as well as the educational position (i.e. track level) that we analyse. However, our main concern here is in comparing the effects for achievement, attainment and educational choice, more specifically to see whether similar or rather very different mechanisms seem at work for these different components of educational achievement.
References
- Barone, C., G. Assirelli, G. Abbiati, G. Argentin, and D. De Luca. 2018. “Social Origins, Relative Risk Aversion and Track Choice: A Field Experiment on the Role of Information Biases.” Acta Sociologica 61 (4): 441–459. doi:10.1177/0001699317729872.
- Barone, C., K. Barg, and M. Ichou. 2021. “Relative Risk Aversion Models: How Plausible are Their Assumptions?” Rationality and Society 33 (2): 143–175. doi:10.1177/1043463121994087.
- Bartoń, K. (2019). MuMIn: Multi-Model Inference. R package. https://cran.r-project.org/package=mumin.
- Bates, D., M. Maechler, B. Bolker, and S. Walker. 2015. “Fitting Linear Mixed-Effects Models Using lme4.” Journal of Statistical Software 67 (1): 1–48. doi:10.18637/jss.v067.i01.
- Bernardi, F., and G. Cebolla-Boado. 2014. “Previous School Results and Social Background: Compensation and Imperfect Information in Educational Transitions.” European Sociological Review 30 (2): 207–217. doi:10.1093/esr/jct029.
- Blau, P. B., and O. D. Duncan. 1967. The American Occupational Structure. New York: Wiley.
- Boone, S., and M. Van Houtte. 2013. “In Search of the Mechanisms Conducive to Class Differentials in Educational Choice: A Mixed Method Research.” The Sociological Review 61 (3): 549–572. doi:10.1111/1467-954X.12031.
- Boudon, R. 1974. Education, Opportunity, and Social Inequality. Changing Prospects in Western Society. New York: Wiley.
- Bourdieu, P. 1979. La distinction. Critique sociale du jugement. Paris: Editions de Minuit.
- Bourdieu, P. 1986. “The Forms of Capital.” In Handbook of Theory and Research for the Sociology of Education, edited by J. Richardson, 241–258. New York: Greenwood Press.
- Bourdieu, P., and J.-C. Passeron. 1977. Reproduction in Education, Society and Culture. London: Sage.
- Bozick, R., K. Alexander, D. Entwisle, S. Dauber, and K. Kerr. 2010. “Framing the Future: Revisiting the Place of Educational Expectations in Status Attainment.” Social Forces 88 (5): 2027–2052. doi:10.1353/sof.2010.0033.
- Breen, R., and J. H. Goldthorpe. 1997. “Explaining Educational Differentials. Towards a Formal Rational Action Theory.” Rationality and Society 9 (3): 275–305. doi:10.1177/104346397009003002.
- Breen, R., H. G. van de Werfhorst, and M. M. Jæger. 2014. “Deciding under Doubt: A Theory of Risk Aversion, Time Discounting Preferences, and Educational Decision Making.” European Sociological Review 30 (2): 258–270. doi:10.1093/esr/jcu039.
- Buchholz, S., J. Skopek, M. Zielonka, H. Ditton, F. Wohlkinger, and A. Schier. 2016. “Secondary School Differentiation and Inequality of Educational Opportunity in Germany.” In Models of Secondary Education and Social Inequality – An International Comparison, edited by H.-P. Blossfeld, S. Buchholz, J. Skopek, and M. Triventi, 79–93. Cheltenham/Northampton: Edward Elgar Publishing.
- Calarco, J. M. 2014. “The Inconsistent Curriculum: Cultural Tool Kits and Student Interpretations of Ambiguous Expectations.” Social Psychology Quarterly 77 (2): 185–209. doi:10.1177/0190272514521438.
- Chalmers, R. P. 2012. “Mirt: A Multidimensional Item Response Theory Package for the R Environment.” Journal of Statistical Software 48 (6): 1–29. doi:10.18637/jss.v048.i06.
- Chung, H., J. Kim, R. Park, and H. Jean. 2018. “The Impact of Sample Size in Cross-Classified Multiple Membership Multilevel Models.” Journal of Modern Applied Statistical Methods 17 (1). doi:10.22237/jmasm/1542209860.
- Coleman, J. S. 1988. “Social Capital in the Creation of Human Capital.” The American Journal of Sociology 94 (Supplement): 95–120. doi:10.1086/228943.
- Daniel, A., and R. Watermann. 2018. “The Role of Perceived Benefits, Costs, and Probability of Success in Students’ Plans for Higher Education. A quasi-experimental Test of Rational Choice Theory.” European Sociological Review 34 (5): 539–553. doi:10.1093/esr/jcy022.
- De Clercq, M., B. Galand, V. Hospel, and M. Frenay. 2021. “Bridging Contextual and Individual Factors of Academic Achievement: A multi-level Analysis of Diversity in the Transition to Higher Education.” Frontline Learning Research 9 (2): 96–120. doi:10.14786/flr.v9i2.671.
- Dockx, J., B. De Fraine, and M. Vandecandelaere. 2019. “Tracks as Frames of Reference for Academic self-concept.” Journal of School Psychology 72: 67–90. doi:10.1016/j.jsp.2018.12.006.
- Doedens, P., G. Ter Riet, -L.-L. Boyette, C. Latour, L. de Haan, and J. Twisk. 2022. “Cross-classified Multilevel Models Improved Standard Error Estimates of Covariates in Clinical outcomes—A Simulation Study.” Journal of Clinical Epidemiology 145: 39–46. doi:10.1016/j.jclinepi.2022.01.005.
- Emery, L., B. Spruyt, S. Boone, and P. Van Avermaet. 2020. “The Educational Trajectory of Newly Arrived Migrant Students: Insights from a Structural Analysis of Cultural Capital.” Educational Research 62 (1): 18–34. doi:10.1080/00131881.2020.1713021.
- Flemish Ministry of Education and Training. 2022a. Flemish Education in Figures. 2020-2021. Brussels: Department of Education and Training. https://publicaties.vlaanderen.be/view-file/48569
- Flemish Ministry of Education and Training. 2022b. Statistisch Jaarboek van het Vlaams Onderwijs. 2020-2021. Brussels: Department of Education and Training. https://publicaties.vlaanderen.be/view-file/52393
- Forster, A. G., and H. G. van de Werfhorst. 2020. “Navigating Institutions: Parents’ Knowledge of the Educational System and Students’ Success in Education.” European Sociological Review 36 (1): 48–64.
- Gabay-Egozi, L., Y. Shavit, and M. Yaish. 2010. “Curricular Choice: A Test of A Rational Choice Model of Education.” European Sociological Review 26 (4): 447–463. doi:10.1093/esr/jcp031.
- Gregory, A., and F. Huang. 2013. “It Takes a Village: The Effect of 10th Grade College-Going Expectations of Students, Parents, and Teachers Four Years Later.” American Journal of Community Psychology 52 (1–2): 41–55. doi:10.1007/s10464-013-9575-5.
- Haller, A., and A. Portes. 1973. “Status Attainment Processes.” Sociology of Education 46 (1): 51–91. doi:10.2307/2112205.
- Heisig, J. P., B. Elbers, and H. Solga. 2020. “Cross-national Differences in Social Background Effects on Educational Attainment and Achievement: Absolute Vs. Relative Inequalities and the Role of Education Systems.” Compare: A Journal of Comparative and International Education 50 (2): 165–184. doi:10.1080/03057925.2019.1677455.
- Henninges, M., C. Traini, and C. Kleinert (2019). Tracking and Sorting in the German Educational System. LIfBi Working Paper No. 83. Bamberg, Germany: Leibniz Institute for Educational Trajectories.
- Holm, A., A. Hjorth-Trolle, and M. M. Jæger. 2019. “Signals, Educational decision-making, and Inequality.” European Sociological Review 35 (4): 447–460. doi:10.1093/esr/jcz010.
- Holm, A., and M. M. Jæger. 2008. “Does Relative Risk Aversion Explain Educational Inequality? A Dynamic Choice Approach.” Research in Social Stratification and Mobility 26 (3): 199–219. doi:10.1016/j.rssm.2008.05.004.
- Jacob, M., and N. Tieben. 2009. “Social Selectivity of Track Mobility in Secondary Schools.” European Societies 11 (5): 747–773. doi:10.1080/14616690802588066.
- Jæger, M. M. 2009. “Equal Access but Unequal Outcomes: Cultural Capital and Educational Choices in a Meritocratic Society.” Social Forces 87 (4): 1943–1972. doi:10.1353/sof.0.0192.
- Jæger, M. M., and A. Holm. 2012. “Conformists or Rebels? Relative Risk Aversion, Educational Decisions and Social Class Reproduction.” Rationality & Society 24 (2): 221–253. doi:10.1177/1043463112441346.
- Karlson, K. B., A. Holm, and R. Breen. 2012. “Comparing Regression Coefficients between Same-sample Nested Models Using Logit and Probit: A New Method.” Sociological Methodology 42 (1): 286–313. doi:10.1177/0081175012444861.
- Lareau, A. 2015. “Cultural Knowledge and Social Inequality.” American Sociological Review 80 (1): 1–27. doi:10.1177/0003122414565814.
- Lorenz, G., S. Gentrup, C. Kristen, P. Stanat, and I. Kogan. 2016. “Stereotype bei Lehrkräften? Eine Untersuchung systematisch verzerrter Lehrererwartungen.” Kölner Zeitschrift für Soziologie und Sozialpsychologie 68 (1): 89–111. doi:10.1007/s11577-015-0352-3.
- Marsh, H. W. 1992. Self-Description Questionnaire (SDQ) II: Manual. Sydney, Australia: University of Western Sydney.
- Nakagawa, S., and H. Schielzeth. 2013. “A General and Simple Method for Obtaining R2 from Generalized Linear Mixed-effects Models.” Methods in Ecology and Evolution 4: 133–142. doi:10.1111/j.2041-210x.2012.00261.x.
- OECD. 2016. PISA 2015 Results (Volume I): Excellence and Equity in Education. Paris: OECD Publishing.
- Pinxten, M., B. De Fraine, W. Van Den Noortgate, J. Van Damme, and D. Anumendem. 2012. “Educational Choice in Secondary School in Flanders: The Relative Impact of Occupational Interests on Option Choice.” Educational Research and Evaluation 18 (6): 541–569. doi:10.1080/13803611.2012.702991.
- Reay, D. 2004. “Education and Cultural Capital: The Implications of Changing Trends in Education Policies.” Cultural Trends 13 (2): 73–86. doi:10.1080/0954896042000267161.
- Rosenthal, R., and L. Jacobson. 1968. Pygmalion in the Classroom: Teacher Expectation and Pupils’ Intellectual Development. New York: Holt: Rinehart & Winston.
- Seghers, M., S. Boone, and P. Van Avermaet. 2019. “Social Class and Educational Decision-Making in a Choice-Driven Education System: A Mixed-Methods Study.” British Journal of Sociology of Education 40 (5): 696–714. doi:10.1080/01425692.2019.1581051.
- Sewell, W. H., A. O. Haller, and G. W. Ohlendorf. 1970. “The Educational and Early Occupational Status Attainment Process: Replication and Revision.” American Sociological Review 35 (December): 1014–1027. doi:10.2307/2093379.
- Sewell, W. H., and R. M. Hauser. 1975. Education, Occupation, and Earnings: Achievement in the Early Career. New York: Academic.
- Sewell, W. H., R. M. Hauser, and W. C. Wolf. 1980. “Sex, Schooling and Occupational Status.” American Journal of Sociology 86 (November): 551–583. doi:10.1086/227281.
- Sneyers, E., J. Vanhoof, and P. Mahieu. 2018. “Primary Teachers’ Perceptions that Impact upon Track Recommendations regarding Pupils’ Enrolment in Secondary Education: A Path Analysis.” Social Psychology of Education 21 (5): 1153–1173. doi:10.1007/s11218-018-9458-6.
- Spruyt, S., K. De Keere, G. Keppens, L. Roggemans, and F. Van Droogenbroeck. 2016. “What Is It Worth? An Empirical Investigation into Attitudes Towards Education Amongst Youngsters Following Secondary Education in Flanders.” British Journal of Sociology of Education 37 (4): 586–606. doi:10.1080/01425692.2014.960960.
- Stevens, E., J. Dockx, C. Custers, I. Fidlers, B. De Fraine, and J. Van Damme. 2015. LiSO-project: Steekproef September 2013. Leuven: Steunpunt Studie- en Schoolloopbanen (SSL).
- Stocké, V. 2007. “Explaining Educational Decision and Effects of Families’ Social Class Position: An Empirical Test of the Breen-Goldthorpe Model of Educational Attainment.” European Sociological Review 23 (4): 505–519. doi:10.1093/esr/jcm014.
- Timmermans, A. C., H. de Boer, H. T. A. Amsing, and M. P. C. van der Werf. 2018. “Track Recommendation Bias: Gender, Migration Background and SES Bias over a 20-year Period in the Dutch Context.” British Educational Research Journal 44 (5): 847–874. doi:10.1002/berj.3470.
- Tolsma, J., A. Need, and U. de Jong. 2010. “Explaining Participation Differentials in Dutch Higher Education: The Impact of Subjective Success Probabilities on Level Choice and Field Choice.” European Sociological Review 26 (2): 235–252. doi:10.1093/esr/jcp061.
- Turetsky, K. M., S. Sinclair, J. G. Starck, and J. N. Shelton. 2021. “Beyond Students: How Teacher Psychology Shapes Educational Inequality.” Trends in Cognitive Sciences 25 (8): 697–709. doi:10.1016/j.tics.2021.04.006.
- Tutić, A. 2017. “Revisiting the Breen-Goldthorpe Model of Educational Stratification.” Rationality and Society 29 (4): 389–407. doi:10.1177/1043463117734177.
- Van de Gaer, E., H. Pustjens, J. Van Damme, and A. De Munter. 2006. “Tracking and the Effects of School-Related Attitudes on the Language Achievement of Boys and Girls.” British Journal of Sociology of Education 27 (3): 293–309. doi:10.1080/01425690600750478.
- Van den Branden, N., K. Denies, J. Dockx, and B. De Fraine (2018a). LiSO-Project: Toetsen Nederlands Begrijpend Lezen Einde Vierde Leerjaar. Instrumentontwikkeling en Resultaten. Research paper. Gent: Steunpunt Onderwijsonderzoek (SONO).
- Van den Branden, N., J. Dockx, C. Struyve, K. Denies, and B. De Fraine (2018b). LiSO-Project: Toetsen Wiskunde Einde Vierde Leerjaar. Instrumentontwikkeling en Resultaten. Research paper. Gent: Steunpunt Onderwijsonderzoek (SONO).
- Van den Branden, N., C. Struyve, J. Dockx, K. Denies, and B. De Fraine (2018c). LiSO-Project: Vragenlijst voor Leerlingen Mei 2017. Technische Rapportering. Research paper. Gent: Steunpunt Onderwijsonderzoek (SONO).
- Vandenbroeck, M., J. Dockx, N. Van den Branden, E. Stevens, K. Denies, and B. De Fraine. 2017. Constructie van de SES-variabele voor het LiSO-onderzoek. Gent: Steunpunt Onderwijsonderzoek (SONO).
- Van de Werfhorst, H. G., and S. Hofstede. 2007. “Cultural Capital or Relative Risk Aversion? Two Mechanisms for Educational Inequality Compared.” The British Journal of Sociology 58 (3): 391–415. doi:10.1111/j.1468-4446.2007.00157.x.
- Van de Werfhorst, H. G., and J. J. B. Mijs. 2010. “Achievement Inequality and the Institutional Structure of Educational Systems: A Comparative Perspective.” Annual Review of Sociology 36 (1): 407–428. doi:10.1146/annurev.soc.012809.102538.
- Van Houtte, M. 2016. “Lower-track Students’ Sense of Academic Futility: Selection or Effect?” Journal of Sociology 52 (4): 874–889. doi:10.1177/1440783315600802.
- Van Houtte, M., J. Demanet, and P. A. J. Stevens. 2012. “Self-esteem of Academic and Vocational Students: Does Within-School Tracking Sharpen the Difference?” Acta Sociologica 55 (1): 73–89. doi:10.1177/0001699311431595.
- Van Houtte, M., and P. A. J. Stevens. 2015. “Tracking and Sense of Futility: The Impact of Between-School Tracking Versus Within-School Tracking in Secondary Education in Flanders (Belgium).” British Educational Research Journal 41 (5): 782–800. doi:10.1002/berj.3172.
- Van Praag, L., J. Demanet, P. A. J. Stevens, and M. Van Houtte. 2017. “‘Everyone Has Their Own Qualities’: Tracking and Academic Self-Appraisal in Flemish Secondary Education.” Social Psychology of Education 20 (3): 601–618. doi:10.1007/s11218-017-9371-4.
- Wang, S., C. M. Rubie-Davies, and K. Meissel. 2018. “A Systematic Review of the Teacher Expectation Literature over the past 30 Years.” Educational Research and Evaluation 24 (3–5): 124–179. doi:10.1080/13803611.2018.1548798.
- Zimmerman, T. 2020. “Social Influence or Rational Choice? Two Models and Their Contribution to Explaining Class Differentials in Student Educational Aspirations.” European Sociological Review 36 (1): 65–81.