
Abstract
Background
In Australia, the regional prevalence of difficult-to-treat asthma is unknown. We aimed to describe regional variation in difficult-to-treat asthma prevalence and oral corticosteroid (OCS) use.
Methods
In this retrospective, observational, longitudinal study using data from March 2018–February 2019 in the NostraData longitudinal database, prescriptions dispensed for obstructive airway disease were processed through a high-level algorithm to identify patients with asthma. Difficult-to-treat asthma was defined by ≥2 high-dosage inhaled corticosteroids plus long-acting beta-agonist prescriptions over 6 months. Patients who additionally received OCS prescriptions sufficient to treat ≥2 exacerbations over 6 months were classified as having uncontrolled difficult-to-treat asthma. Patient-level data were analyzed across 340 geographic areas in Australia to determine regional prevalence of difficult-to-treat asthma, uncontrolled difficult-to-treat asthma, and OCS use.
Results
Of 1 851 129 people defined as having asthma, 440 800 (24%) were classified as having difficult-to-treat disease. Of those difficult-to-treat asthma patients, 96 338 (22%) were considered to have uncontrolled disease. Between 29% and 48% of patients had difficult-to-treat asthma in 49 geographic areas, most frequently located in Western Australia. Between 26% and 67% of patients had uncontrolled difficult-to-treat asthma in 29 geographic areas (mostly in Eastern Australia). Overall, a wide variability of asthma severity and control was observed among regions.
Conclusions
Despite global and national guidelines, regional differences in the prevalence of difficult-to-treat asthma and uncontrolled difficult-to-treat asthma and OCS use exist in Australia. Understanding these regional variations should inform policy and target management in the areas with the greatest unmet need.
Introduction
Asthma is a common, noncommunicable disease that varies in severity and in ability to maintain control. Patient burden, health care resource utilization, and asthma-related mortality increase with greater asthma severity (Citation1,Citation2) and further increase when asthma is not controlled (Citation3,Citation4). Of the approximately 340 million people worldwide with asthma, it is considered difficult-to-treat in 4–10% of patients (Citation1,Citation3,Citation5,Citation6). The global prevalence of patients with uncontrolled asthma has not been resolved (Citation7).
In Australia, approximately 2.7 million people have asthma (Citation8), and asthma-related mortality rates are among the highest of developed nations (Citation9). Asthma prevalence ranges from 7.4% in the Northern Territory to 13% in South Australia and is higher in nonurban regions (up to 12.9%) versus major cities (10.7%) (Citation10). An estimated 45% of patients in Australia have uncontrolled disease (Citation11); however, difficult-to-treat asthma prevalence is unknown.
Asthma therapy is intended to control symptoms and reduce the risk of exacerbations, and asthma severity can be determined by the treatments required to achieve these goals (Citation12). Appropriate low-dose inhaled corticosteroids (ICS) use, or stepping up to combination therapy with a long-acting beta-agonist (LABA), is effective for most patients (Citation12,Citation13). Short courses of oral corticosteroids (OCS) are prescribed for acute asthma exacerbations or for periods of uncontrolled symptoms, despite high-dose ICS and controller therapies, and indicates a failure to control asthma with regular treatment adequately (Citation12). OCS use should be minimized because of the risk of serious adverse health consequences (Citation14–16). Difficult-to-treat asthma is defined as asthma that is uncontrolled despite the use of medium or high dose ICS with a second controller, or that requires high dose treatment to maintain good symptom control and reduce the risk of exacerbations (Citation12). In this case, asthma may appear difficult-to-treat because of modifiable factors (e.g. incorrect inhaler technique, poor adherence, or comorbidities). The definition of severe asthma is more stringent and is a subset of difficult-to-treat asthma, requiring persistence of uncontrolled disease despite adherence with maximal optimized high dose ICS-LABA treatment and management of contributory factors (Citation12).
A recent survey of ∼2700 Australian asthma patients revealed that 82% who are prescribed ICS receive ICS/LABA combination therapies (Citation17). This high dependence on ICS/LABA is influenced by poor adherence, as only 57% of patients receiving ICS reported taking them as prescribed (Citation17). Another analysis in Australia revealed that of asthma patients who were prescribed ICS-containing preventers, 71% received high-dose ICS/LABA formulations. An estimated 10% of these patients also received potentially harmful doses of OCS within a 12-month period, accompanied by poor adherence to high-dose ICS/LABA in >50% of cases (Citation18). This highlights the association between poor adherence to regular preventer therapy and the need to use OCS.
The PRECISION program is a global initiative to improve treatment for patients with difficult-to-treat asthma, in part, by increasing access and quality of care (Citation19). This initiative includes characterizing regional distributions of patients with difficult-to-treat and/or uncontrolled asthma to identify areas with the greatest need for improved care (Citation20–22). Due to lack of data on the prevalence of severe, uncontrolled asthma, we conducted this retrospective study using nationwide pharmacy data to assess the prevalence and distribution of difficult-to-treat and uncontrolled difficult-to-treat asthma and high dose OCS use to characterize the unmet need in Australia. This study also aimed to assess asthma prevalence in remote and/or rural areas that may have variable asthma outcomes.
Methods
Data source
This observational, retrospective study used pharmacy claims from the NostraData (Kew, Victoria, Australia) longitudinal database to determine rates of asthma, difficult-to-treat asthma, uncontrolled difficult-to-treat asthma, and OCS use in Australia from March 2018–February 2019. NostraData captures deidentified patient information comprising dispensing data from approximately 4500/5500 (81.8%) community pharmacies in Australia. This database captures reimbursed and private prescriptions and represents between 70% and 80% of the Australian Pharmaceutical Benefits Scheme system across all states. Because data were deidentified for this secondary analysis, ethics approval was not required.
Asthma prevalence
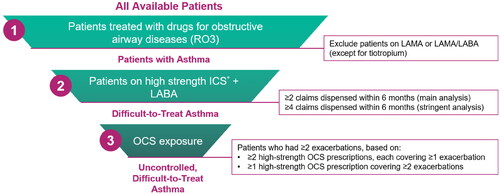
A high-level algorithm () was used to identify patients of any age with asthma based on prescriptions for medications for chronic airway obstruction (Anatomical Therapeutic Chemical Classification System code R03). Nonprescription medications were not considered. Medications prescribed were a surrogate for corroborating data on asthma control that was not available. To exclude patients with chronic obstructive pulmonary disease, the algorithm did not include long-acting muscarinic agonists alone or with concomitant LABA (except for tiotropium). These data did not allow for assessment of asthma symptom control, inhaler technique, comorbidities, or adherence. Difficult-to-treat asthma was defined as patients who received ≥2 high-dosage ICS/LABA prescriptions within a 6-month period during the 1-year assessment (see Supplemental Table S1). Uncontrolled difficult-to-treat asthma was defined based on the above criteria plus prescriptions for high-dosage OCS to cover ≥2 exacerbations over the 6-month period (e.g. 2 prescriptions able to cover 1 exacerbation each, or 1 prescription able to cover 2 exacerbations). The prescribed OCS dose was also analyzed to determine the prevalence of patients with a cumulative exposure of ≥1 g over a 6-month period based on an increased risk of adverse outcomes above that level (Citation15). A second analysis was performed for patients demonstrating a higher level of adherence defined by having ≥4 high-dosage ICS/LABA prescriptions dispensed over 6 months.
Figure 1. High-level algorithmic approach to identifying patients with asthma by severity. ICS, inhaled corticosteroid; LABA, long-acting beta-agonist; LAMA, long-acting muscarinic antagonist; OCS, oral corticosteroid. *A list of high-strength ICS is provided in the Supplemental Materials, Table S1.
Regional analyses
Regional asthma prevalence was determined by matching individual patient data to the patient’s postcode and organizing pharmacy prescription claims data into Statistical Area Level 3 (SA3) geographic areas defined by the Australian Bureau of Statistics (Citation23). Each SA3 has a population between 30 000 and 130 000 people, can contain multiple postcodes, and ranges from small clusters of heavily populated communities in or around urban centers to remote areas. This analysis used 340 SA3s, excluding those defined as special-purpose, nonspatial areas. SA3-level data were used to produce heat maps to display four color-coded prevalence ranges of difficult-to-treat asthma, uncontrolled difficult-to-treat asthma, and/or cumulative OCS use throughout Australia. Only nonzero values are shown, and prevalence ranges for each color code were selected for approximate normal distributions for each map. Patients with missing postcode data (6% of the sample) were excluded from the regional analyses.
Results
Cohort selection
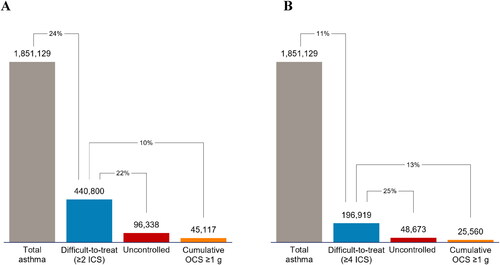
Using the high-level algorithm, we classified 1 851 129 individuals of all ages in Australia as having asthma. A total of 440 800 (24%) patients with asthma were classified as having difficult-to-treat asthma based on the threshold of ≥2 high-dosage ICS/LABA prescriptions; 22% (n = 96 338) were further defined as having uncontrolled disease based on OCS use (). A total of 45 117 (10%) patients with difficult-to-treat asthma were prescribed OCS that met or exceeded a cumulative dosage of 1 g over the 6-month analysis period. In the analysis that defined difficult-to-treat asthma as four high-dosage ICS/LABA prescriptions, 11% (n = 196 919) of patients with asthma were classified as having difficult-to-treat asthma, among whom 25% (n = 48 673) were classified as having uncontrolled disease (). A total of 25 560 (13%) patients with difficult-to-treat asthma had been prescribed OCS that totaled ≥1 g over 6 months.
Figure 2. Prevalence of asthma by severity, control, and OCS use in Australia. Difficult-to-treat asthma was defined by (A) ≥2 ICS, or (B) ≥4 ICS over a 6-month analysis period. ICS, inhaled corticosteroid; OCS, oral corticosteroid.
Geographic mapping of asthma burden
Heat maps showing regional distributions of patients with asthma by severity and OCS use from the main analysis are provided in . Regional distributions based on the main analysis revealed that prevalence of difficult-to-treat asthma ranged from 14-48% across all regions. The highest range of difficult-to-treat asthma prevalence (29–48%) included 49 SA3 regions, which were most frequently in Western Australia (22/36 [61%]); the remaining regions were in Northern Territory (2/9 [22%]), Victoria (14/66 [21%]), Tasmania (2/15 [13%]), and New South Wales (9/95 [9%]) (). The SA3 with the highest prevalence of difficult-to-treat asthma among all asthma patients (48%) was in Western Australia, where the prevalence in the top five SA3 regions was 33-48% (). Although only 9% of SA3s in the highest prevalence category were from New South Wales, the SA3 with the second-highest prevalence of difficult-to-treat asthma (43%) was located there, where the top five SA3s ranged from 31-43%. In the remaining states/territories, difficult-to-treat asthma prevalence in individual SA3s ranged from 14% (New South Wales and Queensland) to 33% (Victoria; ).
Figure 3. Heat maps showing regional distributions of patients with asthma in Australia based on 2 ICS/LABA prescriptions over 6 months. (A) Patients with difficult-to-treat asthma as a percentage of all patients with asthma. (B) Patients with uncontrolled asthma as a percentage of patients with difficult-to-treat asthma. (C) Patients with difficult-to-treat asthma and a cumulative dosage of ≥1 g OCS over 6 months. ICS, inhaled corticosteroid; OCS, oral corticosteroid.
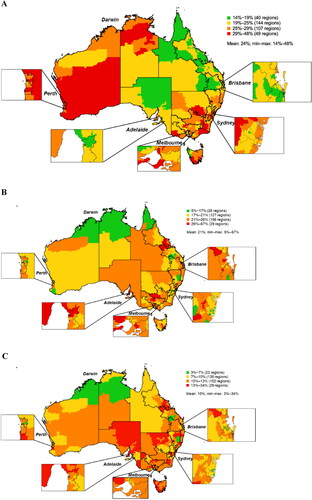
Table 1. Prevalence rates of difficult-to-treat asthma, uncontrolled asthma, and high oral corticosteroid use in the top 5 and bottom 5 SA3 regions by state (main analysis).
For uncontrolled difficult-to-treat asthma, 29 regions were in the highest range (26-67%). The states/territories with the highest proportion of SA3s in this range were South Australia (7/28 [25%]), Tasmania (3/15 [20%]), Victoria (9/66 [14%]), Queensland (5/82 [6%]), and New South Wales (5/95 [5%]) (). Despite only five SA3 regions from New South Wales being in the high prevalence range, one SA3 had the highest prevalence of uncontrolled asthma among difficult-to-treat asthma patients (67%), which was more than double the highest rate in any other SA3 in Australia (). The lowest prevalence of uncontrolled difficult-to-treat asthma by SA3 was 5% in Western Australia.
Between 13% and 34% of patients with difficult-to-treat asthma were prescribed a cumulative dose of ≥1 g OCS over 6 months in 29 SA3s, most of which were in the eastern half of Australia (). New South Wales had the region with the highest rate (34%), which was nearly double the rate in the next-highest SA3 (17%) in Tasmania (). The lowest rate of patients with difficult-to-treat asthma and ≥1 g OCS over 6 months in a unique SA3 was 3% in the Northern Territory ().
Heat maps for the analysis that defined difficult-to-treat asthma as receiving ≥4 high-dosage ICS prescriptions over 6 months are presented in . By this definition, only 6 regions had prevalence rates of 16-19%, which were found primarily in Western Australia and Tasmania (). Within the difficult-to-treat asthma population, the prevalence of uncontrolled asthma ranged from 14-34% overall and ranged from 29-34% in 33 SA3s, mostly located in the eastern half of Australia (). In this cohort, up to 20% of patients had a cumulative OCS dosage of ≥1 g over the 6-month analysis period, which was well distributed throughout most states in Australia (). The prevalence rates for the top five and bottom five SA3s in each state/territory based on this stringent analysis are provided in .
Figure 4. Heat maps showing regional distributions of patients with asthma in Australia based on ≥4 ICS/LABA prescriptions over 6 months. (A) Patients with difficult-to-treat asthma as a percentage of all patients with asthma. (B) Patients with uncontrolled asthma as a percentage of patients with difficult-to-treat asthma. (C) Patients with difficult-to-treat asthma and a cumulative dosage of ≥1 g OCS over 6 months. ICS, inhaled corticosteroid; OCS, oral corticosteroid.
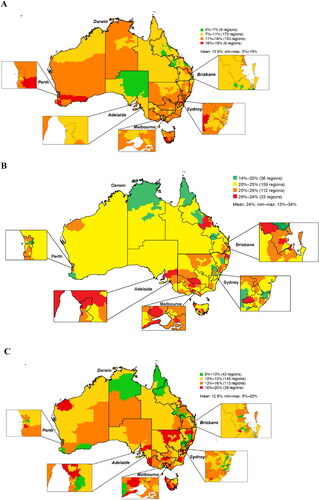
Table 2. Prevalence rates of difficult-to-treat asthma, uncontrolled asthma, and high oral corticosteroid use in the top 5 and bottom 5 SA3 regions by state (stringent analysis).
Discussion
This is the first study to provide overall and regional prevalence estimates of difficult-to-treat asthma in Australia. Using dispensing data from 81.8% of Australian pharmacies, we identified nearly 1.9 million individuals with asthma and, using two different criteria, estimated that 24% or 11% of patients with asthma could have difficult-to-treat disease. These rates exceed global estimates (4–10%) (Citation1,Citation3,Citation5,Citation6) and may truly reflect a high prevalence of difficult-to-treat asthma in Australia as they align with high asthma-related mortality rates in Australia compared with other high-income nations (Citation9). However, by using ICS/LABA prescriptions to define asthma severity, our findings were also likely influenced by especially high usage of ICS/LABA in Australia, which make up >80% of all ICS-containing treatment regimens for asthma (Citation17), the majority of which are dispensed as high-dose formulations (Citation18).
Prior data suggest that asthma prevalence in Australia varies by region, the highest observed in South Australia (13.0%), Tasmania (12.9%), Australian Capital Territory (12.1%), and Queensland (11.9%) (Citation10). Our findings reveal regional differences in difficult-to-treat asthma prevalence, ranging from 14–48% across regions, 5–67% of which is uncontrolled (or 5% and 19% for difficult-to-treat asthma, 14–34% of which is uncontrolled in the stringent analysis). Interestingly, we found difficult-to-treat asthma was most prevalent in Tasmania, Western Australia, and parts of Northern Territory, which have the lowest asthma prevalence per data from the Australian Bureau of Statistics (9.6% and 7.4%, respectively) (Citation10). Although the definitions for difficult-to-treat and uncontrolled asthma were likely applied equally throughout Australia due to prescription regulations, further investigation will be required to better understand the reasons for these regional variations. Additional studies may provide information on how regional variations are affected by access to healthcare, socioeconomic status, variable climates, and the impact of living in urban vs. rural areas.
OCS use is associated with adverse effects and increased risk with lifetime cumulative exposures as small as 0.5 g (Citation15,Citation24). According to our primary and more stringent analyses, 22% and 25% respectively of patients with difficult-to-treat asthma are uncontrolled, and 10% and 13% respectively were prescribed ≥1 g OCS during the analysis period. This is consistent with previous findings that revealed ∼10% of patients taking high-dose ICS/LABA received ≥1 g OCS within a calendar year (Citation18). Similar rates of high OCS exposure between patients defined as having difficult-to-treat asthma by both criteria in our study suggest less than optimal asthma control in patients with milder disease. This is also consistent with prospective study results demonstrating poor symptom control and the need for urgent consultations for asthma in ≥ 20% of cases associated with poor adherence to preventer medication (Citation17). Our geographic results extend previous findings by identifying hot spots of uncontrolled difficult-to-treat asthma, which should inform clinicians and health care policymakers about where to optimize asthma education to patients and health providers and ensure adequate access to health services and affordable medications, especially ICS. They may also reveal areas of heightened risk to environmental exposures leading to uncontrolled asthma, which should be explored in further detail.
Strengths and limitations
A strength of this study was the large, geographically representative sample of patients receiving prescriptions for asthma medications, providing data on asthma severity and control throughout Australia. The database included private prescription information and a large patient sample based on ∼4500 pharmacies covering the entire country, allowing for informative regional data throughout Australia, to identify areas of unmet need for improvements in asthma management.
A limitation of the study was that patients with asthma were identified only by prescription data; therefore, all patients who were prescribed asthma medications defined in our algorithm were captured, which could have included patients who were prescribed medications for other respiratory conditions, or some who were misdiagnosed. Conversely, patients with asthma who were not prescribed treatment regimens defined by the algorithm would have been missed. We also could not confirm that the medications prescribed were used, which is of concern in a population with high rates of poor medication adherence (Citation17,Citation18) and could mean the OCS burden was underestimated as a single dispensed OCS prescription of 30 tablets that could be used multiple times in short burst therapy. In addition, patients who initiated OCS use within hospitals as opposed to community practice may not have been captured in this study. The 1.85 million asthma patients identified from a sample of 82% of Australian pharmacies projects to ∼2.3 million for the full population, which is similar to the 2.7 million self-reported asthma patients reported by the Australian Bureau of Statistics (Citation8,Citation25), supporting the validity of our technique. As we were not able to directly assess asthma control, assess adherence and technique for inhaler use, and allow comparison to global prevalence, we applied the definition used by GINA as difficult to treat asthma to describe this patient population most accurately (Citation12). Future studies could use patient-level diagnostic data to validate prescription-based algorithms more precisely or assess biologic use, which may provide more information about disease severity among patients with difficult-to-treat or uncontrolled asthma. Other limitations were that the geographic data were based on SA3s, which are heterogeneous in size, geography, environment, and population, and not created and/or optimized for research. Data was not adjusted for age or sex distribution as that information was not available.
Conclusion
We identified important regional differences in difficult-to-treat asthma prevalence, including uncontrolled disease and OCS use in Australia. These findings provide an understanding for healthcare providers, patient advocates, and policymakers of the regions where patients are in the greatest need of improved asthma care and are exposed to high levels of OCS as a consequence of poor asthma control. The reasons for these findings will need to be examined in each area and are likely to reveal contributing sociodemographic or environmental factors. Clinical implications may also be identified, such as a need for targeted patient and practitioner education, access to primary care medical services, and better access to asthma specialist referral.
Author contributions
All authors contributed equally to the conceptualization, data analysis, and development of this manuscript.
Supplemental materials
Additional supporting information may be found online in the Supplemental Materials section.
AUS_Heat_Map_Analysis_Manuscript_Supplemental_Information.docx
Download MS Word (28.9 KB)Acknowledgements
Medical writing support was provided by Jamie King, PhD, and Nate Connors, PhD, ISMPP CMPP of CiTRUS Health Group, which was in accordance with Good Publication Practice (GPP3) guidelines and funded by AstraZeneca.
Disclosure statement
This study was sponsored by AstraZeneca. Peter Wark has received speaker fees and fees for serving on advisory boards for AstraZeneca. Mark Hew has received grants-in-aid, speaker fees, and fees for serving on advisory boards for GlaxoSmithKline, AstraZeneca, Novartis, Teva, Sanofi, and Seqirus, all paid to his institutional employer, Alfred Health. Yang Xu and Clare Ghisla are employees of AstraZeneca. Cassandra Nan is an employee of AstraZeneca and a shareholder of GlaxoSmithKline and AstraZeneca. Tra-My Nguyen, Bora Erdemli, and Aditya Samant are employees of ZS Associates, whose work was funded by AstraZeneca.
Data availability statement
Data underlying the findings described in this manuscript may be requested in accordance with AstraZeneca’s data-sharing policy described at https://astrazenecagrouptrials.pharmacm.com/ST/Submission/Disclosure.
References
- Chung KF, Wenzel SE, Brozek JL, Bush A, Castro M, Sterk PJ, Adcock IM, Bateman ED, Bel EH, Bleecker ER, et al. International ERS/ATS guidelines on definition, evaluation and treatment of severe asthma. Eur Respir J. 2014;43(2):343–373. doi:10.1183/09031936.00202013.
- GBD 2016 Disease and Injury Incidence and Prevalence Collaborators. Global, regional, and national incidence, prevalence, and years lived with disability for 328 diseases and injuries for 195 countries, 1990-2016: a systematic analysis for the Global Burden of Disease Study 2016. Lancet. 2017;390(10100):1211–1259.
- Chastek B, Korrer S, Nagar SP, Albers F, Yancey S, Ortega H, Forshag M, Dalal AA. Economic burden of illness among patients with severe asthma in a managed care setting. JMCP. 2016;22(7):848–861. doi:10.18553/jmcp.2016.22.7.848.
- Zeiger RS, Schatz M, Dalal AA, Qian L, Chen W, Ngor EW, Suruki RY, Kawatkar AA. Utilization and costs of severe uncontrolled asthma in a managed-care setting. J Allergy Clin Immunol Pract. 2016;4(1):120–129 e3. doi:10.1016/j.jaip.2015.08.003.
- Hankin CS, Bronstone A, Wang Z, Small MB, Buck P. Estimated prevalence and economic burden of severe, uncontrolled asthma in the United States. J Allergy Clin Immunol. 2013;131(2):AB126. doi:10.1016/j.jaci.2012.12.1118.
- Hekking P-PW, Wener RR, Amelink M, Zwinderman AH, Bouvy ML, Bel EH. The prevalence of severe refractory asthma. J Allergy Clin Immunol. 2015;135(4):896–902. doi:10.1016/j.jaci.2014.08.042.
- Chen S, Golam S, Myers J, Bly C, Smolen H, Xu X. Systematic literature review of the clinical, humanistic, and economic burden associated with asthma uncontrolled by GINA Steps 4 or 5 treatment. Curr Med Res Opin. 2018;34(12):2075–2088. doi:10.1080/03007995.2018.1505352.
- Australian Bureau of Statistics. 4364.0.55.001 - National Health Survey: First Results, 2017-18: Chronic Conditions. Canberra: Australian Bureau of Statistics; 2018 [cited 2020 28 October]. Available from: https://www.abs.gov.au/ausstats/[email protected]/mf/4364.0.55.001.
- Global Asthma Network. The Global Asthma Report 2018 Auckland. New Zealand: Global Asthma Network; 2018. [cited 2020 14 August]. Available from: http://www.globalasthmareport.org/resources/global_asthma_report_2018.pdf.
- Australian Bureau of Statistics. 4364.0.55.001 - National Health Survey: First Results, 2017-18: Data downloads: Table 2.3. Canberra: Australian Bureau of Statistics; 2018 [cited 2020 28 October]. Available from: https://www.abs.gov.au/statistics/health/health-conditions-and-risks/national-health-survey-first-results/latest-release#data-download.
- Reddel HK, Sawyer SM, Everett PW, Flood PV, Peters MJ. Asthma control in Australia: a cross-sectional web-based survey in a nationally representative population. Med J Aust. 2015;202(9):492–497. doi:10.5694/mja14.01564.
- Global Initiative for Asthma (GINA). Global strategy for asthma management and prevention (2021 update) 2021 [cited 2021 May]. Available from: https://ginasthma.org/wp-content/uploads/2021/04/GINA-2021-Main-Report_FINAL_21_04_28-WMS.pdf.
- National Asthma Education Prevention Program Expert Panel Report 3 (EPR-3): guidelines for the diagnosis and management of asthma-summary report 2007. J Allergy Clin Immunol. 2007;120(5 Suppl):S94.
- Bleecker ER, Menzies-Gow AN, Price DB, Bourdin A, Sweet S, Martin AL, Alacqua M, Tran TN. Systematic Literature Review of Systemic Corticosteroid Use for Asthma Management. Am J Respir Crit Care Med. 2020;201(3):276–293. doi:10.1164/rccm.201904-0903SO.
- Price DB, Trudo F, Voorham J, Xu X, Kerkhof M, Ling Zhi Jie J, Tran TN. Adverse outcomes from initiation of systemic corticosteroids for asthma: long-term observational study. JAA. 2018;11:193–204. doi:10.2147/JAA.S176026.
- Volmer T, Effenberger T, Trautner C, Buhl R. Consequences of long-term oral corticosteroid therapy and its side-effects in severe asthma in adults: a focused review of the impact data in the literature. Eur Respir J. 2018;52(4):1800703. doi:10.1183/13993003.00703-2018.
- Reddel HK, Beckert L, Moran A, Ingham T, Ampon RD, Peters MJ, Sawyer SM. Is higher population-level use of ICS/LABA combination associated with better asthma outcomes? Cross-sectional surveys of nationally representative populations in New Zealand and Australia. Respirology. 2017;22(8):1570–1578. doi:10.1111/resp.13123.
- Hew M, McDonald VM, Bardin PG, Chung LP, Farah CS, Barnard A, Cooper MS, Gibson PG, Upham JW. Cumulative dispensing of high oral corticosteroid doses for treating asthma in Australia. Med J Aust. 2020;213(7):316–320. doi:10.5694/mja2.50758.
- Haughney J, Winders TA, Holmes S, Chanez P, Saul H, Menzies-Gow A, PRECISION Improve Access to Better Care Task Force. Global Quality Standard for Identification and Management of Severe Asthma. Adv Ther. 2020;37(9):3645–3659. doi:10.1007/s12325-020-01450-7.
- Chapman KR, Remtulla A, Gendron A, Xu S, Nan C. Regional variation in asthma prevalence and oral corticosteroid use for Canadian patients: heat map analysis. Am J Respir Crit Care Med. 2020;201:A1835–A1835. doi:10.1164/ajrccm-conference.2020.201.1_MeetingAbstracts.A1835.
- Menzies-Gow A, Haslam T, Morris T, et al. P144 Regional variation in OCS use for UK patients with asthma: heat map analysis. Thorax. 2019;74(Suppl 2):A169–A169.
- Tran TN, King E, Sarkar R, Nan C, Rubino A, O’Leary C, Muzwidzwa R, Belton L, Quint JK. Oral corticosteroid prescription patterns for asthma in France, Germany, Italy and the UK. Eur Respir J. 2020;55(6):1902363. doi:10.1183/13993003.02363-2019.
- Australian Bureau of Statistics. 1270.0.55.001 - Australian Statistical Geography Standard (ASGS): Volume 1 - Main Structure and Greater Capital City Statistical Areas, July 2016 Canberra: Australian Bureau of Statistics; 2016 [cited 2020 14 August]. Available from: https://www.abs.gov.au/ausstats/[email protected]/Lookup/by%20Subject/1270.0.55.001∼July%202016∼Main%20Features∼Statistical%20Area%20Level%203%20(SA3)∼10015.
- Bloechliger M, Reinau D, Spoendlin J, Chang S-C, Kuhlbusch K, Heaney LG, Jick SS, Meier CR. Adverse events profile of oral corticosteroids among asthma patients in the UK: cohort study with a nested case-control analysis. Respir Res. 2018;19(1):75. doi:10.1186/s12931-018-0742-y.
- Australian Institute of Health and Welfare. Asthma Canberra: Australian Institute of Health and Welfare; 2019 [cited 2020 14 August]. Available from: https://www.aihw.gov.au/reports/chronic-respiratory-conditions/asthma.