Abstract
The generalized Kirchhoff's law predicts that the polarization state of thermal emission from an individual small particle depends on the particle shape. We show for the first time experimental evidence confirming this prediction for particles smaller than the wavelength by using a newly developed laser-induced incandescence instrument and a theoretical model that can predict the signals of thermal emission and light scattering for an ellipsoid under the dipole approximation (Rayleigh ellipsoid). We use single-sphere (singlet) and two-sphere clusters (doublet) of polystyrene latex spheres as primary test particles. These are currently available, well-characterized spherical and nonspherical particles, respectively. The polarization states of thermal emission and scattered light of graphite particles smaller than the wavelength show a good agreement with model calculations for plate-like Rayleigh-spheroids, consistent with their plate-like shapes observed by a transmission electron microscope. We propose that the measurement of the polarization state of thermal emission may be applicable to real-time analysis of the shape of light-absorbing particles in air.
1. INTRODUCTION
Aerosol particles in atmosphere are highly variable in morphology depending on the chemical composition, formation processes, and relative humidity. Solid-state aerosols, e.g., mineral dust, soot, and dried inorganic salts, are generally nonspherical, whereas liquid-state aerosols, e.g., cloud droplets, are spherical. Interpretation of radiometric remote sensing data and calculations of climate effects of atmospheric aerosols require an accurate aerosol optical model relating the aerosol microphysics (i.e., size distribution, chemical composition, and mixing state) and the optical properties (i.e., extinction coefficient per unit concentration, scattering phase function, and single scattering albedo). Most current aerosol optical models assume a spherical shape for individual particles because of a lack of sufficient knowledge of the spatial and temporal variations of particle shapes in the atmosphere. CitationDubovik et al. (2002) demonstrated quantitative improvements in the ground-based remote sensing of atmospheric aerosols by taking into account nonspherical particle shapes. CitationAdachi et al. (2010) showed the importance of taking into account the actual complex shapes of soot particles for quantitative calculations of their optical properties in atmosphere. Therefore, observations of particle shapes in various times and locations in atmosphere are important for physically based improvements in aerosol optical models.
Real-time measurement of the particle shape in air has long been one of the frontier subjects in aerosol technology. The light-scattering technique has long been the only method to investigate the shape of individual suspended particles in real-time and nonsampling way (CitationSachweh et al. 1999; CitationSassen 2000; CitationAptowicz et al. 2006; CitationBogan et al. 2010). Particle shape analyses solely based on this technique can be associated with large uncertainty for atmospheric aerosols without a priori knowledge of chemical composition, because the analyses of light-scattering data often require assumptions regarding the refractive index. Therefore, a new technique for particle shape analysis sensitive to the chemical composition of individual particles is desired for atmospheric measurements.
The inelastic scattering phenomena induced by laser, i.e., Raman scattering, plasma emission, fluorescent emission, and thermal emission, are possible candidates for the principles of new technique. Theoretically, the measured signals of Raman scattering, plasma emission, and fluorescent emission from an arbitrary particle depend on many chemical and physical parameters: chemical structure of molecules, interactions between adjacent molecules, internal locations of excited molecules, internal distribution of refractive index, and particle shape. In addition, they also depend on the parameters of laser for excitation: intensity, wavelength, and incident direction (CitationBoutou et al. 2002;CitationGriaznov et al. 2002; CitationWeigel et al. 2006). In contrast, the measured signals of thermal emission depend solely on two physical parameters: thermodynamic temperature and emission cross section (= absorption cross section) of the particle (CitationRytov 1953; CitationBekefi 1966; CitationMoteki et al. 2009), independent of any parameters of laser to heat the particle. Therefore, both theoretical and experimental methods for thermal emission are less complicated than those of other phenomena mentioned earlier.
According to the generalized Kirchhoff's law (CitationRytov 1953), the emission cross section of thermal radiation of an arbitrary body at a given wavelength, polarization, and direction is rigorously equivalent to the absorption cross section for incident radiation of the same wavelength and polarization state, but propagating in the opposite direction. The absorption cross section of an arbitrary particle for each polarization and direction is uniquely determined by its microphysical properties (i.e., refractive index, volume, shape, and orientation). Therefore, the validity of the generalized Kirchhoff's law assures predictable relationships between the microphysical properties of the particle and the directional intensity distribution of thermal emission in each polarization state. CitationMoteki et al. (2009) showed experimental results on the directional dependence of thermal emission from various nonspherical carbon particles that can be interpreted on the basis of the generalized Kirchhoff's law.
The purpose of this study is to provide experimental evidence regarding the generalized Kirchhoff's law including polarization, especially for particles smaller than the wavelength. A demonstration of the experimental evidence ensures that the polarization-resolved measurement of thermal emission will be a new technique for analyzing the shape of individual light-absorbing particles. This new technique based on thermal emission can be used simultaneously with the light-scattering technique. Section 2 presents the instrumental design and basic principles. Section 3 presents a theoretical model for simulating signals measured by the instrument using microphysical properties and the orientation of individual particles as input parameters. Section 4 describes experimental methods. Finally, Section 5 is devoted to the presentation of the experimental results and their interpretation.
2. INSTRUMENTAL DESIGN
shows a schematic diagram of the instrument developed to measure the directionalities and polarizations of thermal emission and light scattering by individual aerosol particles. The principle of single-particle detection is based on the experimental system of CitationStephens et al. (2003), which enables simultaneous detection of the intensities of thermal emission and light scattering by individual particles. This system has been commercialized as the single-particle soot photometer (SP2: Droplet Measurement Technologies, Inc., Boulder, CO, USA), an instrument for single-particle measurement of soot aerosols in atmosphere. The principles of the SP2 have been described in detail in previous publications (CitationSchwarz et al. 2006; CitationGao et al. 2007; CitationMoteki and Kondo 2007, 2010; and references therein). The new concepts of the instrument used in this study are as follows: (1) polarization-resolved measurements of both thermal emission and light scattering, and (2) the intracavity laser is linearly polarized by using a Nd:YVO4 crystal instead of a Nd:YAG crystal as in previous studies.
FIG. 1 Schematic diagram of the instrument designed to measure the polarization and directionality of thermal emission and scattering by individual particles in airflow. Aerosol flow intersects with the laser beam at right angles. The actual direction of the inlet aerosol jet nozzle is perpendicular to the page. Other elements of the instrument, including the nozzle outlet, laser crystal, cavity mirrors, flow control system, and data acquisition system, are not shown.
2.1 Laser Cavity
The intracavity Nd:YVO4 laser is pumped by an 808-nm wavelength laser diode (Model JOLD-7.8-BAFC-11, JENOPTIK, Jena, Germany) and resonating at 1064-nm wavelength. The laser beam transmitted through one of the cavity mirrors (reflectivity > 99.99%) is monitored to analyze the beam profile, polarization state, and stability of the laser power. After an optimal alignment of the laser cavity, the transverse mode of the laser beam during operation was TEM00 for which the cross-sectional power profile can be approximated by a Gaussian function with ∼1 mm diameter (i.e., 1/e2 power) as confirmed by a charge-coupled device (CCD) beam profiler. The polarization state of the intracavity laser was measured by using a polarization analyzer PAX 5720-IR2 (Thorlabs GmbH, Dachau, Germany). The polarization state of the intracavity laser operating in TEM00 mode was a linear polarization of purity greater than 99% with an electric field perpendicular to the plane containing the optical axis of the light collection optics (i.e., parallel to the direction of aerosol flow). The birefringence character of Nd:YVO4 (CitationKoechner 2006) likely caused the stable resonation of the laser light at a linear polarization with a specific direction.
2.2 Detection of Light from Individual Particles
Sample air containing aerosol particles (i.e., aerosol flow) is introduced to the particle detection chamber through a nozzle inlet (). The nozzle inlet narrows the diameter of the sample flow down to ∼0.2 mm by a concentric sheath flow. The optical detection volume is a zone overlapping with the 0.2 mm diameter aerosol flow and with the ∼1 mm diameter laser beam. The optical systems were designed to transmit the light emitted from an area within ±1.2 mm vertical and ±1.2 mm horizontal distances from the center of the detection volume into the active area of the individual photodetectors without spatial variation of the light transmission efficiency. Four 28 mm diameter objective lenses are mounted at distances of 25 mm from the center of the detection volume and the numerical aperture of each objective lens is approximately 0.5.
Two independent but equivalent optics for light scattering are mounted in mutually orthogonal directions, namely, directions 1 and 2 (). For each direction, a laser line filter transmitting 1064 ± 20 nm (DIF-BP-3, Optical Coating Japan, Tokyo, Japan) is mounted to cut the stray light of the pumping laser and the majority of the thermal emission from the particle. The filtered light is split into mutually orthogonal linear polarization components by a polarization beam splitter (49872-K, Edmund Optics Japan, Tokyo, Japan). Finally, each polarization component is measured by a Si-avalanche photodiode (S8890-30, Hamamatsu photonics, Hamamatsu, Japan).
Strongly light-absorbing particles with boiling points higher than ∼103 K (e.g., graphite, soot, and metals) emit a detectable amount of thermal radiation at visible wavelengths by laser-induced incandescence within the optical detection volume. Two independent but equivalent optics for thermal emission are mounted in mutually orthogonal directions, again directions 1 and 2 (). The spectral transmissivity of the long-pass filters (L-42, HOYA, Tokyo, Japan) mounted in each direction and the spectral sensitivity of the photodetectors (photomultiplier tube H6779, Hamamatsu photonics, Hamamatsu, Japan) limit the range of the detection wavelength of thermal emission to within 420–550 nm. A broadband polarization beam splitter working over the 420–680 nm range (49002-K, Edmund Optics Japan, Tokyo, Japan) splits the light of thermal emission into mutually orthogonal polarization components, and the power of each polarization component is measured by the photomultiplier tube. The extinction ratios of the mutually orthogonal polarization components of the polarization beam splitters are better than 500:1 according to the manufacturer's catalogue.
2.3 Definition of Coordinates
We developed a theoretical model for calculating the signals measured by the instrument using the microphysical properties of particles (i.e., refractive index, volume, shape, and orientation) as input parameters. The model requires coordinate systems under which we can specify the particle orientations and propagating directions of the incident and emitted light. First, we define a Cartesian coordinate system (i.e., xyz system) fixed in the laboratory (). The origin O of the coordinate system is the center of the detection volume. The intracavity laser beam propagates in the +z and −z directions along the z-axis with its electric field polarized along the x-axis. Sample air containing aerosol particles flows in the −x direction along the x-axis. The y−z plane contains the optical axes of the four objective lenses for measuring thermal emission and light scattering. The positive y domain includes the two objective lenses for thermal emission, whereas the negative y domain contains those for light scattering. Directions 1 and 2 of thermal emission and light scattering correspond to the negative and positive z domains, respectively.
FIG. 2 The Cartesian and polar coordinate systems defined for the development of a theoretical model. The origin of coordinate system O is the center of the detection volume. The intracavity laser beam and nozzle inlet are parallel to the z- and x-axes, respectively. The laser beam propagates in the +z and −z directions. The y–z plane includes the optical axes of the four objective lenses.
We also define a polar coordinate system (rθφ system) centered at point O (). Here, ![]() is the unit vector along the line OP defining the direction of observation; θ is the angle between the +z direction and line OP, and φ is the angle between the +x direction and line OQ, the projection of line OP onto the x−y plane. For incident light propagating in the +z direction, θ and φ are the scattering and azimuth angles, respectively. The scattering plane is defined as the plane that includes triangle OPQ. The unit vectors
is the unit vector along the line OP defining the direction of observation; θ is the angle between the +z direction and line OP, and φ is the angle between the +x direction and line OQ, the projection of line OP onto the x−y plane. For incident light propagating in the +z direction, θ and φ are the scattering and azimuth angles, respectively. The scattering plane is defined as the plane that includes triangle OPQ. The unit vectors ![]() and
and ![]() indicate the directions of increasing angles θ and φ, respectively. For each direction of light collection, the polarization beam splitter splits the light into the polarization components of the electric fields along
indicate the directions of increasing angles θ and φ, respectively. For each direction of light collection, the polarization beam splitter splits the light into the polarization components of the electric fields along ![]() and
and ![]() , called the θ- and φ-polarization components, respectively.
, called the θ- and φ-polarization components, respectively.
2.4 Observed Signals
We indicate the signals measured by the instrument as S TE−[1,2][θ,φ] and S SC−[1,2][θ,φ], where the subscripts TE and SC means thermal emission and light scattering, respectively, and the subscript [1,2] is the selective symbol for direction and the subscript [θ,φ] is that for the polarization components. On the basis of the generalized Kirchhoff's law, the signal of thermal emission is proportional to the solid angle integration of the absorption cross section Cabs of the corresponding direction and polarization as
2.5 Nondimensional Parameters
For the physical interpretation of signals S TE−[1,2][θ,φ] and S SC−[1,2][θ,φ], we use nondimensional parameters (NDPs) constructed from the signal ratios. The use of NDPs avoids calibration of the absolute intensities. In this study, we define six NDPs: S1CP, S2CP, SDR, T1CP, T2CP, and TDR as summarized in . In SDR and TDR, the total intensity in each direction means summing the signals of the θ- and φ-polarization components. The logarithm (base 10) was taken to evaluate the signal ratios on a linear scale.
Table 1 Definitions of the NDPs used for data analysis
3 THEORY
Although numerical techniques for accurate calculations of scattering and absorption by nonspherical particles have been advanced (CitationKahnert 2003), simple closed-form solutions for arbitrary refractive index, volume, shape, and three-dimensional orientations of particles are available only for an ellipsoid under the dipole approximation (i.e., Rayleigh approximation). We call this theoretical particle the Rayleigh ellipsoid and use it for model calculations. In this section, we present a theoretical model to calculate the signals of EquationEquations (1) and Equation(2) for a Rayleigh ellipsoid by using the refractive index, shape, and orientation as input parameters.
3.1 Dipole Moment and Polarizability of a Rayleigh Ellipsoid
We consider a Rayleigh ellipsoid with semiradii of the major axes 1, 2, and 3 equal to a, b, and c, respectively. In the default orientation, the major axes 1, 2, and 3 are along the x-, y-, and z-axes, respectively. The dipole moment ![]() of the ellipsoid under a static electric field
of the ellipsoid under a static electric field ![]() is
is
3.2 Thermal Emission
In this section, we derive explicit expressions for the absorption cross sections C abs−[1,2][θ,φ] in Equation Equation(1) for a Rayleigh ellipsoid. The absorption cross sections of an electric dipole for θ- and φ-polarized incident waves are expressed as follows (CitationBohren and Huffman 1983):
The components of the electric field in EquationEquations (15) and Equation(16) are real numbers under the framework of the electrostatic approximation. Therefore, EquationEquations (15) and Equation(16) reduce to
Calculations of EquationEquations (17) and Equation(18) require the values of θ and φ in the matrix R specifying the direction. For example, calculations of C abs−1[θ,φ] use the numerical values of θ and φ corresponding to the direction 1 of thermal emission. The signals of thermal emission S TE−[1,2][θ,φ] (Equation Equation(1)) are calculated by the integration of C abs−[1,2][θ,φ] over the ranges of θ and φ within the solid angle of light collection.
3.3 Light Scattering
Calculations of scattering signals (Equation Equation(2)) require explicit expressions of the differential scattering cross section for the θ- and φ-polarization components of the scattered wave for x-polarized incident waves. We have to take into account the contributions of incident waves propagating in the +z and −z directions for the calculations of the scattering signals because the intracavity laser is a standing wave. For this calculation, we derive formulations of (1) the differential scattering cross sections of the θ- and φ-polarization components for an x-polarized incident wave propagating in the +z direction, and (2) the elements of the amplitude-scattering matrix, and (3) the transformation rules between the formulations for incident waves propagating in the +z and −z directions.
3.3.1 Differential Scattering Cross Section
In this section, we derive the differential scattering cross sections of the θ- and φ-polarization components for an x-polarized incident wave propagating in the +z direction. First, we decompose the incident and scattered waves into mutually orthogonal electric field components parallel (∥) and perpendicular (⊥) to the scattering plane as
For an arbitrary particle, the relationship between the components of the incident wave (Ei ||, Ei ⊥) and the scattered wave (Es ||, Es ⊥) is expressed by an amplitude-scattering matrix as
Substituting Equations (24) and (25) into Equation Equation(23), we have a relation between the scattered field components in polar coordinates and the incident field components in Cartesian coordinates as
To calculate the differential scattering cross sections of the θ- and φ-polarization components, we need the squares of the amplitudes of the θ- and φ-polarization components of the scattered wave. From Equation (26), we have
The differential scattering cross sections for the θ- and φ-polarization components of the scattered wave are defined as
For the application of Equations (30) and (31) to our instrument, we can assume that the electric field of the incident wave is x polarized and Ei y =0 in Equation Equation(29). Substituting Equations (27) and (29) into Equation Equation(30) under the assumption of Ei y = 0, we have
Similarly, substituting Equations (28) and (29) into Equation Equation(31) under the assumption of Ei y = 0, we have
Equations (32) and (33) are the general formulae of the differential scattering cross sections for the θ- and φ-polarization components of the scattered wave for an x-polarized incident wave.
3.3.2 Amplitude-Scattering Matrix
In this subsection, we derive the elements of the amplitude-scattering matrix Sj (j = 1, 2, 3, 4) for a Rayleigh ellipsoid. The general expression for the amplitude of a scattered wave in the far-field zone (kr >> 1) is
Using Equation Equation(35), the vector products in Equation Equation(34) become
We expand the components of the dipole moment in Equations (38) and (39) by using the amplitude of the incident wave and the polarizability tensor in Cartesian coordinates as
Substituting Equations (41) and (42) into (38) and (39), we have
By comparing Equations (43) and (44) with the matrix equation (Equation Equation(23)), we can find the elements of the amplitude-scattering matrix as
By using these Sj (j = 1, 2, 3, 4), we can calculate Equations (32) and (33), the differential scattering cross sections of the θ- and φ-polarization components of scattered waves for an x-polarized incident wave propagating in the +z direction.
3.3.3 Transformation Rules Between Counter-Propagating Incident Waves
Because the intracavity laser is a standing wave, we have to take into account the contributions of incident waves propagating in the +z and −z directions to the scattering signals. The procedure given in the previous sections calculates the contribution of the incident wave propagating in the +z direction. The contribution of the incident wave propagating in the −z direction is calculated by the same procedures except for using the modified coordinate systems x′y′z′ and r′θ′φ′ instead of the original coordinate systems xyz and rθφ. The transformation relation between the x′y′z′ and xyz coordinate systems is
The transformation relation between the r′θ′φ′ and rθφ coordinate systems is
By using the transformation matrix M defined in Equation Equation(50) and the polarizability tensor of the Rayleigh ellipsoid in the x′y′z′-coordinate system, ![]() is calculated from
is calculated from ![]() (Equation Equation(6)) as
(Equation Equation(6)) as
The calculation of the light-scattering signal S SC−[1,2][θ,φ] (Equation Equation(2)) requires a summation of the contributions of the incident waves propagating in the +z and −z directions to the scattered waves, and an integration of the differential scattering cross sections over the ranges of θ and φ within the solid angle of light collection.
3.4 Model Calculations
We calculated the NDPs () for Rayleigh ellipsoids by using the refractive indexes, shapes, and orientations as input parameters based on the formulations in Sections 2–3. Because of the limitation of numbers of pages and figures, details of the model calculations are shown in online supplemental information (SI). Importantly, the NDPs calculated for Rayleigh ellipsoids are sensitive to the shape and orientation of particles. The SI shows the detailed relationships between particle orientations and NDPs for needle-like and plate-like Rayleigh spheroids. In Section 5, we refer to the calculation results in SI for interpretations of the experimental results.
4 EXPERIMENTAL METHODS
4.1 Operation of the Instrument
Our experiments were conducted at a pressure of 1000 ± 10 hPa and temperature of 300 ± 2 K. The pressure inside the instrument chamber was approximately 30 hPa less than the ambient pressure because of the pressure drop through the narrow tube of the nozzle inlet. At the nozzle inlet, sample air with 1.7 cm3 s−1 volume flow rate is sheathed by clean dried air with 18 cm3 s−1 volume flow rate. The velocity of the sheathed sample flow is approximately 50 m s−1, and individual particles take ∼40 μs to pass through the optical detection volume. Optical signals from eight photodetectors (four thermal emission and four scattering) are simultaneously digitized to 12-bit resolution at a rate of 5 MHz (i.e., every 0.2 μs).
4.2 Test Particles
4.2.1 Polystyrene Latex Particles
We need particles with standard spherical and nonspherical shapes to test the functioning of the instrument and validate the theoretical model. For this purpose, we used single-sphere (singlets) and two-sphere clusters (doublets) of polystyrene latex (PSL). We generated aerosols from a concentrated aqueous solution of the PSL sample with a single-sphere diameter of 294 ± 9 nm (STADEX, JSR Corp., Tokyo, Japan) by using an ultrasonic nebulizer (U-5000AT, CETAC, NE, USA). The number distribution of the PSL aerosols as a function of particle mass was measured by an aerosol particle mass analyzer (APM model-302, KANOMAX, Osaka, Japan; CitationEhara et al. 1996) and a condensation particle counter (CPC model-3022A, TSI, Inc., MN, USA). This measurement demonstrated the presence of a significant number of 29.2 fg two-sphere clusters (doublets) associated with 14.6 fg single-sphere clusters (singlets). Singlet and doublet PSL particles in the sample flow were discriminated by the APM before measurement.
4.2.2 Graphite and Soot Particles
We used graphite and soot particles because their vaporization temperatures are high enough to emit detectable intensities of thermal emission in the visible band upon laser-induced incandescence (CitationMoteki and Kondo 2010). summarizes brief descriptions of these samples. Aquadag and colloidal graphite are plate-like fragments of crystalline graphite (CitationMoteki and Kondo 2007, 2010; CitationMoteki et al. 2009). Palas soot is a fractal-like aggregate generated by spark discharges between two graphite electrodes (GFG-1000 aerosols generator, Palas, GmbH, Germany). CitationHelsper et al. (1993) describes the principles of the GFG-1000 aerosol generator. Palas soot is an aggregate of many 5–10 nm primary spherules with nanocrystalline structure similar to that of diesel soot (CitationWentzel et al. 2003). Aqua-Black (Aqua-Black 162, Tokai Carbon, Tokyo, Japan) is a commercial soot sample dispersed in water. Aqua-Black is an aggregate of primary spherules of ∼20 nm diameter (CitationMoteki et al. 2009). Aquadag, colloidal graphite, and Aqua-Black samples were aerosolized from their water suspensions by using a pneumatic nebulizer. The nebulized aerosols were dried through a diffusion dryer with silica gel. For each sample, we selected particle masses to be 14.6 fg by using the APM before measurement.
Table 2 Properties of the carbon particles used in the experiments
As an indicator of the compactness of the particle shape, we use the effective density ρeff (CitationMcMurry et al. 2002) defined by the measured mass M and mobility diameter dmob as
5 RESULTS AND DISCUSSION
5.1 Waveforms
shows the examples of the waveforms of scattering signals for (a) singlets and (b) doublets of PSL particles. The waveforms look like Gaussian functions because of the Gaussian profile of the cross-sectional intensity distribution of the laser beam in TEM00 mode. For convenience of the analog-to-digital conversion of signals, we enlarged the signal gains of the θ-polarization components approximately 10 times compared to those of the φ-polarization components. This artificial modification of the signal gains was corrected before data analysis by the NDPs in the following sections. For PSL doublet particles, the particle orientation affects the directionalities and polarizations of the scattered light, and the signal ratios can differ from the case of PSL singlet particles as shown in . Observations of the waveforms of a number of different PSL doublet particles reveal that the signal ratios were relatively stable during the period of each particle's passage through the detection volume (∼40 μs), but varied notably between different particles. These facts indicate that the typical frequency of particle rotation during passage through the detection volume is much less than the frequency of data acquisition (every 0.2 μs). Therefore, we can safely conclude that signals acquired every 0.2 μs contain information about the particle orientation without degradation by smoothing.
FIG. 3 Typical waveforms of the scattering signals for 294 nm PSL particles: (a) single spheres (singlets) classified by the APM at 14.6 fg and (b) two-sphere clusters (doublets) classified by the APM at 29.2 fg.
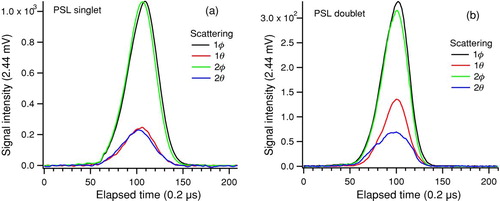
FIG. 4 Typical waveforms of the Aqua-Black and Aquadag particles classified by the APM at 14.6 fg: (a) scattering signals of Aqua-Black, (b) scattering signals of Aquadag, (c) thermal emission signals of Aqua-Black, and (d) thermal emission signals of Aquadag. The waveforms of identical particles are shown for the scattering and thermal emission signals and their horizontal axes are common.
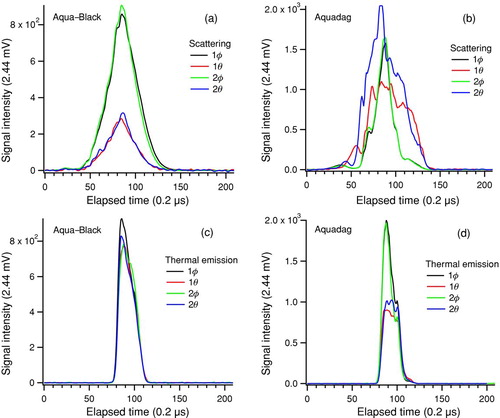
shows the examples of signal waveforms for Aqua-Black ((a) and (c)) and Aquadag ((b) and (c)). The Aqua-Black particles show smooth waveforms for which the signal ratios were stable during the ∼40 μs period, with relatively small variations among different particles. In contrast, the Aquadag particles show jagged waveforms for which the signal ratios significantly changed during the ∼40 μs period, with large variations among different particles. These general features of the waveforms indicate that the optical properties of Aqua-Black particles are weakly dependent on the particle orientation, whereas those of Aquadag particles are strongly dependent on the particle orientation.
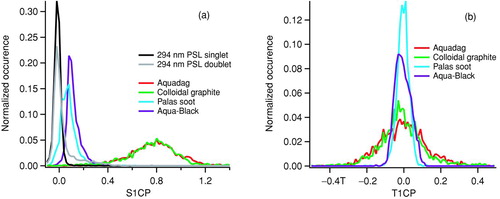
FIG. 5 Occurrence distributions of (a) S1CP and (b) T1CP for approximately 5000 measured particles in each sample. For spherical particles, S1CP and T1CP are equal to zero by definition.
For each particle, the NDPs can be defined every 0.2 μs during the ∼40 μs period within the detection volume. For the analysis of each measured particle from the waveform data, first, we chose a single timing within the waveform data of 0.2-μs time resolution. We can ignore any possible effects of particle rotation on the data obtained for the moment of 0.2 μs, because particle orientation does not change significantly during a 0.2-μs period. This specific timing was chosen based on the following criteria. For particles without thermal emission (e.g., PSLs), we selected the timing of the peak total power detected by the four scattering detectors. For particles with thermal emission (graphite and soot particles), we selected the timing of the peak total power detected by the four thermal emission detectors. For each measured particle, we defined the NDPs in from signals at the timing. For the convenience of presentation, we modified the values of S1CP and S2CP by adding constants so that they would be equal to zero for spherical particles. This artificial modification of the NDPs does not affect the physical interpretation of the results.
FIG. 6 Measured correlations among S1CP, S2CP, and SDR for doublet particles of 294 nm PSL. Filled circles indicate the measured data for individual particles. The number of measured particles is approximately 5000. Filled squares indicate the model calculations for Rayleigh spheroids with q = 0.1 (needle-like), which are also shown in Figure S4.
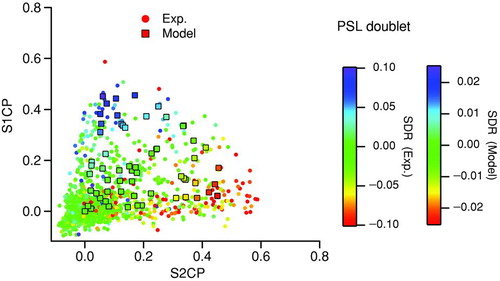
FIG. 7 Measured correlations among (a) S1CP, S2CP, and SDR; (b) S1CP, T1CP, and T2CP; and (c) S2CP, T2CP, and T1CP for Aquadag particles with 14.6 fg mass. Filled circles indicate the measured data for individual particles. The number of measured particles is approximately 5000. Filled squares indicate the model calculations for Rayleigh spheroids with q = 10 (plate-like), which are also shown in Figure S7.
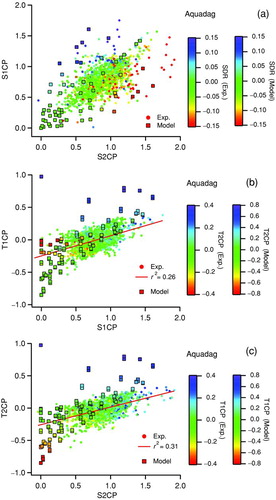
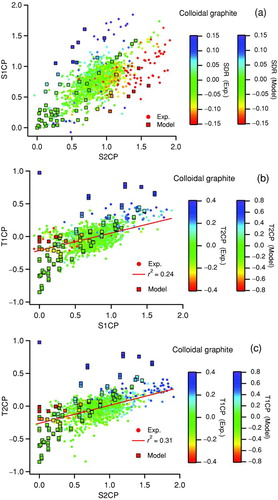
FIG. 8 Measured correlations among (a) S1CP, S2CP, and SDR; (b) S1CP, T1CP, and T2CP; and (c) S2CP, T2CP, and T1CP for colloidal graphite particles with 14.6 fg mass. Filled circles indicate the measured data for individual particles. The number of measured particles is approximately 5000. Filled squares indicate the model calculations for Rayleigh spheroids with q = 10 (plate-like), which are also shown in Figure S7.
5.2 Measured Distribution of NDPs
shows the occurrence distributions of (a) S1CP and (b) T1CP for approximately 5000 measured particles in each sample. The occurrence of S1CP for PSL singlet particles shows a sharp distribution peaked at zero, whereas that for PSL doublet particles also peaks at zero but is distributed up to approximately 0.4. The high S1CP values for graphite and soot particles clearly indicate their nonsphericity. It should be noted that the S1CP distributions for graphite and soot particles have no peak around zero in contrast to the case of PSL doublets. SI including figures (Figures S1–S7) shows the calculation results of NDPs for needle-like and plate-like Rayleigh spheroids. As shown in SI, the calculated S1CP values of Rayleigh spheroids always approach zero when the symmetry axis of the spheroid is close to being parallel to the x-axis (Figures S2 and S3), and the simulated occurrence distribution of S1CP values for Rayleigh spheroids over 6912 orientations also shows a peak at S1CP = 0. It is likely that the peak at S1CP = 0, common to PSL doublets and Rayleigh spheroids, is due to the complete axial symmetry of their particle shape, whereas the lack of a peak at S1CP = 0 for graphite and soot particles is due to their irregular shapes lacking the complete axial symmetry. The S1CP values of Aquadag and colloidal graphite particles are distributed over a wide range and peak around ∼0.8. The model calculations for Rayleigh spheroids with mr = 3.20 + 2.02i show that nonsphericities with aspect ratios q ∼ 0.1 (needle-like) or q ∼ 10 (plate-like) can cause high S1CP values up to ∼1.5 (Figure S7a). This mr value is equal to the refractive index of graphite at 1-μm wavelength (CitationBorghesi and Guizzetti 1991).
The T1CP distribution in also shows the remarkable difference between graphite (Aquadag and colloidal graphite) and soot (Palas soot and Aqua-Black) particles. According to the generalized Kirchhoff's law, any deviations of T1CP from zero are due to the difference in absorption cross sections between the θ- and φ-polarization components. Graphite particles are plate-like fragments of micron-scale crystals in which free electrons can move all over the particle volume. Therefore, it is expected that at least the qualitative feature of polarization of thermal emission from graphite particles can be interpretable by the model of absorbing Rayleigh spheroids. Model calculation shows that Rayleigh spheroids with the refractive index of graphite (mr = 3.20 + 2.02i) and a realistic range of aspect ratios 1 < q < 10 can reproduce the range of the T1CP distribution observed for graphite particles (Figure S7b). The T1CP distribution for soot particles () shows their weak polarization of thermal emission compared with the graphite particles. Interactions of light with highly branched aggregates consisting of small spheres in the Rayleigh limit can be well approximated by a theory that neglects the electromagnetic interactions between primary spherules, namely, the so-called Rayleigh-Debye-Gans (RDG) theory (CitationSorensen 2001). For aggregates of spheres, the RDG theory predicts no polarization dependence of the absorption
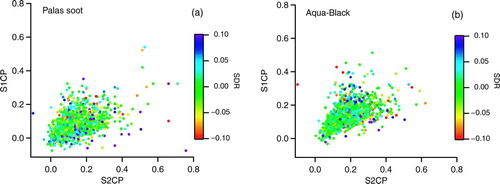
FIG. 9 Measured correlations among S1CP, S2CP, and SDR for (a) Palas soot and (b) Aqua-Black. The number of measured particles is approximately 5000 for each sample.
5.3 Correlations Between Multiple NDPs
5.3.1 PSL Doublet Particles
shows the correlations among S1CP, S2CP, and SDR measured for PSL doublet particles. The model calculations for a Rayleigh spheroid with q = 0.1 (needle-like) for 6912 orientations are also shown. The measured data clearly show the feature that large SDR values are associated with large S1CP and small SDR values are associated with large S2CP. This systematic feature is reproduced by the model calculations for a needle-like Rayleigh spheroid and is caused by the axial symmetry of the particle by which the minima or maxima of the S1CP, S2CP, and SDR values are coincident at specific particle orientations. SI shows the relationships between orientations and NDPs for Rayleigh spheroids.
5.3.2 Graphite
and show the correlations of the measured NDPs for Aquadag and colloidal graphite particles, respectively. The model calculations for a Rayleigh spheroid with q = 10 (plate-like) and mr = 3.20 + 2.02i are also shown. The results for Aquadag and colloidal graphite are similar and the interpretation of their data is the same. The correlations between S1CP and S2CP colored by SDR show a good qualitative agreement with the model calculations for a plate-like Rayleigh spheroid ( and ), consistent with the plate-like shapes of Aquadag and colloidal graphite particles as indicated by their transmission electron microscopy (TEM) images. The correlations between T1CP and S1CP colored by T2CP are also well reproduced by the model calculations for plate-like Rayleigh spheroids ( and ). A good qualitative agreement is also found for the correlations between T2CP and S2CP colored by T1CP ( and ). The positive linear correlations between the measured T1CP and S1CP (T2CP and S2CP) cannot be reproduced by the model calculations for needle-like Rayleigh spheroids as demonstrated in Figure S7b. The good agreement between the measurements for plate-like graphite particles and the model calculations for plate-like Rayleigh spheroids demonstrates the predictability of the polarization state of thermal emission from small particles by the generalized Kirchhoff's law.
5.3.3 Soot
As shown in , thermal emission from soot particles shows little polarization, at least for 14.6 fg particle mass. shows the measured correlations among S1CP, S2CP, and SDR for (a) Palas soot and (b) Aqua-Black. The correlations do not show the features reproduced by the model calculations for Rayleigh spheroids in contrast to the PSL doublet and graphite particles, consistent with their random shapes with no axial symmetry.
6 CONCLUSIONS
We developed a laser-induced incandescence instrument to measure the polarizations and directionalities of thermal emission and light scattering by individual particles in airflow, utilizing the technique of intracavity laser-induced incandescence. A theoretical model to calculate the instrumental response for an ellipsoid under the dipole approximation (Rayleigh ellipsoid) has been developed to interpret the experimental data. Light-scattering signals for PSL doublet particles can be characterized by axial symmetric, nonspherical patterns, consistent with their actual shape. The polarizations and directionalities of thermal emission from plate-like graphite particles smaller than the wavelength were successfully explained by the model calculations for light-absorbing Rayleigh spheroids with plate-like shapes under the assumption of the generalized Kirchhoff's law. This result provides the first evidence that the polarization of thermal emission from small particles can be predicted by the generalized Kirchhoff's law. This study also proposes that the measurements of the polarization of thermal emission from individual particles can be used as a novel method for real-time measurements of the shape of light-absorbing particles in air.
uast_a_583299_sup_18837854.zip
Download Zip (909.4 KB)Acknowledgments
We acknowledge technical support by GENESIA Corp. and KISO Designing Ltd. This work was supported by the JST SENTAN Program; the Ministry of Education, Culture, Sports, Science, and Technology (MEXT); and the global environment research fund of the Japanese Ministry of the Environment (B-083).
Supplementary materials are available for this article. Go to the publisher's online edition of Aerosol Science and Technology to view the free supplementary files.
REFERENCES
- Adachi , K. , Chung , S. H. and Buseck , P. R. 2010 . Shapes of Soot Aerosol Particles and Implications for Their Effects on Climate . J. Geophys. Res. , 115 : D15206 doi:10.1029/2009JD012868
- Aptowicz , K. B. , Pinnick , R. G. , Hill , S. C. , Pan , Y. L. and Chang , R. K. 2006 . Optical Scattering Patterns from Single Urban Aerosol Particles at Adelphi, Maryland, USA: A Classification Relating to Particle Morphologies . J. Geophys. Res. , 111 : D12212 doi:10.1029/2005JD006774
- Arfken , G. and Weber , H. 2005 . Mathematical Methods for Physicists , 6th ed. , NY , , USA : Elsevier Academic Press .
- Bekefi , G. 1966 . Radiation Processes in Plasmas , New York : John Wiley & Sons .
- Bogan , M. , Boutet , S. , Chapman , H. , Marchesini , S. , Barty , A. , Benner , H. , Rohner , U. , Frank , M. , Hau-Riege , S. , Sasa Bajt , S. , Woods , B. , Seibert , M. , Iwan , B. , Timneanu , N. , Hajdu , J. and Schulz , J. 2010 . Aerosol Imaging with a Soft X-Ray Free Electron Laser . Aerosol Sci. Technol. , 44 ( 3 ) : i – vi .
- Bohren , C. F. and Huffman , D. R. 1983 . Absorption and Scattering of Light by Small Particles , New York : John-Wiley & Sons .
- Borghesi , A. and Guizzetti , G. 1991 . “ Graphite (C) ” . In Handbook of Optical Constants of Solids II , Edited by: Palik , E. D. 449 – 460 . New York : Academic Press .
- Boutou , V. , Favre , C. , Hill , S. C. , Pan , Y. L. , Chang , R. K. and Wolf , J. P. 2002 . Backward Enhanced Emission from Multiphoton Processes in Aerosols . Appl. Phys. B , 75 : 145 – 152 .
- Dubovik , O. , Holben , B. N. , Lapyonok , T. , Sinyuk , A. , Mishchenko , M. I. , Yang , P. and Slutsker , I. 2002 . Non-Spherical Aerosol Retrieval Method Employing Light Scattering by Spheroids . Geophys. Res. Lett. , 29 : 1 – 4 . doi:10.1029/2001GL01450654.
- Ehara , K. , Hagwood , C. and Coakley , K. J. 1996 . Novel Method to Classify Aerosol Particles According to Their Mass-to-Charge Ratio—Aerosol Particle Mass Analyzer . J. Aerosol Sci. , 27 : 217 – 234 .
- Gao , R. S. , Schwarz , J. P. , Kelly , K. K. , Fahey , D. W. , Watts , L. A. , Thompson , T. L. , Spackman , J. R. , Slowik , J. G. , Cross , E. S. , Han , J. H. , Davidovits , P. , Onasch , T. B. and Worsnop , D. R. 2007 . A Novel Method for Estimating Light-Scattering Properties of Soot Aerosols Using a Modified Single-Particle Soot Photometer . Aerosol Sci. Technol. , 41 : 125 – 135 .
- Griaznov , V. , Veselovskii , I. , Kolgotin , A. and Whiteman , D. N. 2002 . Angle- and Size-Dependent Characteristics of Incoherent Raman and Fluorescent Scattering by Microspheres. 1. General Expressions . Appl. Optic , 41 : 5773 – 5782 .
- Helsper , C. , Mölter , W. , Löffler , F. , Wadenpohl , C. and Kaufmann , S. 1993 . Investigations of a New Aerosol Generator for the Production of Carbon Aggregate Particles . Atmos. Environ. , 27A : 1271 – 1275 .
- Kahnert , F. M. 2003 . Numerical Methods in Electromagnetic Scattering Theory . J. Quant. Spectrosc. Radiat. Transf. , : 79 – 80 . 775 – 824 .
- Koechner , W. 2006 . Solid-State Laser Engineering, Sixth Revised and Updated Edition , New York : Springer Science + Business Media .
- McMurry , P. H. , Wang , X. , Park , K. and Ehara , K. 2002 . The Relationship Between Mass-To-Mobility of Atmospheric Particles: A New Technique for Measuring Particle Density . Aerosol Sci. Technol. , 36 : 227 – 238 .
- Moteki , N. and Kondo , Y. 2007 . Effects of Mixing State on Black Carbon Measurements by Laser-Induced Incandescence . Aerosol Sci. Technol. , 41 : 398 – 417 .
- Moteki , N. , Kondo , Y. , Takegawa , N. and Nakamura , S. 2009 . Directional Dependence of Thermal Emission from Nonspherical Carbon Particles . J. Aerosol Sci. , 40 : 790 – 801 .
- Moteki , N. , Kondo , Y. and Nakamura , S. 2010 . Method to Measure Refractive Indices of Small Nonspherical Particles: Application to Black Carbon Particles . J. Aerosol Sci. , 41 : 513 – 521 .
- Moteki , N. and Kondo , Y. 2010 . Dependence of Laser-Induced Incandescence on Physical Properties of Black Carbon Aerosols: Measurements and Theoretical Interpretation . Aerosol Sci. Technol. , 44 : 663 – 675 .
- Rytov , S. 1953 . “ The Theory of Electrical Fluctuations and Thermal Radiation (English Translation by US Air Force Cambridge Research Center, Bedford, MA, Rep. AFCRC-TR-59-162) ” . Moscow : USSR Academy of Science .
- Sachweh , B. , Barthel , H. , Polke , R. , Umhauer , H. and Büttner , H. 1999 . Particle Shape and Structure Analysis from the Spatial Intensity Pattern of Scattered Light Using Different Measuring Devices . J. Aerosol Sci. , 30 : 1257 – 1270 .
- Sassen , K. 2000 . “ Lidar Backscatter Depolarization Technique for Cloud and Aerosol Research ” . In Light Scattering by Nonspherical Particles , Edited by: Mischenko , M. I. , Hovenier , J. W. and Travis , L. D. 393 – 416 . New York : Academic Press .
- Schwarz , J. P. , Gao , R. S. , Fahey , D. W. , Thomson , D. S. , Watts , L. A. , Wilson , J. C. , Reeves , J. M. , Darbeshti , M. , Baumgardner , D. G. , Kok , G. L. , Chung , S. H. , Schulz , M. , Hendricks , J. , Lauer , A. , Kärcher , B. , Slowik , J. G. , Rosenlof , K. H. , Thompson , T. L. , Langford , A. O. , Lowenstein , M. and Aikin , K. C. 2006 . Single-Particle Measurement of Mid Latitude Black Carbon and Light-Scattering Aerosols from the Boundary Layer to the Lower Stratosphere . J. Geophys. Res. , 111 : D16207 doi:10.1029/2006JD007076
- Sorensen , C. M. 2001 . Light Scattering by Fractal Aggregates: A Review . Aerosol Sci. Technol. , 35 : 648 – 687 .
- Stephens , M. , Turner , N. and Sandberg , J. 2003 . Particle Identification by Laser-Induced Incandescence in a Solid-State Laser Cavity . Appl. Optic , 42 : 3726 – 3736 .
- van de Hulst , H. C. 1981 . Light Scattering by Small Particles , NY : Dover Publications .
- Weigel , T. , Shulte , J. and Schweiger , G. 2006 . Inelastic Scattering by Particles of Arbitrary Shape . J. Opt. Soc. Am. A , 23 : 2797 – 2802 .
- Wentzel , M. , Gorzawski , H. , Naumann , K.-H. , Saathoff , H. and Weinbruch , S. 2003 . Transmission Electron Microscopical and Aerosol Dynamical Characterization of Soot Aerosols . J. Aerosol Sci. , 34 : 1347 – 1370 .