
ABSTRACT
Despite the popularity of the pMDI as an asthma remedy, the mechanism leading to spray generation is elusive, mainly due to small length scales and short time scale, causing experimental difficulties to obtain flow information. This mechanism involves transient development of two-phase flashing propellant flow inside pMDI actuator as well as transfer of heat, mass, and momentum between the liquid and vapor phase. Variations in the rate of such interphase phenomena dictate the two-phase mass flow rate emission, which itself determines spray velocity and droplet size. In this work, we compare the performance of existing two-phase flow models to predict the flow conditions and the rate of propellant flow through a pMDI actuator: the homogenous equilibrium model (HEM), the slip equilibrium model (SEM), and the homogenous frozen model (HFM). The velocity prediction of the HFM was found to be in good agreement with phase Doppler anemometry (PDA) data indicating the metastable nature of the emitted propellant spray. This work also considers Clark's correlation for the aerosol droplet size based on the results of the flow model. The results of the correlation were compared with PDA droplet size measurements. Clark's correlation was found to be effective in predictions of the temporal droplet size variations. However, the value of an empirical constant had to be tuned to fix the droplet size for a given combination of formulation, device, and to a lesser extent also the distance from the spray orifice where predictions are compared with PDA data. This highlights the need to develop first principle atomization models without the need for case-by-case adjustment.
© 2017 American Association for Aerosol Research
EDITOR:
1. Introduction
Pressurized metered dose inhalers (pMDI) are known as the most efficient and widely used aerosol delivery devices in the world to treat asthma (Dolovich and Fink Citation2001). Portability, light weight, pocket size in combination with device robustness, ease of operation, and high dose numbers are the most notable characteristics that make pMDIs an attractive choice from the patients' perspective. The pMDI produces a therapeutic aerosol consisting of large numbers of droplets within the respirable size range (below 5 µm), but, despite having been on the market for more than half a century, the droplet generation processes of the device are still poorly understood (Finlay Citation2001; Versteeg et al. Citation2006; Gavtash et al. Citation2014).
The thermo-fluid dynamics of two-phase flashing propellant inside the twin-orifice system of the pMDI plays a significant role in determining aerosol characteristics such as droplet size and spray velocity. The phenomenological flow model of Fletcher (Citation1975) and Clark (Citation1991), as well as the implementations by Dunbar and Miller (Citation1997) and Ju et al. (Citation2010), have greatly contributed toward the understanding of propellant flow in pMDI twin-orifice systems. The original work of Fletcher and Clark was developed based on two main assumptions: (i) thermodynamic equilibrium in the metering and expansion chambers, and (ii) homogenous frozen flow through the valve and spray orifices. Fletcher (Citation1975) developed mathematical representations of steady, two-phase propellant flow through twin-orifice systems for continuous discharge. The model was constructed to predict mass flow rate through valve and spray orifices as a function of thermodynamic properties of upstream flow in the chambers and geometric device parameters. These predictions allowed for subsonic and choked discharge conditions. Results showed that the prediction of exit velocity under choked discharge conditions agreed more closely with experimental data, compared with predictions under subcritical conditions. Subsequently, Fletcher's theoretical model was further developed by Clark (Citation1991) for metered discharge and compared with experiments on pMDIs. Although the outcome of the models was in reasonable general agreement with experimental results, a number of problems remained unsolved. First, the measured expansion chamber temperature was higher than the saturation temperature corresponding to the measured expansion chamber pressure suggesting that metastability of the propellant played a part. Second, the velocity of the plume outside the spray orifice was underestimated (Clark Citation1991, p. 181).
Clark conjectured that the dominant atomization mechanism of the pMDI was due to aerodynamic forces similar to air-blast atomization. He proposed that the propellant is pre-atomized into liquid ligaments during its passage from the metering chamber to the expansion chamber. Next, two-phase propellant mixture enters the spray orifice in the form of liquid ligaments and rapidly expanding propellant vapor. The vapor flow squeezes and shears off liquid ligaments from which smaller liquid segments are generated. These exit the spray orifice as small spherical droplets. In air-blast atomization, the pressure droplet across the atomizer and the gas/liquid ratio are the most significant controlling factors governing the droplet size. Clark (Citation1991) applied this approach to ligament disintegration in pMDIs. He correlated measured droplet size data with the peak expansion chamber pressure and the corresponding vapor quality
from his theoretical model to obtain the following empirical correlation for the mass median aerodynamic diameter (MMAD in μm):
[1] where
is ambient pressure. Clark reported a good fit with measured data, but different values of the constant
were required for continuous and metered discharge:
= 8.02 μm and 1.82 μm, respectively. The best fit of data for metered atomization also needed an additive constant (Clark Citation1991, p. 208), but this was not considered in the work of Clark (Citation1991).
Attention is drawn to the fact that it is possible to measure the peak pressure , but the vapor quality
in the expansion chamber cannot be measured directly, so Equation (Equation1
[1] ) must be solved using values of these parameters generated by a theoretical model of propellant flow. Accurate models of the two-phase flow are, therefore, essential for the prediction of droplet size with Equation (Equation1
[1] ). The models by Fletcher and Clark assumed homogenous flow conditions in the spray and valve orifices, so vapor and liquid move at the same speed. Dunbar and Miller (Citation1997), on the other hand, assumed that only the vapor phase chokes and the liquid phase was treated as incompressible, which technically was the first implementation of a separated flow model (i.e., a model where vapor and liquid velocities are not equal). This assumption resulted in large spray velocity of order of 200 m/s, which did not match with their PDA measurements. Dunbar and Miller (Citation1997) also examined a wide range of droplet size correlations with good track record in the field of industrial atomization, but found that Clark's correlation was the most useful. When it was applied in conjunction with their internal flow model to generate instantaneous droplet size in metered discharge, it was necessary to set
= 8.02 in Equation (Equation1
[1] ), in contrast to Clark, who recommended
= 1.82 for metered spray events. Dunbar and Miller's separated flow model was recently extended by Ju et al. (Citation2010) to include the effect of ethanol as co-solvent in propellant. This work also used
= 8.02 to predict the size of the spray droplets.
Although the phenomenological model has a good track record, the above assessment of past work suggests the following issues require more detailed study: (i) the most useful combination of thermodynamic and fluid dynamic assumptions for satisfactory prediction of the mass flow rate and spray velocity, (ii) the most appropriate choice for metered pMDI discharge events of the constant in Clark's correlation. The aim of this work is to assess the applicability of different numerical models of the propellant flow inside a pMDI actuator with focus on mass flow rate through and fluid conditions in the spray orifice. It should be noted that considerable differences in the predicted flow rate and pressure ratios from various 1-D models of flashing propellant flows have been identified previously (Huff Citation1985). Thus, the task at hand is to compare the performance of alternative 1-D models of flashing propellant flow in pMDI applications. Predicted near-orifice spray velocity will be validated against PDA measurement for different propellant systems and actuator geometric properties. Additionally, we investigate the most appropriate choice of constant
in Clark's correlation for the prediction of instantaneous droplet size during metered pMDI discharge by comparing model results with the temporal PDA measurements of droplet size.
2. Materials and methods
2.1. Conceptual model of flow in pMDIs
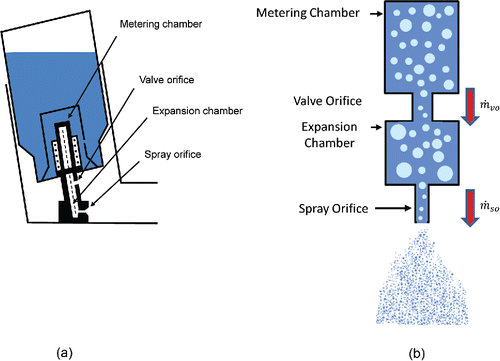
Fletcher (Citation1975) and Clark (Citation1991) give a clear conceptual image that forms the basis of models of propellant flow in twin-orifice systems. shows a cross-section diagram of pMDI, which consists of a canister and actuator. The schematic representation as a twin-orifice system in consists of metering chamber, valve orifice, expansion chamber (volume of valve stem plus actuator sump), and spray orifice.
Figure 1. Schematics of pMDI system. (a) Realistic representation of pMDI. (b) Conceptual diagram of twin-orifice system.
2.2. General modeling assumptions
Thermodynamic effects are responsible for the flow in this conceptual model. Following Fletcher (Citation1975) and Clark (Citation1991), the modeling assumptions are listed as below:
One-dimensional flow: only variations of the propellant flow in the flow direction are considered.
Quasi-steady flow: the flow discharge process through the actuator is assumed to be quasi-steady.
Adiabatic flow: due to the rapid nature of the metered discharge, the residence time of the propellant flow in the spray orifice is too short (order of 10–20 µs) for significant heat transfer to take place between the actuator walls and the propellant.
Fluid energy budget: variations in propellant temperature and kinetic energy are due to evaporation and expansion caused by local pressure differences. Any contribution due to surface energy is neglected.
Gravity: The effect of gravitational force on the propellant flow is neglected in the calculations. Consequently, the orientation of the valve orifice and spray orifice is unimportant.
Zero velocity inside supply reservoir (chambers): for a typical metering valve geometric parameters, preliminary calculations based on continuity of mass suggest that the velocity inside chambers is approximately 2% of the velocity inside orifices and hence negligible. Moreover, the velocity of the fluid in expansion chamber is vertically downward; the momentum and energy of this flow stream will be substantially destroyed in turbulence at the bottom of the sump before the fluid collects and flows into the spray orifice. Presence of velocity inside the chambers results in static pressure reduction. In this case, less driving force becomes available to push the flow out of the spray orifice. Therefore, the velocity inside the spray orifice should be marginally lower.
Frictionless flow: the two-phase flow undergoes isentropic expansion inside orifices.
The fraction of drug in the propellant is very low (typically less than 1% w/w). The model only considers propellant expansion and propellant vapor–liquid interactions.
The model assumes that the two-phase fluid inside the metering and expansion chambers is fully mixed vapor and liquid with negligible velocity. The phases are uniformly distributed and at thermodynamic and thermal equilibrium. As the propellant flows through the orifices, the fraction of liquid reduces inside the metering chamber and initially increases in the expansion chamber and later the liquid fraction reduces again as the propellant runs out. Propellant evaporates and vapor fills the voidage inside the chambers.
Three extreme scenarios of two-phase flow interphase phenomena through orifices are considered, namely, (i) Homogenous Frozen Model (HFM), (ii) Homogenous Equilibrium Model (HEM), and (iii) Slip Equilibrium Model (SEM). These models are schematically shown in .
Figure 2. Schematic of two-phase flow models through nozzle. (a) HFM; (b) HEM; (c) SEM.
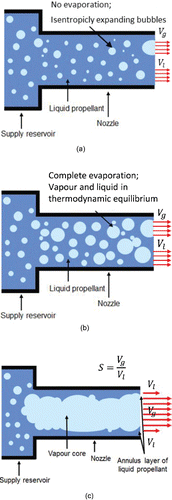
In the HFM and HEM models, the vapor phase and liquid phase are assumed to act as interpenetrating continua and phases travel with the same velocity. In the HFM model, the flow travels from the reservoir to the nozzle exit without mass transfer: no evaporation takes place and hence the mass of vapor is constant during passage of the two-phase mixture through each orifice. The HEM model, on the other hand, assumes that liquid evaporates to reach thermodynamic equilibrium as the fluid expands through an orifice.
The conceptual image associated with the SEM model involves an annular liquid film along the walls of the nozzle surrounding a vapor core. Similar to HEM, the vapor is assumed to be at thermodynamic equilibrium at the nozzle exit. However, the SEM model is a separated flow model; hence, the phases are traveling with different velocities characterized by the velocity slip ratio , where
= vapor velocity and
= liquid velocity.
2.3. Mathematical formulations
2.3.1. Mixture properties
In thermodynamic equilibrium, the average specific volume, and average specific enthalpy,
of a vapor/liquid propellant mixture may be evaluated using Equations (Equation2
[2] ) and (Equation3
[3] ):
[2]
[3] where subscripts
and
denotes gas and liquid phase, respectively. Parameter
denotes the quality (vapor mass fraction) of the two-phase mixture. Symbols
and
represent specific volume and specific enthalpy. Values of these properties for propellants were evaluated with the fluid property database REFPROP V.7.0 (National Institute of Standards and Technology, Gaithersburg, MD, USA).
2.3.2. Fluid state inside metering chamber and expansion chamber
The conditions in the metering chamber and expansion chamber are assumed to be homogenous and in thermodynamic equilibrium. The thermodynamic state of the two-phase propellant mixture in the chambers is defined by the local quality and temperature
. These are related to the average specific volume and average specific enthalpy of the propellant in a chamber using the following equations:
[4a]
[4b] where
and
are the specific volume change and specific enthalpy change due to evaporation. Furthermore, propellant mass is denoted by
and propellant enthalpy
in a chamber at any instant of time and
is the volume of a chamber.
Since the fluid is assumed to be in thermodynamic equilibrium in the metering and expansion chambers, the thermodynamic properties of the propellant are defined on the saturation line and hence they are unique functions of temperature. Thus, Equations (Equation4a[4a] ) and (Equation4b
[4b] ) are a system of two equations with two unknowns: quality x and temperature T. Elimination of
from Equations (Equation4a
[4a] ) and (Equation4b
[4b] ) yields
[5]
Equation (Equation5[5] ) is a nonlinear equation for the instantaneous chamber temperature
, which may be solved using the Newton–Raphson method. When
is computed, the quality
in a chamber at that instant can be calculated by substitution of its value in Equations (Equation4a
[4a] ) or (Equation4b
[4b] ).
The instantaneous mass of propellant, within a chamber is a function of time. As the metered discharge event progresses, the instantaneous mass in a chamber is equal to the difference of mass flowing into and out of a chamber through orifices at any time and may be found using Equation (Equation6
[6] ):
[6] where,
and
denote the mass flow rate into and out of a chamber, respectively. For the case of metering chamber, the term
is zero as there is no mass flow into this space. Integration of Equation (Equation6
[6] ) from the start of actuation event (
), to an intermediate time
, yields
[7] where
is the initial propellant mass in a chamber and
and
are the instantaneous mass flow rates into/out of a chamber, respectively. Similar to the propellant mass in a chamber, the enthalpy of a chamber is also a function of actuation time. The energy conservation equation for a chamber can be written as follows:
[8]
After integration, the chamber enthalpy at any actuation instant can be calculated using Equation (Equation9[9] ):
[9] where
is the initial enthalpy in the chamber.
and
are the mass flow rate into and out of a chamber, respectively, and
and
are the specific enthalpies of the propellant mixture in the chambers. The velocity inside the chamber was assumed to be negligible, hence kinetic energy terms in this region can be disregarded. For the sake of simplicity, the Euler forward differencing was chosen to integrate Equations (Equation7
[7] ) and (Equation9
[9] ). The size of time step
used to perform the integrations in Equations (Equation7
[7] ) and (Equation9
[9] ) was systematically reduced (down to 0.25 ms) to ensure that all results were independent of this parameter.
2.3.3. Flow through valve orifice and spray orifice
In order to evaluate flow changes in chambers, expressions for instantaneous two-phase mass flow rate are required to estimate mass loss from the chambers along the actuation. As propellant travels through orifices, the flow regime may be either sub-critical or critical. Critical flow occurs when the velocity of fluid at the exit plane of an orifice reaches the sonic velocity (Hewitt and Hall-Taylor Citation1970). Critical flow (also known as choked flow) is a limiting condition of mass flow rate. This condition prevails when the mass flow rate does not increase as the pressure of the downstream environment further decreases, while upstream pressure is fixed.
HEM model of orifice flow
For subcritical discharge through an orifice, neglecting the kinetic energy of the two-phase mixture in the upstream supply reservoir, the mass flux through an orifice between an upstream, and downstream reservoir at known pressures can be calculated as follows:
[10] where
is discharge coefficient and subscript 0 denotes stagnation conditions. The method developed by Starkman et al. (Citation1964) is used to determine critical (choked) discharge for a given fluid pressure and temperature in the upstream reservoir. The ratio of downstream and upstream pressures across the orifice is systematically reduced from 1 to 0 in small steps. At each step, the mass flux is evaluated and, finally, the maximum mass flow rate is determined, which corresponds to the critical discharge for the given upstream conditions.
SEM model of orifice flow
Using the definition of slip ratio (), the following relation for mass flux
can be established (Moody Citation1965):
[11] where
is calculated using Equation (Equation12
[12] ), assuming isentropic development of the two-phase mixture:
[12] where
is the entropy and
is the average two-phase entropy inside and at supply reservoir condition. The slip ratio is computed as follows:
[13]
The critical discharge is determined using Starkman's method of step-wise reduction of pressure ratio across an orifice described for the HEM.
HFM model of orifice flow
In the subcritical discharge regime, the mass flux at the orifice throat (Clark Citation1991) is obtained from
[14]
where, represents the ratio between downstream and upstream pressures.
For the case of critical discharge, the throat pressure in Equation (Equation14[14] ) is no longer equal to the downstream reservoir pressure as the choking pressure or critical pressure,
is generally higher. The critical pressure ratio is denoted by
. Rather than adopting a search strategy for the maximum mass flux, the HFM iteratively solves Equation (Equation15a
[15a] ) for critical pressure ratio
developed by Fletcher (Citation1975):
[15a] where
[15b]
Once is known, the critical pressure
can be found and the mass flux
is evaluated using Equation (Equation14
[14] ) with
.
2.3.4. Near-orifice spray expansion model for critical discharge conditions
As diagrammatically shown in Figure S1, in the online supplemental information (SI, Section S1), in choked conditions, the pressure at the spray orifice exit is higher than the downstream atmospheric pressure
. The emerging mixture experiences a rapid expansion to the pressure of the surroundings outside the nozzle exit. Fletcher (Citation1975) suggested that this should result in rapid vapor acceleration in the near-orifice region. The velocity increment
is computed by means of a 1-D axial momentum balance on the diverging control volume, highlighted in Figure S1 (see the SI, Section S1) by means of a dashed red line:
[16]
In Equation (Equation16[16] ), subscripts “NO” and “SO” denote near-orifice and spray orifice exit regions, respectively. This equation was derived by Fletcher for continuous discharge, but here it is applied to metered discharge, which is consistent with quasi-steady assumption proposed by Clark (Citation1991).
In Equation (Equation16[16] ), the average two-phase velocity at spray orifice exit,
, is calculated from the continuity equation:
[17] where
is the average specific volume of the propellant at the spray orifice throat. Depending on the preferred spray orifice model,
is calculated from Equation (Equation10
[10] ), (Equation11
[11] ), or (Equation14
[14] ).
The SEM model computes separate vapor and liquid velocities. In addition to these values, an average propellant velocity is also reported for the SEM. It is computed by assuming that the velocities of both phases are equal at the exit of the near-orifice control volume where the liquid and vapor momentum flows are mixed out. This allows us to predict a maximum value of the SEM droplet velocity.
2.4. Model validation
Results of the numerical models were compared with phase Doppler anemometry (PDA) measurements from Myatt et al. (Citation2015a,Citationb), acquired at a distance = 15 mm from the spray orifice. To add weight to our modeling activity, we also compare our modeling outcome against PDA data from Dunbar et al. (Citation1997) (taken at
= 25 mm) and Wigley et al. (Citation2002) (taken at
= 2.6 mm). The relevant actuator/test parameters for each PDA study are summarized in Tables S1–S3 (see the SI, Section S2). As regards the last dataset (Wigley et al.), there are several known limitations in the applications of PDA equipment to regions very close to the spray orifice. In this region, the spray is very dense, which causes problems due to multiple scattering and single particle realization. Reduced levels of signal validation due to droplet non-sphericity can also be problematic. Two arguments are brought forward in support of the use of Wigley's results at
= 2.6 mm in the present work: (Equation1
[1] ) velocity: these were validated with good agreement by repeating the experiments in PDA-mode and LDA-mode; the latter mode of operation is not limited to spherical droplets, (Equation2
[2] ) droplet size: these measurements are only possible in PDA-mode, however, the results were found to fit into a larger (unpublished) axial survey of aerosol velocity and droplet size up to 100 mm from the spray orifice with the same signatures of temporal distributions replicated in all the datasets and smooth axial variations of mean drop size.
Direct comparison of model predictions against PDA data requires further analysis of the PDA measurements. The aim of the analysis is to develop empirical correlations to capture axial decay rate of spray velocity. The correlations are then implemented to back extrapolate PDA measurements to near-orifice region where the predictions of the internal flow model corresponds to, and hence direct comparison between PDA measurements and model outcomes is achievable. The details of these analyses and the final correlations are presented in Section S1 (see the SI, Section S3).
3. Results and discussion
3.1. Near-orifice velocity predictions
Predictions of the near-orifice plume velocity using the HFM, HEM, and SEM models are compared with PDA measurements in and . The extrapolated PDA data, which are used for comparison with the results of our numerical models, are shown in the figures by means of the black dashed line. Predictions of alternative orifice flow models are color coded as shown in the legends.
Figure 3. Near-orifice prediction of plume velocity using different orifice flow models compared with PDA measurements of Myatt et al. (Citation2015a,Citationb). (a) HFA134; (b) HFA227.
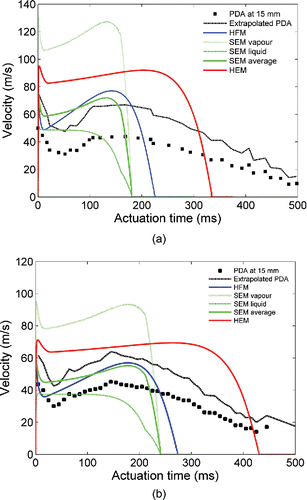
and shows that the pattern of the velocity variations with time is reasonably captured by all models. The velocity predictions exhibit an almost instantaneous rise in magnitude during the first time step, corresponding to the initial discharge of high quality vapor/liquid mixture through the spray orifice. After this point, a fall in the velocity is observed as the expansion chamber fills up and evaporation in this space becomes limited. Subsequently, as the expansion chamber empties, more propellant evaporates and the velocity increases almost linearly. This stage corresponds to quasi-steady phase of spray generation where the bulk of therapeutic droplets is produced (Versteeg et al. Citation2006).
The timing of the velocity minima does not exactly match the PDA curves. This indicates that the flow conditions are not fully established during the initial transient and the early velocity changes may also be affected by the presence of ambient air, which resists the flow motion, during the start-up phase of the actuation. One other possible source of mismatch is PDA measurement location. If the measurement point is situated further from the spray orifice, then there is more time required for droplets to arrive at this point. During this traveling time, droplets transfer momentum to and mix with surrounding gas slowing down the spray. Hence, the PDA curve appears to be stretched in temporal direction. These effects are expected to be minimized as the PDA measurement point is closer to the nozzle exit.
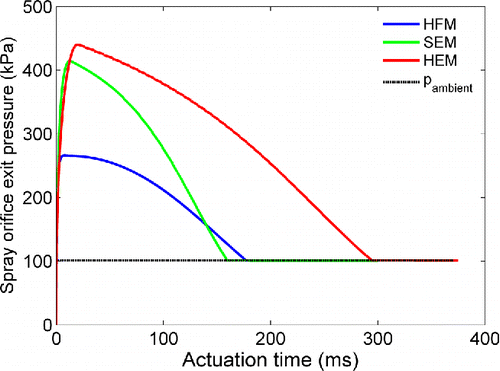
The predicted duration of the spray event varies substantially for the different models for prediction of the mass flow rate. It can be observed that HEM overpredicts near-orifice plume velocity for the entire actuation duration. The vapor phase velocity predicted by SEM is very large compared with the PDA data. These high velocity predictions are linked to the equilibrium assumption, which causes high predicted levels of evaporation inside the spray orifice. It should also be noted that the HEM and SEM predict higher pressure at the exit plane of spray orifice, compared with the spray orifice pressure predicted by HFM. The temporal variation of pressure at spray orifice exit for different orifice flow models is shown in for modeling parameters of Table S1, for HFA134a. As the propellant expands to ambient pressure, the driving force for near-orifice acceleration is larger causing a higher near-orifice velocity increment,, as predicted by Equation (Equation16
[16] ). For the sake of completeness, the corresponding spray orifice exit pressure, for HFA227, for the same modeling case is presented in Figure S2 (see the SI, Section S1).
Figure 4. Pressure at the exit plane of spray orifice as function of time for modeling parameters of Table S1 and HFA134.
According to , it can be seen that the liquid velocity predicted by SEM is below the extrapolated PDA data over the whole actuation event. However, it is interesting to note that the average velocity predicted by this model is reasonably close to the extrapolated measurements. The velocity predictions of HFM also show good agreement with the extrapolated PDA data for both HFA134a and HFA227. For HFA134a, the frozen model outcomes closely follow the PDA trace up to 200 ms and for HFA227 up to around 230 ms. These time points correspond to approximately 95% emission of the original propellant mass. From these instants onward, the model predictions show a rapid reduction of velocity due to adiabatic cooling of the propellant when the metering chamber is nearly empty, signaling the end of aerosol generation. The velocity decay of PDA curves at the end of the spray event is more gradual and takes place over a longer time scale. The more gradual decay of the measured velocity is probably caused by heat transfer between the actuator and the propellant. This provides the energy source for propellant evaporation, leading to slow emission of the last few percent of propellant remaining in the metering chamber and expansion chamber. The effects of heat transfer are not considered in the present adiabatic model.
shows predicted velocity using different models compared against the PDA measurements of Dunbar et al. (Citation1997). It should be noted that this particular set of data is measured at 25 mm away from spray orifice, i.e., . Over this distance plume significantly mixes with entrained air/vapor. Moreover, the PDA data were analyzed in time bins of 20 ms. Both these effects would tend to smooth out extrema in the velocity data. Again, the temporal trends of velocity are captured well by all models. It is evident that the velocity predictions of HEM and for the SEM vapor phase are consistently much higher than the extrapolated PDA curve, whereas the SEM liquid phase velocity is below the measured values over the entire actuation event. The prediction of average two-phase velocity by SEM and HFM are again closest to the extrapolated PDA data.
Figure 5. Near-orifice prediction of plume velocity using different orifice flow models compared with PDA. (a) PDA measurements of Dunbar et al. (Citation1997); (b) PDA measurements of Wigley et al. (Citation2002).
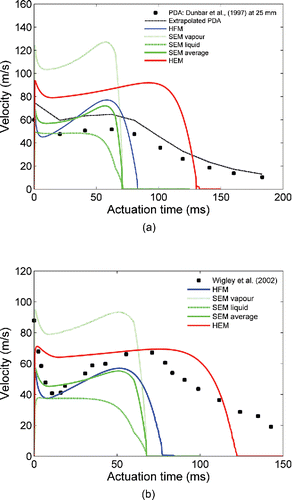
Model predictions are compared directly with the PDA measurements of Wigley et al. (Citation2002) in without velocity extrapolation. The measurements are conducted at 2.6 mm (), which is sufficiently close to the spray orifice to be considered as a point in the near-orifice region. Results confirm the previous findings regarding the temporal trends and velocity magnitude predicted by each model. As in the previous cases, the timing of predicted and measured velocity extrema was slightly different, but the differences were much smaller, since the measurement point is very close to spray orifice exit plane. Again, average two-phase velocity of SEM and HFM is closest to the measured data throughout the key stage of actuation event.
It is interesting to note that Dunbar questioned the existence of two velocity extrema and hypothesized that data dropout in dense spray regions was responsible for the velocity minimum (Dunbar, Citation1996; sec. 3.6.1.1–3.6.1.3). However, more recent PIV measurements by Crosland et al. (Citation2009), as well as PDA measurements of Wigley et al. (Citation2002) and those of Myatt et al. (Citation2015a,Citationb), support the existence of both velocity extrema.
3.2. Droplet size predictions
Predictions of temporal evolution of spray droplet size were made using a quasi-steady implementation of Equation (Equation1[1] ) for different modeling cases. In the previous section, two-phase average velocity predicted by SEM, and the HFM velocity, showed best agreement with measured velocities. Hence, these should be used for the internal flow calculations in droplet size predictions.
shows the values of Equation (Equation1[1] ) as function of time using
= 1 and instantaneous values of expansion chamber quality
and pressure
evaluated with the HFM and SEM models using the test case parameters summarized in Table S1. It can be seen that the models predict similar values for the two propellants HFA134a and HFA227 during the key phase of the actuation. The point at which SEM and HFM curves diverge from one another, is dictated by the predicted mass flow rate, which is slightly higher for SEM. Due to this similarity, the HFM flow model was used, because it showed the best estimates of the temporal distributions of near-orifice velocity and has good track record in predicting mass flow rate of flashing flows in short tubes (Huff Citation1985; Sher 2008; Gavtash et al. Citation2014). Droplet size values predicted using Clark's correlation (Equation (Equation1
[1] )) for test case with data summarized in Tables S1–S3 are compared with PDA data in CitationFigures 7a–d.
Figure 6. Temporal prediction of Equation (Equation1[1] ) with C = 1 for SEM and HFM orifice flow models, corresponding to parameters of Table S1.
![Figure 6. Temporal prediction of Equation (Equation1[1] ) with C = 1 for SEM and HFM orifice flow models, corresponding to parameters of Table S1.](/cms/asset/c17d615b-0fcd-47b5-a621-95eeae8713f5/uast_a_1282151_f0006_oc.gif)
The value of constant is adjusted to obtain the best match of the prediction curves with PDA measurement. PDA data are represented using the arithmetic mean diameter, denoted by D10, and the Sauter mean diameter, denoted by D32 (Lefebvre Citation1989). According to and , it can be seen that the temporal trend of the predicted droplet size follows more closely the measured trend of D10, for both propellants over the duration corresponding to 95% mass emission. This duration is shown with solid line and the remaining 5% propellant emission is shown using dashed lines. During the emission of the last 5% of propellant, the predicted droplet size sharply peaks up to very large values, because the pressure difference
tends to zero causing singular behavior of the non-dimensional pressure term in the denominator of Equation (Equation1
[1] ). When the pressure of the propellant in the expansion chamber approaches atmospheric pressure, Clark's correlation becomes invalid.
Figure 7. Prediction of spray droplet size using Equation (Equation1[1] ), compared with PDA measurements. (a) Myatt et al. (Citation2015a,Citationb), corresponding to parameters of Table S1 for HFA134. (b) Myatt et al. (Citation2015a,Citationb), corresponding to parameters of Table S1 for HFA227. (c) Dunbar et al. (Citation1997), Table S2. (d) Wigley et al. (Citation2002), Table S3.
![Figure 7. Prediction of spray droplet size using Equation (Equation1[1] ), compared with PDA measurements. (a) Myatt et al. (Citation2015a,Citationb), corresponding to parameters of Table S1 for HFA134. (b) Myatt et al. (Citation2015a,Citationb), corresponding to parameters of Table S1 for HFA227. (c) Dunbar et al. (Citation1997), Table S2. (d) Wigley et al. (Citation2002), Table S3.](/cms/asset/f8f08a17-ed90-45e7-8a9c-4e986fbde085/uast_a_1282151_f0007_oc.gif)
It can be seen that the initial peak, followed by the gradual decrease in droplet size is well captured by the model. It should be noted that the erratic nature of the measured D32 values is associated with unrepresentatively large effect of small numbers of very large spray droplets, resulting in large fluctuations in the temporal trace, sometimes with magnitudes of 10 µm to 20 µm. In spite of this limitation, D32 provides a useful upper bound for the sake of an order-of-magnitude comparison with prediction outcomes. It is also worth mentioning that the timing of the peak in the predicted droplet size does not match exactly with the corresponding one for the measured D10. The discrepancy was also observed in velocity traces in and and discussed in Section 3.1.
The results also show that the predicted droplet size magnitude can be matched with D10 or D32 by changing the value of constant from 1 to 3.5, respectively. Slightly smaller
values were required to match the droplet size data for HFA134a, indicating a possible dependence of
on the propellant. The red line corresponds to
= 1.82, which is the value proposed by Clark (Citation1991) for MMAD predictions for metered discharge and employed in the theoretical work of Wigley et al. (Citation2002). Predictions with this choice of constant were found to be somewhat closer to the D32 values for the above datasets. The results of droplet size are compared against the PDA measurement of Dunbar et al. (Citation1997) in and Wigley et al. (Citation2002) in . The original measurements in were reported using volume mean diameter, D30, and it was suggested that the measurements reasonably follow a Rosin–Rammler curve with size parameter
ranging from 8 to 12 µm and distribution parameter of
= 4.8 (Dunbar and Miller Citation1997). To maintain consistency, here we reconstruct corresponding D10 and D32 values to compare against modeling prediction, using the relations presented in Bailey et al. (Citation1983) for the Rosin–Rammler distribution. The results in show that the pattern of temporal variations of the predicted droplet size is broadly in line with the PDA measurements. Important features of the trace, such as the initial peak followed by gradual size reduction, are observable in both measurement and predictions. As discussed earlier, due to the significant plume/air mixing and the wide time bins, the peak of the droplet size curve is less pronounced. However, this extremum is more clearly observable in as the time bins are much shorter and the PDA measurement point is much closer to spray orifice and hence plume/air mixing has not taken place significantly.
Similar to previous case, droplet size magnitude in is a function of constant and it seems like a value ranging from 1.65 to 2.2 is the appropriate choice to this particular formulation and actuator compartment arrangement. In that employs HFA227 as propellant, the constant
is adjusted to 1.4 and 2.8 to capture D10 and D32 traces, respectively. Comparing to
values of the case shown in , which employs HFA227 as propellant as well, it is concluded that the value of this constant is also a function of location of comparison as well as actuator geometric properties.
4. Conclusion
The lack of a firm basis regarding two-phase flow regime and rates of interphase phenomena inside twin-orifice system of pMDI makes it difficult to be certain about the most relevant combination of thermodynamic and fluid dynamic assumptions for satisfactory prediction of the mass flow rate and spray velocity. This requires assessing the applicability of different two-phase orifice flow models to pMDI devices. With reference to primary atomization, the only available tool is Clark's (Citation1991) empirical correlation with a tuneable constant, the value of which requires measurements of the droplet size. In this work, we have studied these issues by comparing the spray velocity and droplet size predicted by our pMDI flow models with available PDA measurements in the literature.
Predicted flow velocity in the near-orifice region was directly related to the amount of evaporation assumed by the flow models. The predicted velocities of HEM and SEM vapor were the highest in the near-orifice region, because the choking pressure is predicted to be higher at spray orifice exit for the equilibrium models. This leads to large flow acceleration in near-orifice region. The SEM liquid phase velocity, on the other hand, was consistently well below the plume velocity. The HFM predicts the lowest near-orifice average two-phase velocity, which was generally closer to the PDA data. The closer agreement of HFM with data may suggest the non-equilibrium nature of the pMDI flow. Fauske (Citation1985) suggested that a length-to-diameter ratio () around 12–16 is required to approach thermodynamic equilibrium discharge in a pipe flow. For a typical pMDI actuator,
is around 2–3, so the propellant will emerge from the valve orifice and spray orifice as a metastable fluid with excess energy. Such excess energy is released outside the spray orifice as the propellant liquid flashes off.
Quasi-steady implementation of Clark's (Citation1991) correlation with HFM suggests that the temporal variations of droplet size can be predicted correctly. Comparison with PDA measurements indicates that the constant C in the correlation should take values in the range of 1–3 to match the values of D10 and D32. Details of the droplet size distribution are needed to connect these parameters with MMAD, which is the diameter metric in Clark's original correlation. However, for typical distributions (lognormal), MMAD is generally closer to D32.
Finally, we note that inspection of Equation (Equation1[1] ) shows that the result of the equation is droplet size expressed in units of length (microns). The denominator of Equation (Equation1
[1] ) contains dimensionless variables, so the constant
must have dimension of length (microns). This work has shown that the constant
takes different values for different test cases and propellants. The dimensionless numbers in the denominator of Clark's correlation have values between 0 and 1, so fixing the constant C in fact roughly fixes the droplet size for a given combination of formulation, device, and location of comparison between PDA data and droplet size predictions. Therefore, Clark's correlation has limited predictive ability, suggesting the need for development of models, which can predict pMDI atomization from first principles without the need for case-by-case adjustment.
UAST_1282151_Supplementary_File.zip
Download Zip (387.8 KB)Funding
The authors gratefully acknowledge financial support for this research by Chiesi Farmaceutici SpA.
Related Research Data
References
- Abramovich, G. (1976). Applied Gasdynamics. 4th revised ed. Izdatel'stvo Nauka, Moscow.
- Bailey, A. G., Balachandran, W., and Williams, T. J. (1983). The Rosin—Rammler Size Distribution for Liquid Droplet Ensembles. J. Aerosol Sci., 14(1):39–46.
- Clark, A. R. (1991). Metered Atomisation for Respiratory Drug Delivery, Ph.D. Dissertation. Loughborough University Of Technology, Loughborough, UK.
- Crosland, B. M., Johnson, M. R., and Matida, E. A. (2009). Characterization of the Spray Velocities from A Pressurized Metered-Dose Inhaler. J. Aerosol Med. Pulm. Drug Deliv., 22(2):85–98.
- Dolovich, M. B., and Fink, J. B. (2001). Aerosols and Devices. Respir. Care Clin. N. Am., 7(2):131–174.
- Dunbar, C. A. (1996). An Experimental And Theoretical Investigation Of The Spray Issued From A Pressurised Metered-Dose Inhaler, Ph.D. Dissertation. University of Manchester Institute of Science and Technology, Manchester, UK.
- Dunbar, C. A., and Miller, J. F. (1997). Theoretical Investigation of the Spray from A Pressurized Metered-Dose Inhaler. Atom. Sprays, 7(4):417–436.
- Dunbar, C. A., Watkins, A. P., and Miller, J. F. (1997). An Experimental Investigation of the Spray Issued From A pMDI Using Laser Diagnostic Techniques. J. Aerosol Med., 10(4):351–368.
- Fauske, H. K. (1985). Flashing Flows or: Some Practical Guidelines for Emergency Releases. Plant/Operat. Prog., 4(3):132–134.
- Finlay, W. H. (2001). The Mechanics of Inhaled Pharmaceutical Aerosols: An Introduction. 6 ed. Academic Press, London.
- Fletcher, G. E. (1975). Factors Affecting the Atomisation of Saturated Liquids, Ph.D. Dissertation. Loughborough University Of Technology, Loughborough, Uk.
- Gavtash, B., Versteeg, H. K., Hargrave, G. K., Lewis, D., Church, T., and Brambilla, G. (2014). Linear Instability Sheet Atomisation (LISA) Model to Predict Droplet Size Issued from A pMDI, in Proceedings Of The Ilass – Europe 2014, 26th Annual Conference On Liquid Atomization And Spray Systems, Bremen, September 2014, pp. 283–285.
- Hewitt, G. F., and Hall-Taylor, N. S. (1970). Annular Two-Phase Flow. Pergamon Press, Oxford, UK.
- Huff, J. (1985). Multiphase Flashing Flow in Pressure Relief Systems. Plant/Operat. Prog., 4(4):191–199.
- Ju, D., Shrimpton, J., and Hearn, A. (2010). The Effect of Reduction of Propellant Mass Fraction on the Injection Profile of Metered Dose Inhalers. Int. J. Pharm., 391(1):221–229.
- Lefebvre, A. (1989). Atomization and Sprays. CRC Press, Taylor & Francis, Florida.
- Moody, F. J. (1965). Maximum Flow Rate of a Single Component, Two-Phase Mixture. J. Heat Transfer, 87(1):134–141.
- Myatt, B., Lewis, D., Church, T., Brambilla, G., Hargrave, G., Versteeg, H., Long, E., and Gavtash, B. (2015a). PDA Analysis of HFA/Ethanol pMDI Aerosols: An Improved Test Protocol And New Findings, in Proceedings of the Iclass 2015, 13th Triennial International Conference on Liquid Atomization And Spray Systems, Thailand, August 2015, p. 11.
- Myatt, B., Newton, R., Lewis, D., Church, T., Brambilla, G., Hargrave, G., Versteeg, H., Gavtash, B., and Long, E. (2015b). PDA and High Speed Image Analysis Of HFA/Ethanol pMDI Aerosols: New Findings, in Ddl 26, Edinburgh, December 2015, pp. 73–77.
- Sher, E., Bar-Kohany, T., and Rashkovan, A. (2008). Flash-Boiling Atomization. Progress Energy Combust. Sci., 34(4):417–439.
- Starkman, E., Neusen, K., Maneely, D., and Schrock, V. (1964). Expansion of a Very Low Quality Two-Phase Fluid Through A Convergent-Divergent Nozzle. Trans ASME, J. Basic Eng., 86(2):247–254.
- Versteeg, H., Hargrave, G., and Kirby, M. (2006). Internal Flow And Near-Orifice Spray Visualisations Of A Model Pharmaceutical Pressurised Metered Dose Inhaler. J. Phys.: Conf. Ser., 45:207–217.
- Wigley, G., Versteeg, H. K., and Hodson, D., ILASS-Europe. (2002). Near-Orifice PDA Measurements And Atomisation Mechanism Of A Pharmaceutical Pressurised Metered Dose Inhaler, in Proceedings Of The 18th Annual Conference On Liquid Atomization & Spray Systems, Zaragoza, Spain, September 2002, pp. 165–170.