
 ?Mathematical formulae have been encoded as MathML and are displayed in this HTML version using MathJax in order to improve their display. Uncheck the box to turn MathJax off. This feature requires Javascript. Click on a formula to zoom.
Abstract
An in situ analytical method was demonstrated to measure the proton concentration ([H+]C-RUV) of an aerosol particle by using colorimetry integrated with a Reflectance UV-Visible spectrometer (C-RUV). Acidic particles comprising ammonium, sulfate, and water were generated in a flow tube under varying humidity and employed to calibrate the method using the inorganic thermodynamic models (i.e., E-AIM and ISORROPIA). The predictive [H+]C-RUV equation derived using strongly acidic compositions was then extended to ammonia-rich aerosols, which were lacking in the database of the thermodynamic models. The predictive [H+]C-RUV equation was also expanded to aerosols composed of sodium, ammonium, and sulfate. [H+]C-RUV generally agrees with both E-AIM predicted [H+] and ISORROPIA predicted [H+] for highly acidic aerosols, or aerosols at high humidity. For ammonia-rich aerosols under low humidity, [H+]C-RUV disagrees with that predicted from inorganic thermodynamic models. C-RUV was feasible for ambient aerosols because colorimetry is specific to aerosol acidity. Most aerosols collected at the University of Florida between 2018 and 2019 were acidic. Sodium ions appeared during the spring and summer, as coastal sea breezes traveled inland. The concentrations of ammonium and nitrate were high in the winter due to the phase partitioning of nitric acid and ammonia gases. The fraction of non-electrolytic dialkyl-organosulfate (diOS) to total sulfate is estimated by comparing the actual particle [H+] measured by C-RUV to the [H+] predicted using the inorganic composition and the inorganic thermodynamic models. The diOS fraction varied from 0% to 60% and was higher in the summer months when [H+] is high.
Copyright © 2020 American Association for Aerosol Research
1. Introduction
Sulfuric acid (H2SO4) forms from the atmospheric oxidation of sulfur dioxide (SO2) via reaction with OH radicals in the gas phase and heterogeneous reactions on the surface of preexisting aqueous aerosols (Liang and Jacobson Citation1999; Tanner, Leaderer, and Spengler Citation1981). H2SO4 is partially or fully neutralized with ammonia (NH3) gas in ambient air, forming sulfate aerosol (Huntzicker, Cary, and Ling Citation1980; Mcclenny et al. Citation1994). This sulfate contributes significantly to fine particulate matter and aerosol acidity (Jimenez et al. Citation2009; Lawal et al. Citation2018).
The aerosol acidity ([H+], mol/L) associated with sulfuric acid and its salts influences atmospheric chemistry, health effects, climate, ecosystems, and human assets. Numerous studies report that sulfuric acid catalyzes oligomerization of reactive organic species such as aldehydes and epoxides, increasing the yields of secondary organic aerosol (SOA) (Hallquist et al. Citation2009; Jang et al. Citation2002; Jang and Kamens Citation2001). Sulfuric acid can also react with organic species such as epoxy and alcohols to form organosulfates (Li, Jang, and Beardsley Citation2015; Liggio, Li, and McLaren Citation2005; Loeffler et al. Citation2006; Surratt et al. Citation2007). In particular, the transformation of sulfuric acid to dialkyl-organosulfate (di-OS) can reduce the aerosol’s hygroscopicity (Beardsley and Jang Citation2016; Im, Jang, and Beardsley Citation2014; Li, Jang, and Beardsley Citation2015; Zhou, Jang, and Yu Citation2019). The high mass fraction of acidic sulfate in aerosol decreases the relative humidity (RH) for the phase separation between organic and inorganic species (Bertram et al. Citation2011). Studies have also reported on the negative impact of aerosol acidity on human health (Lippmann Citation1985; Raizenne et al. Citation1996; Song et al. Citation2018; Spengler, Brauer, and Koutrakis Citation1990). Thurston et al. (Citation1994) reported that among particulate components collected from Toronto, Canada, the association between respiratory illnesses and H+, ozone, and sulfate (SO42-) is significant. Moreover, aerosol acidity appeared to have the strongest correlation to the adverse health effects of particulate matter. Acidic aerosols affect metal solubility in particulate matter by forming toxic transition metal ions, which are detrimental to respiratory health (Grahame and Schlesinger Citation2005). Additionally, acid aerosols increase the acidity of rainwater, which can cause damage to soil, plants, and buildings (Reis et al. Citation2012).
Despite the importance of aerosol acidity, its measurement remains inaccurate due to the lack of a complete database and in situ analytical methods. The traditional method was to dissolve aerosols in water and measure the hydrogen-ion activity of the solution using a pH meter. However, the non-ideality of [H+] for the highly salted atmospheric aerosol is very different from that in the diluted aqueous solution. Thus, the [H+] determined from the ion balance method or molar ratio method using the extracted aqueous solution is an inaccurate representation of the acidity of the aerosol (Hennigan et al. Citation2015).
Typically, [H+] in aerosols have been determined by applying the measured ion compositions, humidity, and temperature to inorganic thermodynamic models such as E-AIM (Clegg, Brimblecombe and Wexler Citation1998b) and ISORROPIA (Nenes, Pandis and Pilinis Citation1998b). E-AIM predicts proton concentration ([H+]E-AIM) (Clegg and Wexler Citation2011; Clegg, Brimblecombe and Wexler Citation1998b; Wexler and Clegg Citation2002) based on several experimental databases and parameterizes the activity coefficient of the proton. In the ISORROPIA model, the activity coefficient of H+ is a set constant (one) according to an internal database (Guo et al. Citation2015; Hennigan et al. Citation2015; Nenes, Pandis and Pilinis Citation1998a). When aerosol acidity is low, aerosol pH decreases as RH increases due to the addition of aerosol water content. However, the strong acidity calculated from the measured particle composition may be insufficient for providing meaningful estimates of aerosol acidity (Murphy et al. Citation2017). In general, both E-AIM and ISORROPIA support highly acidic aerosol or aerosol in high RH conditions due to the presence of a precise database. When RH decreases, however, the ionic strength increases, reducing the accuracy of the activity coefficient calculation for both E-AIM and ISOPORRIA. Song et al. (Citation2018) employed these two models to estimate the aerosol acidity of northern China winter haze. They found a large discrepancy between the two models, with high sensitivity in the aerosol phase assumption and inorganic compositions.
Limitations in the thermodynamic models include sensitivity to input values and uncertainty associated with the experimental database (Guo et al. Citation2015; Hennigan et al. Citation2015; Rindelaub et al. Citation2016). Rindelaub et al. (Citation2016) recently utilized Raman micro-spectroscopy to determine the pH of laboratory-generated magnesium sulfate (MgSO4)−H2SO4 particles. Craig et al. (Citation2017) also applied the Raman technique to directly determine the acidity of various particles (1 − 15 μm diameter), including nitric acid (HNO3)/nitrate (NO3−), oxalic acid, carbonic acid, and acetic acid. Though the data from the Raman spectrometer can improve the prediction of [H+], this technique is limited to the study of the pure compound. The spectrum of the complex particle mixture requires decoupling of each band, which is associated with a specific ionic species. Some spectral bands overlap each other. Additionally, the spectral peak shape, position, and intensity are affected by the hydrogen-bonding ability between chemical species, including water molecules.
In this study, we aim to demonstrate the capability of an online, in situ method to measure aerosol acidity by using Colorimetry integrated with a Reflectance Ultraviolet-Visible spectrometer (C-RUV) and apply the resulting technology to ambient aerosol. We compiled a more complete and accurate record of aerosol acidity for various aerosol compositions and RH compared to our previous study (Li and Jang Citation2012). This study utilizes a flow tube to perform experiments with an online system which includes aerosol generation, filter sampling, controlling the humidity of particle sample environments, and detection of aerosol acidity. The flow tube can lower the potential air contamination (Jungnikl et al. Citation2011) on a filter sample. Meanwhile, the aerosol acidity ([H+]C-RUV) in C-RUV is measured by the color change of the filter dyed with an indicator (i.e., metanil yellow), using the in situ UV absorption micro-spectrometer. By taking advantage of online measurement of the chemicals on the filter, the C-RUV method detects [H+]C-RUV under varying humidity without solvent extraction, circumventing the acidity changes that occur when dissolved in liquid solution. The C-RUV technique developed during this study was also applied to ambient aerosol collected on campus at the University of Florida, Gainesville, Florida between 2018 and 2019. Additionally, the fraction of non-acidic organosulfate (di-OS) to total sulfate was estimated by comparing the actual particle [H+] measured by C-RUV to the [H+] predicted using the inorganic composition (ion chromatography data and RH) through an inorganic thermodynamic model.
2. Method
2.1. Calibration of the C-RUV method in a flow tube under varying humidity
Gaseous chemical species such as ammonia, formaldehyde, and HNO3 can potentially interfere with the offline detection of aerosol acidity when sampling aerosol to a filter and transferring it to the spectrometer. In order to calibrate the C-RUV method without artifacts caused by the interaction of aerosol with gaseous contaminants, the experiments were performed in a clean flow tube under varying RH (20–80%) for the electrolytic aerosols comprised of inorganic species such as sodium (Na+), ammonium (NH4+), and sulfate (SO42−). shows the flow tube experimental setup. Prior to each experiment, the flow tube wall and the sampling holder were clean with water and ethanol to remove condensable chemical species (i.e., nitric acid, ammonia, and organics) on them, and flushed with the clean air.
Figure 1. Experimental setup of the flow tube used to calibrate aerosol acidity, using the C-RUV method under varying humidity and aerosol compositions (-
-
or
-
-
-
).
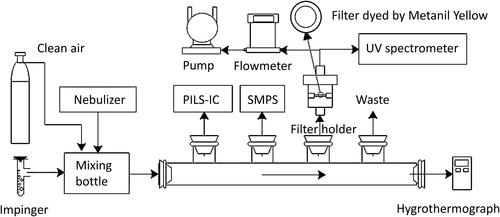
The aerosols were dispersed using an atomizer (Pari LC star, Starnberg, Germany) with clean air and introduced into the 3 L mixing chamber upstream from the flow tube. The aerosol was mixed with the humidified air in this mixing chamber to equilibrate aerosols at a certain RH. The humidified air was produced by passing the clean air through a small impinger with deionized water. The humidity-controlled air with electrolytic aerosols was then introduced into the flow tube. summarizes the experimental conditions of C-RUV calibration using the flow tube. Temperature and RH of the flow tube were monitored by an electronic hygrometer (Hanna Instruments, Italy). Aerosol compositions were measured by a Particle-Into-Liquid Sampler (Applikon, ADI 2081) coupled with ion chromatography (Metrohm, 761Compact IC) (PILS-IC). For calibration, the sampling flow rate of the filter sample for the C-RUV measurement ranges from 1-2 L per minute. The particle size distributions and their concentrations were measured by a scanning mobility particle sizer (TSI, SMPS Model 3080). The aerosol density was predicted by the E-AIM model (Clegg, Brimblecombe and Wexler Citation1998b; Wexler and Clegg Citation2002) at a given aerosol composition and RH. The water mass fraction of total aerosol was also predicted using E-AIM. The sampling mass was calculated using the sampling time, flow rate, aerosol density, and aerosol volume concentration (SMPS data).
Table 1. Inorganic aerosols produced in the flow tube for the calibration of aerosol acidity using the C-RUV method.
For the colorimetric method, a 13 mm diameter filter (Gelman Science Palflex, TX40H120-WW) dyed with an indicator [0.02% aqueous solution of metanil yellow (Sigma Aldrich)] was used. A detailed description for the preparation of the dyed filter has been reported previously (Jang Citation2013; Jang, Cao, and Paul Citation2008; Li and Jang Citation2012). The maximum light absorption of metanil yellow appears at 420 nm (yellow), and that of protonated metanil yellow at 545 nm (pink). To monitor the color change of the dyed filter, a micro-UV-Visible spectrometer was used (JAZ, Ocean Optics). The optical probe transfers the source beam from the spectrometer to the filter surface as well as the reflected beam from the filter to the detector in the micro-spectrometer.
2.2. Acidity measurement of ambient aerosol
The ambient aerosol was collected at the sampling site located in Black Hall on campus at the University of Florida, Gainesville, Florida (29.64°N, 82.35°W). The air of the sampling site is influenced by traffic air pollutants (HNO3, ozone, and NOx) from busy local roads, coal-fired power plants in northern Gainesville (GRU, 12 km from the site), sea breezes (from the Gulf of Mexico and the Atlantic Ocean), and plants (biogenic hydrocarbon sources). The size distribution and concentrations of particles were measured by SMPS (<1 µm) and an Optical Particle Sizer (OPS, TSI 330, 1-10 µm). Ionic concentrations (SO42-, NH4+, NO3-, and Na+) were measured using PILS-IC every hour. In the presence of sea salt aerosol, the sulfate associated with sea salt was estimated using [Na+]. The sulfate to Na+ molar ratio in sea salt aerosols is 0.06 (Bertram et al. Citation2018). Organic carbon (OC) and elementary carbon (EC) concentrations were monitored by a semi-continuous OC/EC analyzer (Sunset Laboratory, Model 4) every hour. Meteorological variables, including temperature, RH, and sunlight intensity were monitored using a hygrometer (CR10000 Measurement and Control System, Campbell Scientific) and an ultraviolet radiometer (Eppley Laboratory, model TUVR, wavelength range 290 to 385 nm), respectively. The acidity of the ambient aerosol was measured using the C-RUV method. A new filter sample was collected for 45 min every hour from 6AM to 6PM (EST). Ion concentration data using PILS-IC was collected at the mid-point of C-RUV sampling. The experimental set-up for the ambient aerosol data is shown in Figure S1 of Section S1 in the supporting information (SI). For ambient aerosols, Black Carbon (BC) can absorb UV-Visible light and interfere with C-RUV data. The light absorption spectrum of BC was measured using the aerosol sample collected on the undyed white filter and applied to the collection of the C-RUV spectrum. An example UV spectrum for the colorimetric filter sample and BC filter is shown in Figure S2(a) (SI). The correlation between EC mass and its light absorption is shown in Figure S2(b) (SI).
Figure 2. Measured proton concentration ([H+]C-RUV,E-AIM) in a (NH4)xHySO4 aerosol system using the C-RUV calibration curve (estimated with E-AIM). [H+]C-RUV,E-AIM is compared to the proton concentration predicted by E-AIM ([H+]E-AIM) and ISORROPIA ([H+]ISORROPIA) models.
![Figure 2. Measured proton concentration ([H+]C-RUV,E-AIM) in a (NH4)xHySO4 aerosol system using the C-RUV calibration curve (estimated with E-AIM). [H+]C-RUV,E-AIM is compared to the proton concentration predicted by E-AIM ([H+]E-AIM) and ISORROPIA ([H+]ISORROPIA) models.](/cms/asset/8b064d5f-c9ae-4be1-9dd9-e083902aeef5/uast_a_1711510_f0002_b.jpg)
3. Result and discussion
3.1. Prediction of aerosol acidity using C-RUV
3.1.1. Derivation of predictive equation for [H+]C-RUV in highly salted inorganic aerosol
The equilibrium reaction between an indicator (In) and H+ can be described as (Jang, Cao, and Paul Citation2008),
(1)
(1)
where
is the protonated indicator (i.e., metanil yellow). The concentration of unprotonated metanil yellow (
) is detected at 420 nm and that of protonated metanil yellow
) at 545 nm. The absorbance of
is different from that of
Thus, the relationship between
and
is written as:
(2)
(2)
where
is the absorbance at a given wavelength for the dyed filter affected by the acidic aerosol and k (0.443) is the ratio of molar absorptivity of
at 420 nm to
at 545 nm. The sum of
and
which is affected by the acidic aerosol, is proportional to the aerosol mass on the filter, and its relation is expressed as:
(3)
(3)
where
is a proportionality constant and
is the mass of inorganic aerosol.
(µg) can be calculated based on the experimental data as follows:
(4)
(4)
where
is the density (µg/nL) of inorganic aerosol (E-AIM II (Clegg, Brimblecombe and Wexler Citation1998a)),
is the volume concentration of aerosol (nL/m3),
is the flow rate (m3/s), and
is the sampling time (s).
The equilibrium constant () of a weak base (pH indicator) is expressed as (Bunnett and Olsen Citation1966; Hammett and Deyrup Citation1932):
(5)
(5)
where
is the activity and
is the molarity activity coefficient. EquationEquation (5)
(5)
(5) is rewritten as:
(6)
(6)
is a basicity as a form of –log (
). The activity coefficient term is defined as excess acidity (X) (Bunnett and Olsen Citation1966; Perrin Citation1964),
(7)
(7)
When applying excess acidity () of sulfuric acid to other systems in strong acidic media, X is proportional to
Then, EquationEquation (6)
(6)
(6) is expressed as (Cox and Yates Citation1978):
(8)
(8)
where
is a proportionality constant. Applying EquationEquations (2)
(2)
(2) and Equation(3)
(3)
(3) to EquationEquation (8)
(8)
(8) ,
is expressed as:
(9)
(9)
where α, m, k, and p
are empirically determined using experimental data.
3.1.2 Predictive equation for [H+]C-RUV using E-AIM and ISORROPIA
To produce the deterministic equation [H+]C-RUV, aerosol acidity from various electrolytic aerosols comprised of major atmospheric inorganic species, such as Na+, NH4+, and SO42-, was measured using C-RUV in a flow tube under varying humidity. We assume that [H+]C-RUV is reasonably predicted using the conventional inorganic thermodynamic models (i.e., E-AIM and ISORROPIA) for ammonia-poor aerosol. [H+]C-RUV is first calibrated with the highly acidic composition (y ≥ 1.5 for (NH4)xHySO4), which has a relatively accurate database and its acidity can be reasonably predicted using the conventional inorganic thermodynamic models (i.e., E-AIM and ISORROPIA). The predictive [H+]C-RUV is then extended to ammonia-rich aerosol, which is lacking in the database.
In general, the aerosol water content prediction between the two inorganic thermodynamic models is similar. The prediction of [H+]C-RUV is performed by fitting coefficients, α, m, and p in EquationEquation (9)
(9)
(9) to the [H+]E-AIM estimated using E-AIM or [H+]ISORROPIA using ISORROPIA at highly acidic aerosol (higher acidity than ammonium bisulfate). The predictive [H+]C-RUV equation is then extended to ammonia-rich aerosol, which is lacking in the database.
can be proportional to RH as
(Cox and Yates Citation1979; Li and Jang Citation2012; Perry Citation1984) for RH ranging from 0.15 – 0.93. The [H+]C-RUV, E-AIM equation calibrated using [H+]E-AIM can be expressed as:
(10)
(10)
EquationEquation (10)(10)
(10) is feasible for aerosol composed of sulfate and ammonium ions [(NH4)xHySO4 (x + y = 2)], and aerosol of the form Naz(NH4)yHxSO4 (x + y + z = 2). The estimation of [H+]C-RUV, ISORROPIA calibrated using ISORROPIA is expressed as:
(11)
(11)
Coefficient m (EquationEquation (9)(9)
(9) ) is nearly zero for the [H+]C-RUV, ISORROPIA. Interestingly, this result agrees with the assumption of the unit activity coefficient of H+ in ISORROPIA.
3.1.3. Comparison of [H+]C-RUV with [H+]E-AIM and [H+]ISORROPIA
[H+]C-RUV, E-AIM that is predicted as a function of RH and aerosol composition was compared with [H+]E-AIM and [H +]ISORROPIA. The FS is a numeric value used to represent an inorganic composition:
(12)
(12)
FS ranges between 1 (sulfuric acid) and 0.334 (i.e., (NH4)2SO4 as neutral aerosol). In , [H+]C-RUV, E-AIM is plotted vs. RH. The predictive [H+]C-RUV, E-AIM equation, which was obtained for the highly acidic aerosol, was applied to the entire (NH4)xHySO4 (x + y = 2) system. For the highly acidic aerosol (FS: 0.65 to 1), [H+]C-RUV,E-AIM agrees well with [H+]E-AIM. However, when x 0.8 (FS
0.56), [H+]C-RUV, E-AIM agrees at the high RH levels (RH = 0.7 and 0.8) but it deviates from [H+]E-AIM at low RH levels. In , [H+]C-RUV, ISORROPIA is plotted against RH. A similar tendency appeared in [H+]C-RUV, ISORROPIA. Overall, the deviation of [H+]C-RUV, E-AIM from [H+]E-AIM () is less than the deviation of [H+]C-RUV, ISORROPIA from [H+]ISORROPIA ().
Figure 3. [H+]C-RUV, ISORROPIA in the (NH4)xHySO4 aerosol system using the C-RUV calibration curve (estimated with ISORROPIA). [H+]C-RUV is compared with both [H+]E-AIM and [H+]ISORROPIA.
![Figure 3. [H+]C-RUV, ISORROPIA in the (NH4)xHySO4 aerosol system using the C-RUV calibration curve (estimated with ISORROPIA). [H+]C-RUV is compared with both [H+]E-AIM and [H+]ISORROPIA.](/cms/asset/5b225068-cee8-46cd-9b03-fbd114930e65/uast_a_1711510_f0003_b.jpg)
shows [H+]C-RUV, E-AIM as a function of FS at a given RH. When FS is larger than 0.5 (NH4HSO4), the difference between [H+]C-RUV, E-AIM and [H+]E-AIM is small. When FS is lower than 0.5, the difference is larger. A similar trend appeared in the FS vs. [H+]C-RUV, ISORROPIA plot (). Figure S3 illustrates both [H+]C-RUV, E-AIM and [H+]C-RUV, ISORROPIA as a function of RH for the Na(NH4)xHy(SO4)s (1 + x + y = 2s) system. In SI), both [H+]C-RUV,E-AIM and [H+]C-RUV, ISORROPIA are plotted vs. FS at a given RH for the Na(NH4)xHy(SO4)s (1 + x + y = 2s) system. When the FS value is larger than 0.5 (Figures S3 and S4, SI), [H+]C-RUV, E-AIM generally agrees with [H+]E-AIM. Similar to the (NH4)xHySO4 (x + y = 2) system, the deviation of [H+]C-RUV from the thermodynamic predicted [H+] ([H+]E-AIM or [H+]ISORROPIA) was larger with the lower FS value (<0.5) and the lower RH levels (<0.5). The deviation between the [H+]C-RUV, ISORROPIA and [H+]ISORROPIA is somewhat greater than that between the [H+]C-RUV, E-AIM and [H+]E-AIM. SI) summarizes [H+]C-RUV as a function of FS for the NazHySO4 (y + z = 2) system, which has no ammonium ion. A large gap appears among [H+]C-RUV, E-AIM (or [H+] C-RUV, ISORROPIA), [H+]E-AIM, and [H+]ISORROPIA. This indicates that the prediction of [H+] in NazHySO4 is even more uncertain than which was predicted for both the (NH4)xHySO4 and Na(NH4)xHy(SO4)s systems.
Figure 4. Comparison of [H+]C-RUV,E-AIM in the (NH4)xHySO4 aerosol system with the predicted [H+]E-AIM and [H+]ISORROPIA under varying FS at a given RH.
![Figure 4. Comparison of [H+]C-RUV,E-AIM in the (NH4)xHySO4 aerosol system with the predicted [H+]E-AIM and [H+]ISORROPIA under varying FS at a given RH.](/cms/asset/83156785-75fa-413e-877d-95d035034927/uast_a_1711510_f0004_b.jpg)
Figure 5. Comparison of [H+]C-RUV,ISORROPIA in the (NH4)xHySO4 aerosol system with the predicted [H+]E-AIM and [H+]ISORROPIA under varying FS at a given RH.
![Figure 5. Comparison of [H+]C-RUV,ISORROPIA in the (NH4)xHySO4 aerosol system with the predicted [H+]E-AIM and [H+]ISORROPIA under varying FS at a given RH.](/cms/asset/98fd9f49-51a1-4e1f-8c28-4524bc574e4e/uast_a_1711510_f0005_b.jpg)
In ISORROPIA, the activity coefficients of all inorganic species are treated as 1, while E-AIM calculates the activity coefficient of H+. The activity coefficient of ionic species, which is related to ionic strength based on the Debye-Hűckel relationship (Christ Citation1965; Rindelaub et al. Citation2016), will deviate from 1 and may largely affect the prediction of [H+] in ammonia-rich aerosol at low humidity levels. The original Debye–Hückel limiting law was derived to determine the activity coefficient of an ion in a dilute solution of known ionic strength and thus, deviations in the actual [H+] from the theoretically calculated [H+] occur at high concentrations, particularly with highly charged ion electrolytes. In recent studies, the data obtained using the Raman technique was incorporated with Debye–Hückel theory to estimate the H+ activity coefficient, γ(H+). Given the ionic strength of the inorganic solutions, γ(H+) ranged from 0.684-0.737 in the study by Rindelaub et al. (Citation2016) and from 0.68 − 0.75 in the study by Craig et al. (Citation2017). Both studies showed a relatively narrow range of γ(H+). The C-RUV technique in this study cannot provide γ(H+), but deals with the non-ideal response of indicator in the acidic media (EquationEquation (10)(10)
(10) ). The non-ideality of H+ that is related to the excess acidity term (i.e.,
in EquationEq. 10
(10)
(10) ) ranges from 0.77 (RH = 0.1) to 0.95 (RH = 0.8) with our C-RUV method.
3.2. Application of C-RUV to measurements of aerosol acidity in the ambient air
3.2.1. Correction of BC artifact
Black Carbon (BC) is commonly found in the ambient aerosol due to emissions from vehicle exhaust and biomass burning (Habib et al. Citation2008; Jeong, Kim, and Chang Citation2003; Wang et al. Citation2012) and this BC can interfere with the interpretation of C-RUV data. To correct for BC interference in the detection of [H+]C-RUV, the C-RUV spectrum of acidic aerosol is obtained by subtracting the BC spectrum from the spectrum of the total aerosol on the C-RUV filter ( in Section S1 of SI). The light absorption spectrum of BC between 300 nm and 800 nm was measured using the BC sample on the Teflon coated glass fiber filter without dye. Then, the light absorption of BC at 420 nm () and 545 nm (
) is correlated to the absorption of BC at 380 nm ((
)) with the following equation (Zhong and Jang Citation2014):
(13)
(13)
(14)
(14)
where AAE is the absorption Ångström exponent, defined as:
(15)
(15)
AAE is determined using the BC spectrum: AAE = 0.67 (±0.02). For EquationEqs. (13)
(13)
(13) and (Equation14
(14)
(14) ),
was chosen because the intensity of
is relatively larger than at longer wavelengths. BC absorption is correlated to EC mass (MEC, µg) using OC/EC data via separate experiments (, SI): AbsBC(380) = 0.291 × MEC (R2 = 0.95). Then
and
are obtained with MEC and AAE (EquationEquations (13)
(13)
(13) and Equation(14)
(14)
(14) , respectively) and applied to the C-RUV spectrum for the correction of BC interference on the measurement of ambient aerosol acidity. The spectrum in (SI) would be mostly from EC but it can partially originate from brown carbon (Chow et al. Citation2018).
3.2.2. Measurements of dialkyl organosulfate (diOS)
Among sulfates, diOS is neither acidic nor hygroscopic. The study by Li, Jang, and Beardsley (Citation2015) suggested that organosulfate (OS) in aerosol is unstable during PILS-sampling, which involves the condensation of high-temperature water vapor (100 °C), and decomposes an OS to sulfate and organics. PILS-IC tends to measure total sulfate (), while C-RUV directly measures aerosol acidity originating from acidic sulfates. The amount of diOS (
) can be determined by reducing
which is initially determined using IC measurements, until the predicted
equals the measured
Then,
is estimated using the difference between the initial
and the adjusted
based on
3.2.3. Correlation of aerosol acidity to the aerosol composition and humidity
The actual acidity of ambient aerosol is estimated based on the composition of electrolytic sulfate (), which includes inorganic sulfate (no diOS). For the convenience of predicting aerosol acidity, we also derive a polynomial regression equation to predict [H+] (mol/L) based on inorganic composition and RH as follows:
(16)
(16)
The fraction of diOS to total sulfate was determined using C-RUV and PILS-IC data based on the known method (Li and Jang Citation2012; Li, Jang, and Beardsley Citation2015). [H+]C-RUV,reg is estimated based on the FS value after removing from
3.2.1.1. Classification of ambient aerosol
The sampling site (University of Florida, Gainesville, Florida) in this study is suburban, which is affected by SO2, NH3, and NOx, and it can be occasionally influenced by SSA from the Oceans. Thus, ambient aerosol in this study includes inorganic species containing NH4+, SO42-, NO3-, and Na+ [sea spray aerosol (SSA)]; OC originating both from primary OC and secondary organic aerosol (SOA); and BC. The aerosol samples in this study were classified into three categories according to the season and wind direction ().
Figure 6. Classification of the ambient aerosol collected at the sampling site located on campus at the University of Florida, Gainesville, Florida. Detailed information on ambient sampling is provided in .
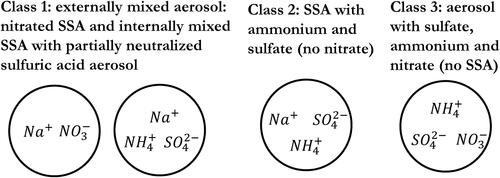
Class 1 is the sulfate aerosol (ammonium and sulfate) with influence from SSA and HNO3. We assume that two types of aerosols are externally mixed: the acidic aerosol comprising Na+-NH4+-SO42- and the aged SSA (Na+-SO42--NO3-). The aerosol acidity in Class 1 was estimated for Na+-NH4+-SO42- and was further adjusted via dilution with the aged SSA aerosol.
Class 2 is the aerosol internally mixed with SSA comprising Na+-NH4+-SO42- (no nitrate).
Class 3 is the aerosol containing NH4+-SO42--NO3- with no SSA.
summarizes ambient data collected through this study (temperature, RH, wind direction, aerosol compositions, and gaseous data). Figures S6–Figure S8 (SI) summarize the time profile of chemical species for the ambient data classified into Class 1, 2, and 3, respectively. The rationale for aerosol classification of this study will be discussed in the following section.
Table 2. Ambient sampling information and meteorological conditions.
3.2.1.2. Interpretation of seasonal data for acidity of ambient aerosol
OC data was decoupled into primary OC and secondary OC (OCsec) (Section S3). In general, a significant amount of OC was attributed to secondary OC (OCsec) at our sampling site (Figure S6–S8, SI). OC concentrations were high in the summer due to the impact of increased biogenic hydrocarbons on OCsec and sunlight intensity. No clear seasonal trend in sulfate appeared at this sampling site. Overall, [H+] rises each afternoon as seen in a-series in Figures S6–S8 (SI). Unlike the unit in µg/m3, [H+] that is in µmol/L of an aerosol volume will not be impacted by the expansion of the boundary layer at a given humidity and aerosol composition. [H+] can change by two factors: RH and aerosol compositions. In general, RH drops with increasing temperature during daytime. As seen in c-series in Figures S6–S8 (SI), ammonium concentrations (µg/m3) decreased due to expansion of the boundary layer and phase partitioning of ammonia to aerosols at high temperature. However, nonvolatile sulfate was insensitive to temperature and humidity, suggesting that sulfuric acid forms via photooxidation of SO2 during daytime.
Both ammonium and nitrate concentrations were relatively high during wintertime due to the condensation of nitric acid and ammonia onto particulate matter. During the colder months, no Na+ was present in the ambient aerosol. SSA originates from the ocean and can be transported across the state depending upon meteorological conditions. On cold days, wind directions are typically from land to sea while wind directions are from sea to land on hot days, causing intrusion of SSA into the region of the sampling site. Regardless of seasons, no chloride ions were found in any aerosols, suggesting that the chloride ion in SSA was depleted by acids such as sulfuric acid, nitric acid, and/or organic acids.
The aerosol acidity is dynamically influenced by the gas-particle partitioning of semivolatile compounds, such as HNO3/NO3- and NH3/NH4+ (Clegg, Brimblecombe and Wexler Citation1998b; Lawal et al. Citation2018). Although the phase partitioning method implemented in the inorganic thermodynamic model is uncertain for highly concentrated aerosols (high ionic strength), the phase partitioning method allows one to determine the accuracy of inorganic aerosol compositions. In order to theoretically determine the possible nitrate concentration in the particle phase ( µmol/m3), the concentration of gaseous nitric acid ([HNO3], ppb) is needed. [HNO3] was not monitored in this study, but the possible range of [HNO3] was estimated using gaseous NOx concentration (0.03
3
). (Day et al. Citation2009; Hanke et al. Citation2003; Peng et al. Citation2006; Spicer Citation1983). Particulate
was predicted using the E-AIM model integrated with the phase partitioning method based on [HNO3] for the upper and lower boundary levels. The predicted
was then compared to the measured
using PILS-IC in this study ().
[H+]C-RUV values in Class 1 and 2 (warm seasons) were generally acidic and higher than those in Class 3 (cold season). For the aerosols in Class 1 (spring data), we hypothesize an external mix of Na+-NH4+-SO42− and nitrated SSA aerosols. Under such an acidic environment in the moderately warm spring climate, the phase partitioning of HNO3 is very low. Evidently, the theoretically estimated ]upper values which are estimated using E-AIM with corresponding
upper, are trivial as seen in . However, the observed
] values are much higher than the
]upper, suggesting that nitrate binds to particulate matter by atmospheric processes other than the phase partitioning of nitric acid onto preexisting sulfated particulates. This fact supports our hypothesis for Class 1. The chloride in SSA is significantly depleted by nitrate in the urban environment. Additionally, this aged SSA might be nearly neutral in order to contain a substantial amount of particulate nitrate. In the summertime, nitrate was not observed in particulate matter (Class 2) supporting the insignificant phase partitioning of gaseous HNO3 at high temperature.
Due to the low acidity of the aerosol in Class 3, the uncertainty in C-RUV data is high. For the aerosol in Class 3, aerosol acidity was estimated using [H+]C-RUV,reg (EquationEquation (16)(16)
(16) ) and PILS-IC data at a given ambient RH. In the winter months (Class 3), the phase partitioning of NH3 and HNO3 increases both nitrate and ammonium concentrations in particulate matter. No SSA was observed due to the presence of seaward winds. The fraction of diOS to total sulfate in Class 1 and 2 varies, while diOS is not detectable.
4. Uncertainties and atmospheric implication
The online, in situ C-RUV method was developed to measure aerosol acidity collected on a dyed filter. The measurement of [H+]C-RUV using the flow tube improves the quality of the C-RUV calibration by preventing acidic species from reacting with base gases (i.e., ammonia), formaldehyde, and other organic vapors. For example, the previous study showed that [H+] was reduced by 11.8% ± 2.9% by exposing filter samples to reactive gases in the room air (Jang, Cao, and Paul Citation2008). Overall, both E-AIM and ISORROPIA agree with the C-RUV-driven prediction of aerosol acidity of ammonia-poor aerosols under high RH levels ( and ). However, the prediction driven by C-RUV measurements deviates from both E-AIM and ISORROPIA for the ammonia-rich aerosols at low RH and the aerosols containing a high fraction of Na+ (Figure S5, SI).
The C-RUV device and the predictive equation resulting from this study were also applied to measuring the acidity of aerosol collected in Gainesville, Florida. This study showed how ambient acidity dynamically changes with the seasons, sea breeze direction, and variation in emission scenarios. Like other areas in the Southeast United States (Lawal et al. Citation2018; Peng et al. Citation2019), the aerosol collected in this study was generally acidic due to the impact of SO2 and NOx. The ambient aerosol during the summer months in Gainesville was generally more acidic than the aerosol collected during the winter months, due to the photochemical activities of SO2 oxidation in the summertime and the temperature-dependent partitioning of ammonia. SSA appeared in the summer months due to sea breezes from both the Gulf Coast (∼80 km distance) and the Atlantic Coast (∼100 km distance). No chloride ions appeared in SSA, owing to the significant depletion by sulfate and nitrate. In the summer months, no nitrate appeared in the particle samples, but was observed in the winter samples due to the phase partitioning of nitric acid onto preexisting particulate matter (Class 3). In addition, ammonium concentrations are high in the wintertime.
Under our calibration range and C-RUV method, the detection limit of H+ is 0.2 ng per filter sample. Thus, the suitability of the C-RUV method is dependent of the sampling duration, the sampling flow rate, aerosol compositions, and aerosol mass concentrations. Additionally, the aerosol should be in the aqueous salted phase. Thus, the C-RUV method may not be appropriate for use in the dry season where RH is below efflorescence RH (ERH). The acidic inorganic aerosol in ambient air is likely aqueous because of its low ERH (Colberg et al. Citation2003). The aerosol acidity of most samples collected in the warm seasons was higher than the detection limit of the C-RUV method. The ambient aerosols collected for 45 min on cold days were weakly acidic and some H+ mass was lower than the detection limit of C-RUV method. Thus, the acidity of the weakly acidic aerosol was estimated using [H+]C-RUV,reg (EquationEquation (16)(16)
(16) ) which employed the measured ion compositions (IC data) and RH. The limit of C-RUV detection can be improved by modifying the sampling method in the future: i.e., collection of particles on a smaller area of dyed filter than the current method (1 cm diameter) and/or longer sampling duration. The C-RUV method also needs to be tested for different indicators, which have different basicity (
in EquationEquations (5)
(5)
(5) and Equation(6)
(6)
(6) ). Increasing the concentration of indicator is not recommended because the dissociation equilibrium of inorganic acid should not be changed by the protonation of the indicator.
The estimation of accurate [H+] in an aerosol can empower model predictability for SOA formation via acid-catalyzed aqueous reactions of organic species (Hallquist et al. Citation2009). In traditional analytical methods, non-electrical diOS is not separable from the total sulfate. The C-RUV method also enables quantifying non-electrolytic diOS in ambient particles (Figures S6–S8, SI). In addition to the uncertainty in [H+] estimation using inorganic thermodynamic models, the determination of aerosol acidity is also disputable because of the ambiguity in the definition of an inorganic medium for H+. In this study, [H+] was determined for hygroscopic inorganic species, excluding OC and diOS from total aerosol mass. Owing to the efforts from government agencies on air pollutant emissions, the levels of SO2 and NOx have continuously declined (Lawal et al. Citation2018). The current disparity in the reduction rates of pollutants (high OC/sulfate ratios) would potentially increase the diOS fraction of total sulfate. The C-RUV method will improve our understanding of aerosol climate forcing via improved prediction of aerosol hygroscopicity associated with the estimation of electrolytic sulfate.
Supplemental Material
Download MS Word (2.3 MB)Additional information
Funding
Related Research Data
References
- Beardsley, L. R., and M. Jang. 2016. Simulating the soa formation of isoprene from partitioning and aerosol phase reactions in the presence of inorganics. Atmos. Chem. Phys. 16 (9):5993–6009. doi:10.5194/acp-16-5993-2016.
- Bertram, A., S. Martin, S. Hanna, M. Smith, A. Bodsworth, Q. Chen, M. Kuwata, A. Liu, Y. You, and S. Zorn. 2011. Predicting the relative humidities of liquid-liquid phase separation, efflorescence, and deliquescence of mixed particles of ammonium sulfate, organic material, and water using the organic-to-sulfate mass ratio of the particle and the oxygen-to-carbon elemental ratio of the organic component. Atmos. Chem. Phys. 11:10995–1006. doi:10.5194/acp-11-10995-2011.
- Bertram, T. H., R. E. Cochran, V. H. Grassian, and E. A. Stone. 2018. Sea spray aerosol chemical composition: Elemental and molecular mimics for laboratory studies of heterogeneous and multiphase reactions. Chem. Soc. Rev. 47 (7):2374–400. doi:10.1039/C7CS00008A.
- Bunnett, J. F., and F. P. Olsen. 1966. Linear free energy relations concerning reaction rates in moderately concentrated mineral acids. Can. J. Chem. 44 (16):1917–31. doi:10.1139/v66-287.
- Chow, J. C., J. G. Watson, M. C. Green, X. Wang, L. W. A. Chen, D. L. Trimble, P. M. Cropper, S. D. Kohl, and S. B. Gronstal. 2018. Separation of brown carbon from black carbon for improve and chemical speciation network pm2.5 samples. Journal of the Air & Waste Management Association 68:494–510. doi:10.1080/10962247.2018.1426653.
- Christ, C. L. 1965. Solutions, minerals, and equilibria. Harper & Row.
- Clegg, S., and A. S. Wexler. 2011. Densities and apparent molar volumes of atmospherically important electrolyte solutions. 2. The systems h+− hso4−− so42−− h2o from 0 to 3 mol kg− 1 as a function of temperature and h+− nh4+− hso4−− so42−− h2o from 0 to 6 mol kg− 1 at 25° c using a pitzer ion interaction model, and nh4hso4− h2o and (nh4) 3h (so4) 2− h2o over the entire concentration range. J. Phys. Chem. A 115:3461–74. doi:10.1021/jp1089933.
- Clegg, S. L., P. Brimblecombe, and A. S. Wexler. 1998. Thermodynamic model of the system h+-nh4+-na+-so42–nb3–cl–h2o at 298.15 k. J. Phys. Chem. A 102 (12):2155–71. doi:10.1021/jp973043j.
- Clegg, S. L., P. Brimblecombe, and A. S. Wexler. 1998. Thermodynamic model of the system h+-nh4+-so42--no3−-h2o at tropospheric temperatures. J. Phys. Chem. A 102 (12):2137–54. doi:10.1021/jp973042r.
- Colberg, C. A., B. P. Luo, H. Wernli, T. Koop, and T. Peter. 2003. A novel model to predict the physical state of atmospheric h2so4/nh3/h2o aerosol particles. Atmos. Chem. Phys. 3 (4):909–24. doi:10.5194/acp-3-909-2003.
- Cox, R. A., and K. Yates. 1978. Excess acidities - generalized method for determination of basicities in aqueous acid mixtures. J. Am. Chem. Soc. 100 (12):3861–7. doi:10.1021/ja00480a033.
- Cox, R. A., and K. Yates. 1979. Kinetic equations for reactions in concentrated aqueous acids based on the concept of “excess acidity.” Can. J. Chem. 57 (22):2944–51. doi:10.1139/v79-479.
- Craig, R. L., L. Nandy, J. L. Axson, C. S. Dutcher, and A. P. Ault. 2017. Spectroscopic determination of aerosol ph from acid–base equilibria in inorganic, organic, and mixed systems. J. Phys. Chem. A 121 (30):5690–9. doi:10.1021/acs.jpca.7b05261.
- Day, D. A., D. K. Farmer, A. H. Goldstein, P. J. Wooldridge, C. Minejima, and R. C. Cohen. 2009. Observations of nox, σpns, σans, and hno3 at a rural site in the california sierra nevada mountains: Summertime diurnal cycles. Atmos. Chem. Phys. 9 (14):4879–96. doi:10.5194/acp-9-4879-2009.
- Grahame, T., and R. Schlesinger. 2005. Evaluating the health risk from secondary sulfates in eastern north american regional ambient air particulate matter. Inhalation Toxicology 17 (1):15–27. doi:10.1080/08958370590885672.
- Guo, H., L. Xu, A. Bougiatioti, K. M. Cerully, S. L. Capps, J. R. Hite, Jr, A. G. Carlton, S. H. Lee, M. H. Bergin, N. L. Ng, et al., 2015. Fine-particle water and ph in the southeastern united states. Atmos. Chem. Phys. 15 (9):5211–28. doi:10.5194/acp-15-5211-2015.
- Habib, G., C. Venkataraman, T. C. Bond, and J. J. Schauer. 2008. Chemical, microphysical and optical properties of primary particles from the combustion of biomass fuels. Environ. Sci. Technol. 42 (23):8829–34. doi:10.1021/es800943f.
- Hallquist, M., J. C. Wenger, U. Baltensperger, Y. Rudich, D. Simpson, M. Claeys, J. Dommen, N. M. Donahue, C. George, A. H. Goldstein, et al., 2009. The formation, properties and impact of secondary organic aerosol: Current and emerging issues. Atmos. Chem. Phys. 9 (14):5155–236. doi:10.5194/acp-9-5155-2009.
- Hammett, L. P., and A. J. Deyrup. 1932. A series of simple basic indicators. I. The acidity functions of mixtures of sulfuric and perchloric acids with water. J. Am. Chem. Soc. 54 (7):2721–39. doi:10.1021/ja01346a015.
- Hanke, M., B. Umann, J. Uecker, F. Arnold, and H. Bunz. 2003. Atmospheric measurements of gas-phase hno3 and so2 using chemical ionization mass spectrometry during the minatroc field campaign 2000 on monte cimone. Atmos. Chem. Phys. 3 (2):417–36. doi:10.5194/acp-3-417-2003.
- Hennigan, C. J., J. Izumi, A. P. Sullivan, R. J. Weber, and A. Nenes. 2015. A critical evaluation of proxy methods used to estimate the acidity of atmospheric particles. Atmos. Chem. Phys. 15 (5):2775–90. doi:10.5194/acp-15-2775-2015.
- Huntzicker, J. J., R. A. Cary, and C. S. Ling. 1980. Neutralization of sulfuric-acid aerosol by ammonia. Environ. Sci. Technol. 14 (7):819–24. doi:10.1021/es60167a009.
- Im, Y., M. Jang, and R. Beardsley. 2014. Simulation of aromatic soa formation using the lumping model integrated with explicit gas-phase kinetic mechanisms and aerosol phase reactions. Atmos. Chem. Phys. Discuss. 13 (3):5843–70. doi:10.5194/acpd-13-5843-2013.
- Jang, M. 2013. Devices and methods for measuring the acidity of airborne matter using uv-visible spectrometry (Patent Number: US8557184B2). USA: University of Florida Research Foundation.
- Jang, M., G. Cao, and J. Paul. 2008. Colorimetric particle acidity analysis of secondary organic aerosol coating on submicron acidic aerosols. Aerosol Sci. Technol 42 (6):409–20. doi:10.1080/02786820802154861.
- Jang, M., N. M. Czoschke, S. Lee, and R. M. Kamens. 2002. Heterogeneous atmospheric aerosol production by acid- catalyzed particle-phase reactions. Science 298 (5594):814–7. doi:10.1126/science.1075798.
- Jang, M., and R. M. Kamens. 2001. Atmospheric secondary aerosol formation by heterogeneous reactions of aldehydes in the presence of a sulfuric acid aerosol catalyst. Environ. Sci. Technol. 35 (24):4758–66. doi:10.1021/es010790s.
- Jeong, G. Y., S. J. Kim, and S. J. Chang. 2003. Black carbon pollution of speleothems by fine urban aerosols in tourist caves. Am Mineral 88 (11-12):1872–8. doi:10.2138/am-2003-11-1230.
- Jimenez, J. L., M. R. Canagaratna, N. M. Donahue, A. S. H. Prevot, Q. Zhang, J. H. Kroll, P. F. DeCarlo, J. D. Allan, H. Coe, N. L. Ng, et al. 2009. Evolution of organic aerosols in the atmosphere. Science 326 (5959):1525–9. doi:10.1126/science.1180353.
- Jungnikl, K., M. Rappolt, I. Shyjumon, B. Sartori, P. Laggner, and H. Amenitsch. 2011. Aerosol flow reactor with controlled temperature gradient for in situ gas-phase x-ray experiments-measurements of evaporation-induced self-assembly (eisa) in aerosols. Aerosol Sci Tech 45 (7):805–10. doi:10.1080/02786826.2011.564680.
- Lawal, A. S., X. Guan, C. Liu, L. R. Henneman, P. Vasilakos, V. Bhogineni, R. J. Weber, A. Nenes, and A. G. Russell. 2018. Linked response of aerosol acidity and ammonia to so2 and no x emissions reductions in the united states. Environ. Sci. Technol. 52:9861–73. doi:10.1021/acs.est.8b00711.
- Li, J., and M. Jang. 2012. Aerosol acidity measurement using colorimetry coupled with a reflectance uv-visible spectrometer. Aerosol Sci. Technol 46 (8):833–42. doi:10.1080/02786826.2012.669873.
- Li, J., M. Jang, and R. L. Beardsley. 2015. Dialkylsulfate formation in sulfuric acid seeded secondary organic aerosol produced using an outdoor chamber under natural sunlight. Environ. Chem. 13 (4):590–601. doi:10.1071/EN15129.
- Liang, J., and M. Z. Jacobson. 1999. A study of sulfur dioxide oxidation pathways over a range of liquid water contents, ph values, and temperatures. J. Geophys. Res. 104 (D11):13749–69. doi:10.1029/1999JD900097.
- Liggio, J., S.-M. Li, and R. McLaren. 2005. Heterogeneous reactions of glyoxal on particulate matter: Identification of acetals and sulfate esters. Environ. Sci. Technol. 39 (6):1532–41. doi:10.1021/es048375y.
- Lippmann, M. 1985. Airborne acidity - estimates of exposure and human health-effects. Environ. Health Persp. 63:63–70. doi:10.1289/ehp.856363.
- Loeffler, K. W., C. A. Koehler, N. M. Paul, and D. O. De Haan. 2006. Oligomer formation in evaporating aqueous glyoxal and methyl glyoxal solutions. Environ. Sci. Technol. 40:6318–23. doi:10.1021/es060810w.
- Mcclenny, W. A., K. J. Krost, E. H. Daughtrey, D. D. Williams, and G. A. Allen. 1994. Speciation of ambient sulfate particulate matter using ft-ir-based absorption to complement wet chemical and thermal speciation measurements. Appl Spectrosc. 48 (6):706–12. doi:10.1366/000370294774368956.
- Murphy, J. G., P. K. Gregoire, A. G. Tevlin, G. R. Wentworth, R. A. Ellis, M. Z. Markovic, and T. C. VandenBoer. 2017. Observational constraints on particle acidity using measurements and modelling of particles and gases. Faraday Discuss. 200:379–95. doi:10.1039/C7FD00086C.
- Nenes, A., S. N. Pandis, and C. Pilinis. 1998. Isorropia. A new thermodynamic equilibrium model for multiphase multicomponent inorganic aerosols. Aquat. Geochem. 4 (1):123–52. doi.
- Nenes, A., S. N. Pandis, and C. Pilinis. 1998. Isorropia: A new thermodynamic equilibrium model for multiphase multicomponent inorganic aerosols. Aquat. Geochem. 4 (1):123–52. doi:
- Peng, X., P. Vasilakos, A. Nenes, G. Shi, Y. Qian, X. Shi, Z. Xiao, K. Chen, Y. Feng, and A. G. Russell. 2019. A detailed analysis of estimated ph, activity coefficients and ion concentrations between the three aerosol thermodynamic models. Environ. Sci. Technol. doi:10.1021/acs.est.9b00181.
- Peng, Y. P., K. S. Chen, C. H. Lai, P. J. Lu, and J. H. Kao. 2006. Concentrations of h2o2 and hno3 and o3–voc–nox sensitivity in ambient air in southern taiwan. Atmos. Environ. 40 (35):6741–51. doi:. doi:10.1016/j.atmosenv.2006.05.079.
- Perrin, C. 1964. On relation between h0 + water activity. J. Am. Chem. Soc. 86 (2):256–8. doi:10.1021/ja01056a032.
- Perry, R. H. 1984. Perry’s chemical engineering handbook, 364–6. New York: Mcgraw-Hill Cor.
- Raizenne, M., L. M. Neas, A. I. Damokosh, D. W. Dockery, J. D. Spengler, P. Koutrakis, J. H. Ware, and F. E. Speizer. 1996. Health effects of acid aerosols on north american children: Pulmonary function. Environ. Health Persp. 104 (5):506–14. doi:10.1289/ehp.96104506.
- Reis, S., P. Grennfelt, Z. Klimont, M. Amann, H. ApSimon, J. P. Hettelingh, M. Holland, A. C. LeGall, R. Maas, M. Posch, et al, 2012. From acid rain to climate change. Science 338 (6111):1153–4. doi:10.1126/science.1226514.
- Rindelaub, J. D., R. L. Craig, L. Nandy, A. L. Bondy, C. S. Dutcher, P. B. Shepson, and A. P. Ault. 2016. Direct measurement of ph in individual particles via raman microspectroscopy and variation in acidity with relative humidity. J. Phys. Chem. A 120 (6):911–7. doi:10.1021/acs.jpca.5b12699.
- Song, S. J., M. Gao, W. Q. Xu, J. Y. Shao, G. L. Shi, S. X. Wang, Y. X. Wang, Y. L. Sun, and M. B. McElroy. 2018. Fine-particle ph for beijing winter haze as inferred from different thermodynamic equilibrium models. Atmos. Chem. Phys. 18 (10):7423–38. doi:10.5194/acp-18-7423-2018.
- Spengler, J. D., M. Brauer, and P. Koutrakis. 1990. Acid air and health. Environ. Sci. Technol. 24 (7):946–56. doi:10.1021/es00077a002.
- Spicer, C. W. 1983. Smog chamber studies of nitrogen oxide (nox) transformation rate and nitrate precursor relationships. Environ. Sci. Technol. 17:112–20. doi:10.1021/es00108a010.
- Surratt, J. D., J. H. Kroll, T. E. Kleindienst, E. O. Edney, M. Claeys, A. Sorooshian, N. L. Ng, J. H. Offenberg, M. Lewandowski, M. Jaoui, et al, 2007. Evidence for organosulfates in secondary organic aerosol. Environ. Sci. Technol. 41 (2):517–27. doi:10.1021/es062081q.
- Tanner, R. L., B. P. Leaderer, and J. D. Spengler. 1981. Acidity of atmospheric aerosols. Environ. Sci. Technol. 15:1150–3. doi:10.1021/es00092a003.
- Thurston, G. D., K. Ito, C. G. Hayes, D. V. Bates, and M. Lippmann. 1994. Respiratory hospital admissions and summertime haze air-pollution in toronto, ontario - consideration of the role of acid aerosols. Environ. Res. 65 (2):271–90. doi:10.1006/enrs.1994.1037.
- Wang, R., S. Tao, W. T. Wang, J. F. Liu, H. Z. Shen, G. F. Shen, B. Wang, X. P. Liu, W. Li, Y. Huang, et al, 2012. Black carbon emissions in china from 1949 to 2050. Environ. Sci. Technol. 46 (14):7595–603. doi:10.1021/es3003684.
- Wexler, A. S., and S. L. Clegg. 2002. Atmospheric aerosol models for systems including the ions h+, nh4+, na+, so42−, no3−, cl−, br−, and h2o. J. Geophys. Res. 107 (D14):4207. doi:10.1029/2001JD000451.
- Zhong, M., and M. Jang. 2014. Dynamic light absorption of biomass-burning organic carbon photochemically aged under natural sunlight. Atmos. Chem. Phys. 14 (3):1517–25. doi:10.5194/acp-14-1517-2014.
- Zhou, C., M. Jang, and Z. Yu. 2019. Simulation of soa formation from the photooxidation of monoalkylbenzenes in the presence of aqueous aerosols containing electrolytes under various nox levels. Atmos. Chem. Phys. 19 (8):5719–35. doi:10.5194/acp-19-5719-2019.