
 ?Mathematical formulae have been encoded as MathML and are displayed in this HTML version using MathJax in order to improve their display. Uncheck the box to turn MathJax off. This feature requires Javascript. Click on a formula to zoom.
Abstract
New emission legislation requires number concentration measurements of particles emitted by passenger cars during periodic technical inspections (PTI). For PTI suitable instruments are needed to detect faults, such as diesel particulate filter failures. Diffusion charging is well established as a charging method for particle sensors and is suited to realize low-cost instruments for exhaust particle number measurements in the appropriate size and concentration regime. In order to manufacture affordable instruments, sensors should not only be low cost, but their calibration procedure must be simple and reliable. We experimentally investigated the impact of test aerosol properties—such as material, size, concentration and morphology—on the counting efficiency of two pulsed-mode, unipolar diffusion charging approaches: (i) conventional diffusion charging and (ii) modulated precipitation. By separately characterizing the particle charging process and the overall sensor response with different test aerosols, we found that the modulated precipitation principle shows a very good correlation to particle number concentration, although the method significantly depends on the particle morphology. The conventional approach is not well suited for particle number measurements due to its intrinsic dependency on particle size.
We demonstrate that the counting efficiency of the modulated precipitation configuration measured with different tests aerosols stays within 3% for particle sizes up to 80 nm. The difference between a calibration with soot and salt particles with respect to the total solid particle number concentration was estimated to be smaller than 11%. Thus, a calibration according to recently introduced PTI legislation with any of the test aerosols considered is feasible. Tailpipe measurements confirmed the applicability of the modulated precipitation configuration for PTI. As a consequence, the use of diffusion charging based instruments in periodic inspections seems to be suitable due to appropriate sensor response and the simplicity of the calibration process.
Copyright © 2020 American Association for Aerosol Research
Editor:
1. Introduction
The Dieselgate scandal, as well as exceedances of air pollution in several regions in Europe, caused legislators to tighten the emission legislation for road traffic (Archer Citation2016). Type approval testing for homologation of vehicles in Europe has become more stringent due to the implementation of Real Driving Emission (RDE) tests for particle number and NOx emissions in 2017 (Regulation2017/13471347 Citation2017). Appropriate instrumentation for on-board solid particle number concentration (SPN)Footnote1 measurement has been developed, which is either based on diffusion charging (DC) or condensation particle counting (CPC) (Giechaskiel, Riccobono, and Bonnel Citation2015). Better type approval testing methods, however, cannot guarantee in-use conformity with respect to exhaust emissions. Illegal actions, like manipulations on the exhaust after-treatment system (e.g., removing the diesel particulate filter [DPF]) can only be recognized by effective market surveillance and in-service monitoring methods (Kadijk et al. Citation2017). It was shown that even a small damage of a DPF causes SPN emissions above the type approval limit (Yamada Citation2019). For this reason, individual European countries, like Belgium, Netherlands and Germany, are about to implement national regulations that require SPN emissions testing during periodic technical inspections (PTI) (AU-Richtlinie Citation2017; Giechaskiel et al. Citation2018). Recently, the first PTI legislation, defining specifications and acceptable errors for SPN instruments, has been introduced in the Netherlands (Ministerie van Infrastructuur En Waterstaat Citation2019). This legislation is based on the device specifications developed by the NPTI working group.Footnote2 Contrary to RDE, PTI application implies different demands on the measurement equipment. Most notably, the device must be affordable for the high number of garages that conduct the inspections, requiring a significantly lower price than on-board equipment. On the other hand, the measurement accuracy is less critical than what is required for type-approval equipment. Studies have shown that vehicles with a well working exhaust after-treatment system emit less particles than what is present in ambient air (about 104 cm−3), while a faulty DPF causes SPN emissions of more than 106 cm−3 (Burtscher, Lutz, and Mayer Citation2019; Gloor Citation2018). Thus, the instrument should have a measuring range of about to
cm−3 for particles between 20 and 200 nm of size. Further, it was shown that tailpipe SPN measurements at low idle speed correlate with test cycle measurements (New European Driving Cycle [NEDC] and Worldwide Harmonized Light Vehicles Test Cycle [WLTC]), whereas the current type approval SPN limit value of
km−1 corresponds to about 8 × 104 cm−3 (Giechaskiel et al. Citation2018). Accounting for a higher measurement uncertainty, a PTI limit value of 2.5 × 105 cm−3 seems reasonable (Kadijk et al. Citation2017). A field study of tailpipe SPN emission testing of 262 vehicles equipped with a DPF (Euro5b/Euro6) showed that the majority of the vehicles emit less than 3 × 104 cm−3, indicating a working DPF, or more than 5 × 105 cm−3, indicating a DPF malfunction. Thus, one can conclude that a SPN limit value somewhere between 105 and 5 × 105 cm−3 could be reasonable for determining a DPF failure (Burtscher, Lutz, and Mayer Citation2019). A study performed by GOCA in Belgium showed that about 15% of Euro5/Euro6 vehicles in use would fail a SPN test with a limit value of 2.5 × 105 cm−3, which emphasizes the need for PTI measurements as a reliable in-use surveillance method (Boveroux et al. Citation2019). The requirement of low manufacturing costs does not only concern the sensor itself, but also the calibration procedure. A simple but reliable unit test should be performed with a stable test aerosol at a concentration around the limit value (e.g.,
cm−3). NaCl particles, generated by an atomizer, would be a feasible test aerosol, as it is stable, easy to generate, uncritical with respect to toxicity (Shibata, Abe, and Yamaguchi Citation1983; Stabile et al. Citation2013), and also established for the calibration of automotive condensation particle counters (Giechaskiel et al. Citation2009). Test aerosols other than diesel soot can cause a significant measurement bias, especially for the lower cutoff size of automotive exhaust CPCs (Wang et al. Citation2010). Nevertheless, calibration with non-soot-like particles is also possible for RDE measurement equipment as long as the material influence is known (Giechaskiel Citation2018). Moreover, the particle measurement program (PMP) working group allows calibration of laboratory SPN testing equipment with particles other than diesel soot (Giechaskiel et al. Citation2012). Therefore, use of test aerosols different than diesel soot should not be excluded for calibration of PTI instruments, as long as the bias caused by different test aerosol properties, like material and morphology, is known. Also, the above-mentioned NPTI specifications allow the usage of various test aerosols as long as the material influence is known. This influence can be determined in a comprehensive type approval procedure for the instruments in order to allow for a simple unit test with a favorable test aerosol like NaCl.
Various manufacturers are currently developing SPN instruments for PTI application. As in the case of RDE instruments, the PTI prototypes are either based on condensation particle counting or diffusion charging, whereby DC based sensors can be realized in various configurations. DC is a simple and robust technique to charge nanoparticles for subsequent measurement in the above-mentioned size and concentration regime and is suitable to realize low-cost SPN instruments for PTI (Mohr, Lehmann, and Rutter Citation2005). However, there are some uncertainties of the sensor performance with respect to particle material, morphology and carrier gas composition. In the present study, we systematically investigate these influences by controlled laboratory measurements. We elaborate the differences when using test aerosols with different material and shape for two pulsed-mode DC measurement methods. First, we introduce the most important requirements for a particle number counter (PNC) for PTI application. Then we describe the measurement principles of the two pulsed-mode DC methods, followed by a literature review of the material and morphology dependency of DC methods. Afterwards, we describe the experimental methods, followed by a discussion of the findings. Finally, we evaluate the suitability of the favorable pulsed-mode DC method for PTI applications by (i) estimating the total SPN error and by (ii) tailpipe SPN field measurements.
2. Measurement principles
Particle number counters used for automotive emission measurements have to fulfill two main metrological requirements. First, there is a linearity requirement, meaning that the sensor response must be linear in particle number concentration, N, over the specified measuring range. Second, the sensors counting efficiency (CE) needs to stay within certain limitations. The CE is defined as the ratio of the number of particles counted by the instrument and the actual number of particles at certain particle diameters, and thus, specifies the particle size dependency of the sensor response. For the first PTI legislation in the Netherlands, the NPTI requirements, shown in , must be fulfilled.
Table 1. Counting efficiency requirements according to NPTI device specifications.
CPC based devices can more easily fulfill counting efficiency requirements (because the core sensor counts individual particles), but suffer from other drawbacks, such as the need of a high dilution ratio that causes measurement uncertainties (see Kulkarni, Baron, and Willeke Citation2011, Section 6.4.1). DC based sensors can be realized in various ways, such that the sensor response correlates with certain measures. Conventional, unipolar diffusion charging sensors measure the integrated charge transferred to aerosol particles and can be calibrated to measure lung deposited surface area within a particle size range between about 20 to 400 nm (Fierz et al. Citation2014; ICRP Citation1994; Todea et al. Citation2015). Beyond that, some devices allow for the measurement of particle number concentration (PN) and/or mean particle size within a certain particle size regime (Amanatidis et al. Citation2016; Fierz et al. Citation2011; Fissan et al. Citation2006; Litton, Graybeal, and Hertzberg Citation1979; Marra, Voetz, and Kiesling Citation2010). Using DC, compact, lightweight, energy efficient and robust particle number sensors can be realized (Kulkarni, Baron, and Willeke Citation2011). However, due to the charging process the sensor response may depend on particle size and shape, causing impacts on the sensors counting efficiency.
2.1. Steady-state diffusion charging sensors
In conventional, steady-state unipolar diffusion charging instruments, particles are charged by means of a corona discharge and are subsequently captured within a Faraday cage. Using an electrometer, a current, I, proportional to particle number concentration, N, multiplied with the average charge per particle is measured (Giechaskiel et al. Citation2014). The latter scales with a power law function of particle diameter, d, and thus, The power law exponent, x, is theoretically close to 1 in a size regime between 20 and 200 nm that is relevant for automotive exhaust soot particles,Footnote3 as shown by Nishida et al. (Citation2019b). Experimentally determined values for x are between 1.1 to 1.17 for 5 different indirect or turbulent jet unipolar chargers (Kulkarni, Baron, and Willeke Citation2011, Table 18-2). Higher values of x up to 1.91, reported by several authors, can be explained by high particle losses in the charger, poor charging conditions or uncertainties due to the experimental setup (Jung and Kittelson Citation2005; Kulkarni, Baron, and Willeke Citation2011; Ntziachristos et al. Citation2004). If a size selective element is used upstream of the measurement stage, the size dependency can significantly be reduced which enables the measurement of particle number concentration (Burtscher and Schmidt-Ott Citation2006; Litton, Graybeal, and Hertzberg Citation1979). Beyond that, some devices even allow for the additional measurement of a mean particle size by using a second measurement stage (Fierz et al. Citation2011; Marra, Voetz, and Kiesling Citation2010). Under the assumption of a typical particle size distribution, such sizing diffusion chargers could fulfill any counting efficiency requirements.
2.2. Pulsed-mode diffusion charging sensors
A second category of diffusion charging based sensors, so called pulsed-mode diffusion chargers, alter the particles’ charge states, e.g., by periodically turning the ion generation process on and off. As a consequence, initially uncharged particles in a continuous flow are either charged or remain uncharged depending on their location and the frequency of modulation. In this way, the sensor signal is an induced electrical current based on the alternating flux of charged particles and does not depend on an electrometer offset, which may drift during operation. Avoiding signal drift over time is the main advantage compared to steady-state chargers (Fierz et al. Citation2014).
In the present study we used two different pulsed-mode diffusion charging instruments, a commercially available Partector from Naneos particle solutions GmbH and custom-built pulsed-mode diffusion charging instrument which allows for different pulsed-mode measurement configurations. The Partector was the first device, which works according to a pulsed-mode diffusion charging configuration in combination with an induced current measurement without particle collection within the Faraday cage (Fierz et al. Citation2014). We call this principle the conventional pulsed-mode diffusion charging configuration (CDC), with a schematic shown in . Positive ions, generated by a pulsed corona wire charger, are mixed with aerosol particles. Particles are charged by diffusion of ions onto the particles’ surface when the corona is turned on. Excess ions are captured by an ion trap, while the charged particle cloud penetrates a Faraday cage downstream of the charging region. These particles generate an induced current pulse when entering the Faraday cage, and a current pulse with opposite sign when leaving the Faraday cage electrometer. In this way, the pulsed operation generates an alternating current signal with amplitude which is proportional to number concentration N times the average charge per particle
The average charge per particle (referred to as mean charge) scales approximately linearly with the particle diameter d, and therefore, the sensor response of the instrument is given by
Hence, the counting efficiency of the CDC configuration scales linearly with the particle diameter, which makes it hardly applicable for particle number measurements. The instrument is calibrated to measure lung-deposited surface area (LDSA)Footnote4 (Fierz et al. Citation2014).
Figure 1. Pulsed-mode measurement configurations based on diffusion charging: (a) conventional diffusion charging (CDC), (b) modulated precipitation (MP), under the assumption of initially uncharged particles.
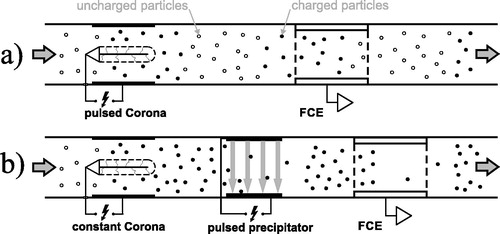
The custom-built device—further called pulsed-mode modular diffusion charger (PMDC)—can also be operated in the CDC mode, but works by default in the so called modulated precipitation (MP) configuration. The MP configuration is based on a patent of Burtscher and Schmidt-Ott (Citation2006) and is schematically shown in . In the MP mode, a corona wire charger is operated in steady-state mode. Ions are removed by an ion trap. Downstream of the charger, a parallel plate electrostatic precipitator (ESP) is operated in pulsed-mode by periodically applying a high voltage to remove a fraction of the charged particles, depending on the particles’ electrical mobility. Thus, the charge state of the particles is altered periodically. Downstream of the electrostatic precipitator, the particles induce an alternating current signal by penetrating a Faraday cage electrometer, similar to the one in the Partector. With this configuration, a sensor response proportional to number concentration can be achieved in a particle size regime relevant for automotive exhaust, i.e., This enables, e.g., to fulfill stringent counting efficiency requirements for automotive SPN measurements, such as RDE criteria (Giechaskiel Citation2018). Thus, the MP configuration should be sufficient for PTI application as well. Details on the MP principle can be found in Section S1 in the online supplementary information (SI). By pulsing the corona charger instead of the precipitator and disabling the latter, the PMDC can be operated in CDC mode. Further details on the differences between the two working principles have been described previously (Schriefl, Bergmann, and Fierz Citation2018).
Particles emitted by diesel vehicles without (or with a broken) DPF typically exhibit a trimodal particle size distribution (Kittelson Citation1998). For tailpipe SPN measurements, only the first two modes, the nucleation mode and the accumulation mode, are important. The nucleation mode is composed of very small (below 30 nm), volatile particles, while the accumulation mode mainly consists of solid soot agglomerates. As mentioned in the introduction, automotive PN measurements require the detection of solid particles of the accumulation mode only because the appearance of nucleation mode particles depends on many influence parameters and is therefore not reproducible. Thus, (semi)-volatile particles typically need to be removed prior to sampling with the PN instrument. In the PMDC this is done by (i) dilution of the exhaust gas with dry air using a porous tube diluter and (ii) by using an evaporation tube upstream of the corona charger. The dilution ratio of the instrument, which is given by the total flow rate divided by the sample flow rate (Kulkarni, Baron, and Willeke Citation2011, Eq. (6-82)), can be varied between 1 and 10. For the laboratory measurements performed in this article there was no need to remove volatile particles. Thus, the PMDC was operated without an evaporation tube and at a dilution ratio of 1 (no dilution). Tailpipe measurements were performed with the evaporation tube activated and at a dilution ratio of 3.
2.3. Dependency on particle material and morphology
While unipolar diffusion charging is known to be largely independent of the particle material, a significant morphology dependency was reported by several authors. In Section S2 of the SI, we give a literature review about material and morphology impacts on diffusion charging based sensors. In summary, literature results indicate a morphology impact but no significant material impact on steady-state diffusion chargers. However, to our knowledge, morphology effects on pulsed-mode diffusion charges have not been reported so far. Pulsed-mode diffusion chargers are becoming more interesting for automotive SPN measurements (Reinisch et al. Citation2015; Schriefl, Bergmann, and Fierz Citation2016). For different reasons, like simplicity, costs, width of size distribution, etc., automotive particle counters are often calibrated with compact particles like emery oil or NaCl (Giechaskiel et al. Citation2009), but are then applied for measurements with soot aggregates. Therefore, with this work we aim to elaborate on the material and morphology dependencies of pulsed-mode diffusion charging based methods which may help to indicate limitations for calibration.
3. Experimental method
Within this study we used two different laboratory test facilities to characterize the influence of test aerosol properties under controlled conditions. Additionally, we performed tailpipe PN measurements with the PMDC in order to evaluate the performance under real world conditions. Both laboratory test facilities allow for the investigation of the charging process and the overall sensor response (counting efficiency) with varying particle size, concentration, material and morphology.
The diffusion charging process may be characterized by determining the average number, of elementary charges, e, carried by monodisperse particles due to ion-particle charge transfer. This is done by simultaneously measuring the particle number concentration, N, and an electrical current, I, induced by the charged particles by collecting them within a Faraday cage, using an aerosol electrometer. If the volumetric flow rate, Q, through the aerosol electrometer is known, the mean charge can be obtained via
(1)
(1)
The second quantity of interest is the overall response of the two sensors—the Partector and the PMDC—with respect to particle number concentration. The particle size dependency of the response is characterized by the aforementioned counting efficiency (CE) as a function of particle size. The CE is determined by performing measurements for a range of particle sizes, using a reference PN sensor (typically a CPC or an aerosol electrometer) in parallel with the PN sensor in question (ISO2798127981, Citation2015). In our case, we measure the number concentration with the pulsed-mode diffusion charging instruments,Footnote5 and the reference concentration
with a CPC that has a 100% counting efficiency in the size regime of interest. (The overall accuracy of the reference CPCs used is 10% according to the manufacturer (TSI Incorporated Citation2006, Citation2012).) Thus, the counting efficiency of the instruments under investigation is given by
(2)
(2)
As mentioned in Section 2, SPN sensors for automotive applications must fulfill certain criteria with respect to counting efficiency in the size range between about 20 to 200 nm. As defined by the particle measurement program (Giechaskiel et al. Citation2012), the lower particle size limit, defined by the D50 cutoff (i.e., 50% counting efficiency), must be at 23 nm, whereas for particles larger than 41 nm the counting efficiency must be greater than 90%. CE criteria for on-board equipment—used for RDE tests—are less stringent compared to stationary SPN instruments used for type approval measurements (see Giechaskiel Citation2018). Such PN-PEMSFootnote6 systems are applied to diesel cars, which typically emit a particle size distribution of solid accumulation mode particles with a mean diameter between 60 and 120 nm (Harris and Maricq Citation2001). Therefore, PN-PEMS systems are typically calibrated at a particle size between 70 and 100 nm (i.e., 100% counting efficiency at the respective size). Our custom-build PMDC is by default calibrated with NaCl particles at 80 nm with a sensor flow rate of 1 and a precipitation voltage of 2000 V.Footnote7
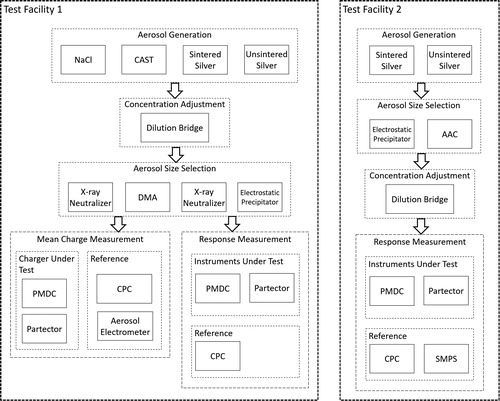
3.1. Test facility 1
The setup used at Test Facility 1 is shown on the left-hand side in . Three different polydisperse test aerosols can be generated: (i) carbonaceous soot (CASTFootnote8), (ii) NaCl, (iii) sintered, and (iv) unsintered silver particles. Downstream of the aerosol generators a dilution bridge is used to vary the particle concentration. Following the dilution bridge, the polydisperse aerosol is classified by means of the electrical mobility diameter using an X-ray neutralizer in combination with a Differential Mobility Analyzer (DMA). The monodisperse aerosol sample is then passed through a second X-ray neutralizer followed by an electrostatic precipitator, which ensures that the particles are uncharged before measurement. The X-ray neutralizer imparts a known charge distribution on the particles depending on the particle size, whereby the number of positively and negatively charged particles is nearly equal. Thus, the particle ensemble overall is nearly neutral but not uncharged. The electrostatic precipitator removes the positively and negatively charged particles, in order to avoid influence of the particles’ charge state within the investigations in this article. This is crucial due to the fact that pulsed-mode diffusion chargers are more sensitive to previously charged particles than filter-based devices operated in steady-state mode (Fierz et al. Citation2014). Although the electrical charge state of diesel exhaust particles is overall neutral rather than uncharged (Maricq Citation2006), we aim to investigate the material and morphology dependency without influence of preexisting charges. The latter has been investigated elsewhere (Ntziachristos et al. Citation2004; Schwelberger et al. Citation2019). The aerosol sample is then either used for counting efficiency, or for mean charge measurements. For the counting efficiency measurements, the aerosol sample is split in order to measure with the two instruments in question, the Naneos Partector and the custom-built PMDC, and a reference CPC in parallel.
Figure 2. Simplified schematic of the experimental setup used for mean charge and counting efficiency measurements at Test Facility 1, and for counting efficiency and linearity measurements at Test Facility 2.
The charging behavior of the two devices is characterized by mean charge measurements, for which the uncharged aerosol sample is passed through the charger under consideration (either the Partector or the charging unit of the PMDC). Downstream of the charger, the sample is split to simultaneously measure the particle number concentration with a CPC and the particle induced electrical current with an aerosol electrometer. A detailed description of the experimental setup and the instruments used at Test Facility 1 is given in SI, Section S3.1.
The setup at Test Facility 1 had some limitations, which are:
Concentration limit: The highest possible concentration measured with the CPC Model 3775 in the accurate single count mode is 5 × 104 cm−3, which is 5 times below the envisaged SPN limit for PTI counters.
Classifying the particles with a DMA is unfavorable due to a low particle throughput and due to the transmission of multiple charged particles with bigger size.
The tube furnace used for silver evaporation is limited to 1200 °C. A higher temperature would allow for the generation of larger silver agglomerates, which could show a greater morphology difference between sintered and unsintered silver particles.
To address these issues, we used an additional test facility, which is described in the following section.
3.2. Test facility 2
The experimental setup used at Test Facility 2 is shown on the right-hand side in , wherein either unsintered or sintered silver particles are used as test aerosol. At this test facility, silver agglomerates are also generated by evaporation and condensation within a furnace, but with the furnace operated at 1300 °C. Optionally, the silver agglomerates are passed through a sintering furnace in order to form compact silver particles. The aerosol sample is further passed through a custom-built electrostatic precipitator to remove any charged particles. The remaining uncharged fraction is then classified according to the aerodynamic particle diameter, using an aerodynamic aerosol classifier (AAC). The AAC classifies particles by balancing a centrifugal force, generated by a rotating cylinder, and a drag force, generated by the axial sheath flow through the cylinder. Thus, the AAC classifies particles independent of the charge state, which enables relatively high concentrations of the selected aerosol compared to charge based classifiers (Johnson et al. Citation2018), like the DMA used in Test Facility 1. A dilution bridge is used downstream of the AAC to adjust the concentration of the monodisperse aerosol sample. The sample is then split to measure with the instruments under evaluation (PMDC and Partector) in parallel to a reference branch. The reference branch either consists of a scanning mobility particle sizer (SMPS) to measure the number-weighted particle mobility diameter distribution, or a CPC 3776 only (in this case the neutralizer, the classifier and the DMA are bypassed). For the response measurements, both, the particle size and the concentration is varied. At each AAC set point, four measurements at different concentration settings with the Partector, the PMDC, and the CPC in parallel are recorded with a sample length of one minute. Additionally, Test Facility 2 provides the possiblity to perform scanning electron microscope (SEM) imaging of aerosol particles. SEM images of classified, sintered silver particles, as well as a more detailed description of the experimental setup at Test Facility 2 can be found in SI, Section S3.2. A very similar setup has been used by Nishida et al. comparing sintered and unsintered silver particles to assess the effect of particle morphology on the performance of a photoelectric charging-based device (Nishida et al. Citation2019a).
3.3. Tailpipe measurements
As a final evaluation, a few field measurements were performed with the PMDC operated in MP mode. Tailpipe PN measurements of four different vehicles were conducted with the PMDC with activated evaporation tube and a dilution ratio of 3 in order to remove (semi-)volatile particles. The device was calibrated within this configuration using NaCl particles, because the dilution and the activated evaporation tube can alter the CE curve of the device compared to , mainly due to particle losses. The calibration curve is shown in SI, Figure S10. In this configuration, the PMDC has a lower detection limit of about 2000 cm−3. At the same time, a TSI NPET (Model 3795Footnote9), which is a commercially available tailpipe particle number counter based on CPC technology, was used as a reference instrument. The exhaust particles emitted by the tested vehicles were sampled directly from the tailpipe using a metal probe for each of the devices, which were clipped onto the tailpipe. Measurements were performed at low-idle speed for a duration of at least one minute. The PN reporting frequency of both devices was 1 Hz. The vehicles used are listed in .
Figure 3. Counting efficiency curves of NaCl, soot, and silver particles (sintered and unsintered), measured at Test Facility 1 with the pulsed-mode modular diffusion charger (PMDC) in modulated precipitation (MP) (a) and conventional pulsed-mode diffusion charging (CDC) (b) configuration, and with the Naneos Partector (c). NPTI CE limits according to are visualized by the dark red boxes.
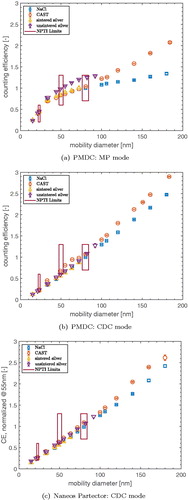
Table 2. Diesel vehicles used for tailpipe PN measurements in the field.
4. Results and discussion
4.1. Counting efficiency
The counting efficiency, measured at Test Facility 1 using different aerosol sources, is shown in . With the PMDC, operated in MP mode, the counting efficiency curve with NaCl particles is considered to be the reference case, which nicely fulfilled the NPTI CE criteria of 50% at 23 nm and 100% at 50 nm and 80 nm, and still showed a value of 133% at a particle size of 180 nm. More stringent CE criteria for on-board instruments according to Giechaskiel (Citation2018), shown in SI, Table S1, can also be fulfilled in this case. The CE curve measured with CAST particles agreed with the NaCl curve up to about 80 nm, but for larger particles a significant difference was observed, with an overestimation of 85% at 160 nm. The differences may originate from the particle morphology rather than from a material effect, as a significant material dependency has not yet been reported for diffusion charging based instruments (see Section 2.3). The counting efficiency measured with sintered silver particles agreed with the NaCl curve, while with unsintered silver particles the CE deviated significantly from the NaCl results. At 55 nm, the unsintered silver CE differed from the NaCl case by 19%, and at 72 nm by 23%, while the CE measured with sintered silver, CAST and NaCl agreed within 3% for particles nm. For a calibration at 70 nm or below (i.e., CE is normalized at this size), no correlation to soot-like particles, as suggested by Giechaskiel et al. (Giechaskiel Citation2018), is necessary.
shows the counting efficiency curves measured with the PMDC operated in CDC mode, and thus, in the same measurement configuration as the Partector. The counting efficiency for all test aerosols used scaled linearly with the particle size (sensor response ), resulting in a CE of more than 250% at 180 nm. The CE curves were slightly below the NPTI limits at 23 nm and 50 nm. If the slope of the CE curves would be increased slightly by tuning the calibration factor as shown in SI, Figure S2, the CDC mode might still be able to fulfill the NPTI criteria at the cost of accepting larger errors at larger particle sizes. More stringent CE criteria, which might be implemented in other countries that will not follow the NPTI specifications, cannot be fulfilled with the CDC configuration. The same problem would pertain for conventional steady-state diffusion chargers, whose counting efficiency scales about linearly with the particle diameter (see Section 2.1).
However, contrary to the MP case, CDC CE curves for different particle material and morphology did not show excessive deviations. Especially between sintered and unsintered silver particles there was no visible difference, indicating that the CDC configuration is rather insensitive to particle morphology. At 160, the deviation between soot and salt particles was 14%. nm
Similar results were obtained for the Partector, as shown in , with a deviation between soot and salt particles of 15% at 160 nm. The Partector has been calibrated to measure LDSA. Nevertheless, the counting efficiency was calculated by normalizing the curve measured with NaCl particles at 80 nm.
The counting efficiency measurements indicated a severe morphology and/or material effect for the MP configuration only. The bias for the CDC configuration was found to be much smaller. Deviations between NaCl and soot particles for both configurations may be caused by particle morphology, rather than particle material, as diffusion charging, in the size regime under question, is known to be rather insensitive to particle material, but depends on the particle shape.
Differences between the test aerosols may occur due to a different carrier gas composition, resulting in different ion properties, and thus, influence the charging process. Humidity in the carrier gas can affect the ion properties, and therefore the charging process (Kulkarni, Baron, and Willeke Citation2011). We experimentally investigated the influence of the carrier gas humidity on the CE measured with the PMDC in MP configuration. We found that the carrier gas humidity does not significantly affect the CE curve (see SI Section S4) and therefore conclude that the big differences found for the MP case were not caused by the carrier gas composition.
With the CDC configuration, the net charge transferred to the particles is measured, whereby the small bias observed in our measurements indicates a small morphology effect of the chargers under question. This would mean that there is a morphology dependency caused by the electrostatic precipitator within the MP configuration.
In summary, CE experiments show the ability of the MP measurement configuration for solid particle number measurements for PTI. However, we found that the MP sensor response depends on the particle morphology, and that this effect is caused by electrostatic precipitation rather than by the charging process. In order to confirm this conclusion, in the following, the morphology dependence of the charging process is investigated by mean charge measurements.
4.2. Mean charge measurements
Mean charge measurements were performed at Test Facility 1 with sintered/unsintered silver, soot and NaCl particles—as described in Section 3.1—using both instruments, the Partector and the charging module of the PMDC. The mean number of elementary charges per particle is plotted against mobility diameter for both chargers in . Measured charging curves were fitted with a function
whereby the slope k was used to quantify the morphology/material effect of the charging process, as it was done by Shin et al. (Citation2010). Alternatively, a power-law fit,
can be used to represent the size dependency of the charging curve, but this is only comparable if the same particle size regime is used. In our case, different size regimes were obtained with different test aerosols. Therefore, we assumed a linear behavior and applied the respective fit function.
Figure 4. Mean charge curves for the PMDC charging unit (a) and the Naneos Partector (b), measured at Test Facility 1 for sintered/unsintered silver, soot, and NaCl particles. A linear regression is applied to the mean charge curves, with the slope k used to calculate the charge difference.
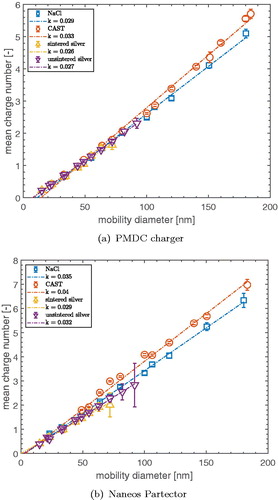
With the charging module of the PMDC, soot particles were 11% more charged than NaCl particles. The slopes for sintered and unsintered silver particles agreed within 5%. This indicates that the charging process was much less affected by the particle morphology than the CE of the MP configuration, shown in , which differs by 20% between sintered and unsintered silver particles at 72 nm. Comparing the charging curves for soot and NaCl up to the maximum particle size obtained with silver particles (82 nm) yielded slopes of k = 0.028 for NaCl and k = 0.029 for soot particles, which is in agreement with the silver charging curves. Similar results were obtained for the Partector (), with a difference between soot and NaCl charging curves of 11% and good agreement for sintered and unsintered silver particles.
Mean charge measurement results were in good agreement with the CE measurements for the CDC configuration. This confirms that (i) with the CDC configuration the charge transferred to the particles directly results in the measured current, and (ii) that a morphology effect found for the MP configuration (even below 80 nm for silver particles) was caused by electrostatic precipitation rather than by the charging process.
4.3. Particle morphology
The influence of particle morphology on the counting efficiency of the PMDC and the Partector was studied in more detail at Test Facility 2. At this facility, the tube furnace for silver particle generation could be operated at higher temperatures, which allowed for generating larger particles with a more significant morphology difference between sintered and unsintered particles of the same mobility diameter (see SI, Figure S6). The tandem AAC-DMA setup used at Test Facility 2 allowed for the estimation of specific morphology parameters, such as the effective density and the mass-mobility exponent. The effective density, describes the combined effect of the particle density and its shape, and can be derived from the aerodynamic diameter,
and the mobility diameter,
of the particles (Kulkarni, Baron, and Willeke Citation2011, p. 514). In the tandem AAC-DMA setup,
is given by the AAC setpoint, while
is determined from the number-weighted mobility diameter distribution measured by the SMPS. The mass-mobility exponent, ϵ, provides information about the particle shape by relating the particle mass and the mobility diameter (Abegglen et al. Citation2015). A mass-mobility exponent of 3 corresponds to a perfect sphere, whereas a value of 1 represents an infinite long chain-like structure. Details on the derivation of the effective density and the mass mobility exponent are provided in SI file, Section S5. The obtained values for the effective density of silver particles are listed in , showing that the effective density of sintered silver particles was clearly higher than that of unsintered particles. This, and the obtained values for the mass-mobility exponent (3 and 2.6, respectively, for sintered and unsintered silver particles) confirms that there was a notable morpohology difference between sintered and unsintered particles.
Table 3. Estimated effective density of silver particles used at Test Facility 2.
Due to their higher effective density, sintered silver particles could only be classified up to about 90 nm, while unsintered silver agglomerates were measured up to 160 nm.
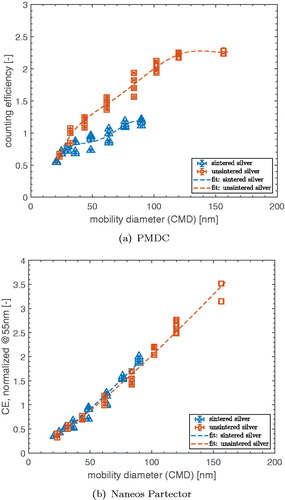
Counting efficiency measurements were performed with varying particle size and concentration, with sintered and unsintered silver particles for (i) the PMDC, operated in the MP mode, and (ii) the Naneos Partector, which operates in CDC mode. Particles were classified according to the aerodynamic particle diameter, set by the AAC. The classified number-weighted particle mobility diameter distribution was measured with an SMPS at each AAC set point. AAC set points used for CE measurements and the corresponding count median diameter (CMD) of the mobility based size distribution for sintered and unsintered silver particles are listed in . Measurement results are shown in . It can be seen that the findings from Section 4.1, shown in are confirmed: the CE, measured with the PMDC was much higher for unsintered silver agglomerates than for compact silver particles for a mobility diameter larger than about 30 nm. On the other hand, similar behavior for sintered und unsintered silver particles was found for the Partector. This supports the hypothesis that the morphology bias is caused by the electrostatic precipitator used within the MP configuration of the PMDC. One would expect that particles with the same electrical mobility diameter should behave in the same manner within the precipitator. Mean charge measurements have shown, that the significant morphology effect observed for the MP response must be caused by the precipitation section. The exact reason for the morphology effect caused by the ESP could not be identified. One possible reason could be the orientation of the particles relative to the flow field, which can play a role in measurements of irregular shaped particles (DeCarlo et al. Citation2004). A morphology effect can occur if the orientation of the particles relative to the flow field changes within the ESP section of the PMDC, which is likely for particles with a high aspect ratio.Footnote10 A hypothetic explanation for the observed morphology effect based on particle reorientation is given in SI, Section S6.
Figure 5. Counting efficiency measured with the PMDC, operated in MP mode (a) and the Naneos Partector (b) with sintered and unsintered silver particles at Test Facility 2. The mobility diameter (GMD) was measured with an SMPS. Dashed lines are a guide to the eye.
The observed effect may be unfavorable for calibration with test aerosols with a different morphology than the one of automotive exhaust particles, especially if calibration at particle sizes larger than 80 nm are required. On the other hand, the strong morphology effect on the MP sensor response may enable to measure the state of sintering, and therefore, the fractal dimension, using a pulsed-mode diffusion charger in MP mode, similar to the idea of Schmidt-Ott (Citation1988) supported by more recent studies (Nishida et al. Citation2019a).
4.4. Linearity measurements
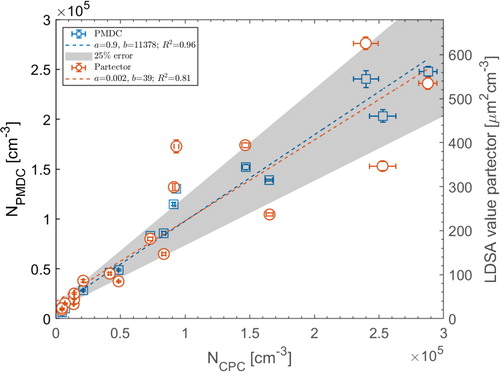
As mentioned in Section 2, a PNC must fulfill CE and linearity requirements. In this section we demonstrate how both requirements can be assessed with the measurement setup at Test Facility 2. Using the AAC as a size classifying device allowed for a higher particle transmission compared to a DMA based setup. In this way, counting efficiency measurements could be performed at much higher concentrations, and could be combined with linearity measurements by varying the concentration at each AAC setpoint. PN instruments for PTI purposes should reliably measure around the SPN limit value of about 2.5 × 105 cm−3, mentioned in Section 1. Therefore, the linearity to a PN reference should be checked at least up to the limit value, which is difficult to achieve with monodisperse particles downstream of a DMA. For the linearity measurements at Test Facility 2, both, the particle size and the concentration were varied, whereas the former was changed between 36 and 90 nm. At each AAC set point, four measurements at different concentration settings with the Partector, the PMDC, and the CPC in parallel were recorded. The concentration was adjusted with the dilution bridge to roughly achieve four equally distributed set points between a minimum detectable value, monitored with the Partector (approximately 8 μm2 cm−3), and a maximum value, which was kept below 3 × 105 cm−3, in order to operate the CPC 3776 within the accurate single particle count mode with coincidence correction (see TSI Incorporated Citation2006). shows linearity plots with varying particle size (36 to 90 nm) and concentration for sintered silver particles, measured with the PMDC and the Partector. The maximum concentration obtained downstream of the AAC was about 3 × 105 cm−3, which is just above an eventual limit value of 2.5 × 105 cm−3. Therefore, the AAC based measurement setup used at Test Facility 2 should be considered as an appropriate option for type-approval calibration of SPN sensors for PTI. The curves were fitted with a linear function and the coefficient of determination R2 was calculated in order to show correlation to PN. Additionally, a 25% error spread, which is required by the NPTI based legislation of the Netherlands (Ministerie van Infrastructuur En Waterstaat Citation2019), is indicated in the figure. The PMDC showed a good correlation to PN with an R2 value of 0.96 and a slope of 0.9. The Partector values, on the other hand, scattered much more, resulting in a worse correlation to PN with an R2 value of only 0.81. These results suggest, that, out of the two pulsed-mode DC principles that were investigated within this study, the MP configuration should be used for PN measurements rather than the CDC principle.
Figure 6. Linearity to PN for the PMDC and the Naneos Partector, measured with sintered silver particles with a mobility diameter between 36 and 90 nm. Both linearity curves are fitted with a function Additionally, a 25% error with respect to the fit function is plotted.
4.5. Error estimation for PTI measurements
In this section, we want to estimate how the uncertainties in the counting efficiency curves, caused by using different test aerosols, affect the total particle number measured by the PTI instrument. For that, we assume typical solid particle number distributions that would be measured at the tailpipe after removal of an eventual nucleation mode.
The counting efficiency curves represent the errors for PN measurements due to the particle size dependency of the sensor response. An ideal PNC for automotive measurements has a counting efficiency of one without any size dependency, except for the lower particle size regime (D50 cutoff at 23 nm according to the particle measurement program) and can be expressed by analytical formulas (Giechaskiel, Riccobono, and Bonnel Citation2014, Eq. 2.1).
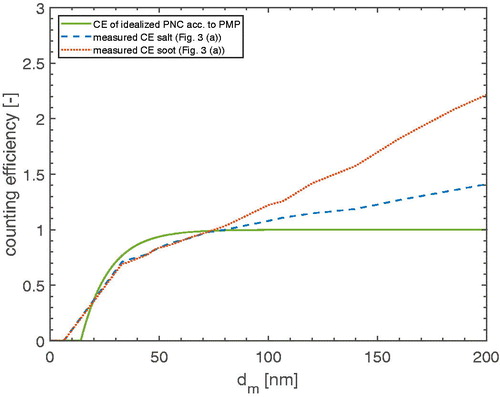
The PMDC is typically calibrated with salt particles, but could also be calibrated with a soot-like aerosol. Therefore, we want to estimate the total PN error for the MP counting efficiency curves for soot and salt particles of , in comparison with an ideal PNC by assuming typical particle size distributions. For that, we interpolate the CE curves measured with the PMDC in MP mode for soot and salt particles (see ), which significantly differ for particle sizes larger than 80 nm. The CE curves used for the error calculations are shown in .
Figure 7. CE curves used for the error estimation: idealized CE of an automotive PNC (solid, green line), interpolated PMDC CE (MP mode) for salt particles (dashed, blue line) and soot particles (dotted, red line).
A typical size distribution for solid diesel particles of the accumulation mode can be represented by a log-normal distribution function with a geometric mean diameter (GMD) of 70 nm and a geometric standard deviation (GSD) of 1.7 (Harris and Maricq Citation2001). For GDI, we assume a log-normal distribution with a GMD of 50 nm and a GSD of 1.9 (Giechaskiel et al. Citation2019). The size distributions used for the calculations are shown in . For the error estimation, the size distribution curves are weighted with the interpolated CE curves, shown in . The total error is obtained by integrating over the weighted and unweighted curves and calculating the relative deviation between them.
Figure 8. Typical number-weighted particle mobility diameter distributions for solid, automotive exhaust particles for diesel (a) and GDI (b). The original curves (purple) are multiplied with interpolated counting efficiency curves of an ideal PNC and the PMDC, shown in .
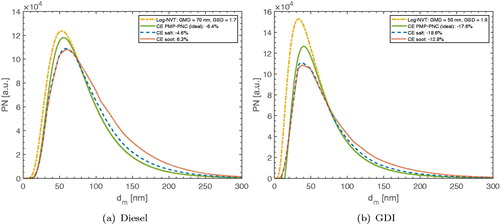
Results are shown in . For the diesel size distribution, the total PN is underestimated by 6% with the ideal PNC, while it is underestimated by 5% (salt) and overestimated by 6% (soot), respectively, with the PMDC. For the GDI case (see ) we obtain an underestimation of 17% for the ideal PNC and an underestimation of 19% (salt) and 12% (soot), respectively, for the PMDC. For type approval of PTI instruments, legislators might prescribe a calibration with soot-like aerosols in order to be comparable with the target application (Ministerie van Infrastructuur En Waterstaat Citation2019). Based on the calculated differences between the total PN error obtained with soot and the salt CE curves we conclude that a calibration with salt would cause an error of less than 11%. The maximum error for PN measurements according to the NPTI specifications is 25%. We are of the opinion that the much smaller deviations found in our calculations would justify the usage of NaCl as a calibration aerosol for our PTI prototype. The usage of NaCl particles as a test aerosol would simplify the calibration procedure for the (expected) high number of instruments, during manufacturing and in the field. This is due to the stable calibration procedure, the easy generation methodology and the uncritical calibration aerosol with respect to toxicity (Shibata, Abe, and Yamaguchi Citation1983; Stabile et al. Citation2013).
4.6. Tailpipe measurements
The PMDC was evaluated in the field by measuring tailpipe SPN emissions at low-idle speed of the four vehicles listed in . The measurement results, represented by the mean values over the measurement period for both devices used (PMDC and TSI NPET), are listed in . Vehicle #1 was measured twice, under cold start conditions (measurement #1) and after warming up the engine at a coolant temperature of above 60 °C (measurement #2). The other vehicles were also measured at a coolant temperature of above 60 °C.
Table 4. Tailpipe PN measurement results.
Vehicle #1 was equipped with a retrofitted DPF, which obviously did not work as the concentration for measurements #1 and #2 were above 107 cm−3. For the other vehicles, the particle number emissions were below 2 × 104 cm−3, indicating a properly working DPF. The mean values obtained with the PMDC agreed well with the reference values obtained with the TSI NPET except for measurement #4 (overestimation of 111%). This high relative deviation in the lower concentration regime may not be overemphasized, as the absolute deviation was very low (the NPTI specifications allow an absolute deviation of 2.5 × 104 cm−3 in this concentration regime [PTI 2019]), and the measurement value was below the lower detection limit of the PMDC, which is about 2000 cm−3. Moreover, it must be mentioned that values of the measurements #1, #2, #3 and #4 were outside the measuring range of the TSI NPET, which has a specified concentration range of 1000 to 5 × 106 cm−3 (TSI Incorporated Citation2015). Nevertheless, it can be seen that both devices could clearly identify working and not-working DPFs. A transient time series of PN values during cold start of vehicle #2 is provided in SI Section S7, confirming the good agreement between the PMDC and the TSI NPET.
The results of these few measurements must of course be confirmed by a higher number of field measurements in future work. However, in summary, they basically demonstrate the applicability of the PMDC for PTI measurements over a wide concentration regime.
5. Conclusions
In this study we experimentally characterized two pulsed-mode diffusion charging instruments, the Naneos Partector and a custom-built pulsed-mode modular diffusion charger (PMDC) concerning their applicability for PTI PN measurements. The Partector was operated in the CDC configuration, a measurement mode in which the diffusion charging process is pulsed. The PMDC was either operated in CDC or MP mode (default), whereas in the latter configuration a pulsed electrostatic precipitator is used. We investigated the influence of material, morphology, size and concentration of the test aerosol on the CDC and MP sensor response and the consequences for a calibration procedure. By measuring the counting efficiency we showed, that the MP configuration is well suited for SPN measurements for PTI purposes, and that any of the used test aerosols (sintered silver, soot or NaCl) can be used for a calibration according to the NPTI CE limits without providing a correlation factor as suggested by (Giechaskiel Citation2018). In contrast, the NPTI counting efficiency criteria can hardly be fulfilled by the CDC configuration due to the intrinsic particle size dependency of the measurement configuration. The same would apply to conventional, steady-state diffusion chargers. Thus, only advanced DC based sensors with a size selective element and/or a second measurement stage will be able to fulfill the NPTI criteria without problems.
Moreover, we found that the MP response is significantly influenced by the particle morphology for particles larger than 80 nm, while the CDC response is not substantially affected. Mean charge measurements with both devices confirmed that the morphology influence, found for the MP configuration only, is caused by the measurement configuration rather than by the charging process. An eventual influence of the carrier gas humidity could be excluded in an additional experiment using silver particles and varying carrier gas humidity.
The impact of the particle morphology without material influence was elaborated more detailed using sintered and unsintered silver particles with another test setup, capable of producing larger particles. As in the preceding experiments at Test Facility 1, we found a significant morphology influence for the MP configuration. We conclude, that the sensitivity of the MP principle to particle morphology might be used as a measure for the particle’s fractal dimension. This, of course, would need to be investigated in more detail in future work.
Linearity measurements by means of a calibration setup, which allowed for high particle concentrations after classifying, confirmed that the MP configuration is appropriate for PN measurements. We suggest that the AAC based measurement setup used at Test Facility 2 should be considered as an appropriate option for type-approval calibration of SPN sensors for PTI, with the possibility to estimate the effective density of the particles.
Based on the MP counting efficiency measured with soot and salt particles, we estimated the total particle number error by assuming representative solid particle number distributions that would be measured at the tailpipe after removal of a nucleation mode. With a maximum difference of 11% between the soot and the salt calibration curves, we conclude, that salt particles would be feasible for the calibration of the PMDC.
Finally, the performance of the PMDC was evaluated by tailpipe solid particle number measurements in comparison with a TSI NPET. We found reasonable agreement between the instruments over a wide concentration range, which demonstrates the applicability of the PMDC for PTI measurements.
Supplemental Material
Download PDF (5.3 MB)Acknowledgments
We want to acknowledge Dr. Marc Stettler for providing the the Naneos Partector and Dr. Xiao Zhang for his help regarding SEM imaging. Further, we want to thank Tristan Reinisch, Athanasios Mamakos and Martin Cresnoverh from AVL List GmbH for providing the aerosol electrometer and the catalytic stripper. We further want to thank Mario Kuhls from TUEV Nord for providing the test vehicles and the TSI NPET as a reference instrument for tailpipe measurements.
Notes
1 Particle number with respect to European emission legislation actually refers to the number concentration of solid particles emitted by motor vehicles. (Semi-)volatile components are typically removed before measurement. In order to emphasize this, we use the term solid particle number (SPN) instead of the abbreviation PN.
2 Information about the NPTI group is available on the VERT web page: https://www.vert-dpf.eu/j3/index.php/projects/technology-projects/9-cat-projects/50-inspection-diesel-and-gasoline-motors.
3 This size regime actually refers to nonvolatile particles of the so called accumulation mode. Besides the accumulation mode, there can be another mode consisting of very small (below 20 nm), solid, nonvolatile particles. This mode is referred to as the core mode (Rönkkö et al. Citation2007).
4 Lung-deposited surface area (LDSA) is defined as particle surface area per unit volume of carrier gas multiplied with the deposition probability in the lung, which is based on a simulation model (ICRP Citation1994). The unit of LDSA is μm2 cm−3.
5 The Partector is calibrated to measure LDSA rather than number concentration. Thus, the CE of the device is given by the ratio of the LDSA value and and is not dimensionless. In order to be comparable with the CE curve of a number counter, the CE curve of NaCl particle measured with the Partector is normalized at 80 nm, which is equivalent with using a calibration factor, calculated at 80 nm, as it is done for the PMDC.
6 PEMS stands for Portable Emission Measurement System.
7 nL min−1 stands for liters per minute at normal temperature and pressure conditions (0 °C and 1 atm).
8 CAST stands for Combustion Aerosol Standard.
10 Calculations have shown that the drag force acting on elongated particles with an aspect ratio of 2 can increase by 14% depending on the orientation relative to the flow field (Kulkarni, Baron, and Willeke Citation2011, Table 23-1).
References
- Abegglen, M., L. Durdina, B. T. Brem, J. Wang, T. Rindlisbacher, J. C. Corbin, U. Lohmann, and B. Sierau. 2015. Effective density and mass-mobility exponents of particulate matter in aircraft turbine exhaust: Dependence on engine thrust and particle size. J. Aerosol Sci. 88:135–47. doi:10.1016/j.jaerosci.2015.06.003.
- Amanatidis, S., M. M. Maricq, L. Ntziachristos, and Z. Samaras. 2016. Measuring number, mass, and size of exhaust particles with diffusion chargers: The dual Pegasor Particle Sensor. J. Aerosol Sci. 92:1–15. doi:10.1016/j.jaerosci.2015.10.005.
- Archer, G. 2016. Dieselgate: Who? What? How? Transport & Environment, 1–30.
- AU-Richtlinie. 2017. Änderung der Richtlinie für die Durchführung der Untersuchung der Abgase von Kraftfahrzeugen nach Nummer 6.8.2 der Anlage VIIIa Straßenverkehrs-Zulassungs-Ordnung (StVZO) (AU-Richtlinie).
- Boveroux, F., S. Cassiers, P. Buekenhoudt, L. Chavatte, P. De Meyer, H. Jeanmart, S. Verhelst, and F. Contino. 2019. Feasibility study of a new test procedure to identify high emitters of particulate matter during periodic technical inspection. SAE Technical Papers, 2–9.
- Burtscher, H., T. Lutz, and A. Mayer. 2019. A new periodic technical inspection for particle emissions of vehicles. Emiss. Control Sci. Technol. 5 (3):279–87. doi:10.1007/s40825-019-00128-z.
- Burtscher, H., and A. Schmidt-Ott. 2006. Verfahren und Vorrichtung zur Messung der Anzahlkonzentration und des mittleren Durchmessers von in einem Trägergas suspendierten Partikeln.
- DeCarlo, P. F., J. G. Slowik, D. R. Worsnop, P. Davidovits, and J. L. Jimenez. 2004. Particle morphology and density characterization by combined mobility and aerodynamic diameter measurements. Part 1: Theory. Aerosol Sci. Technol. 38 (12):1185–205. doi:10.1080/027868290903907.
- Fierz, M., C. Houle, P. Steigmeier, and H. Burtscher. 2011. Design, calibration, and field performance of a miniature diffusion size classifier. Aerosol Sci. Technol. 45 (1):1–10. doi:10.1080/02786826.2010.516283.
- Fierz, M., D. Meier, P. Steigmeier, and H. Burtscher. 2014. Aerosol measurement by induced currents. Aerosol Sci. Technol. 48 (4):350–7. doi:10.1080/02786826.2013.875981.
- Fissan, H., S. Neumann, A. Trampe, D. Y. H. Pui, and W. G. Shin. 2006. Rationale and principle of an instrument measuring lung deposited nanoparticle surface area. J. Nanopart. Res. 9 (1):53–9. doi:10.1007/s11051-006-9156-8.
- Giechaskiel, B. 2018. Real Driving Emissions (RDE): Particle Number (PN) Portable Measurement Systems (PEMS) calibration. Publications Office of the European Union.
- Giechaskiel, B., A. Joshi, L. Ntziachristos, and P. Dilara. 2019. European regulatory framework and particulate matter emissions of gasoline light-duty vehicles: A review. Catalysts 9 (7):586. doi:10.3390/catal9070586.
- Giechaskiel, B., T. Lahde, R. Suarez-Bertoa, M. Clairotte, T. Grigoratos, A. Zardini, A. Perujo, and G. Martini. 2018. Particle number measurements in the European Legislation and future JRC activities. Combustion Engines.
- Giechaskiel, B., A. Mamakos, J. Andersson, P. Dilara, G. Martini, W. Schindler, and A. Bergmann. 2012. Measurement of automotive nonvolatile particle number emissions within the European legislative framework: A review. Aerosol Sci. Technol. 46 (7):719–49. doi:10.1080/02786826.2012.661103.
- Giechaskiel, B., M. Maricq, L. Ntziachristos, C. Dardiotis, X. Wang, H. Axmann, A. Bergmann, and W. Schindler. 2014. Review of motor vehicle particulate emissions sampling and measurement: From smoke and filter mass to particle number. J. Aerosol Sci. 67:48–86. doi:10.1016/j.jaerosci.2013.09.003.
- Giechaskiel, B., F. Riccobono, and P. Bonnel. 2014. Feasibility study on the extension of the Real Driving Emissions (RDE) procedure to Particle Number (PN) Experimental evaluation of portable emission measurement systems (PEMS) with diffusion chargers (DCs) to measure particle number (PN) con. JRC Science and Policy Reports, 1–83.
- Giechaskiel, B., F. Riccobono, and P. Bonnel. 2015. Feasibility study on the extension of the Real Driving Emissions (RDE) procedure to Particle Number (PN), Phase II. Publications Office of the European Union, 1–83.
- Giechaskiel, B., X. Wang, H. G. Horn, J. Spielvogel, C. Gerhart, J. Southgate, L. Jing, M. Kasper, Y. Drossinos, and A. Krasenbrink. 2009. Calibration of condensation particle counters for legislated vehicle number emission measurements. Aerosol Sci. Technol. 43 (12):1164–73. doi:10.1080/02786820903242029.
- Gloor, B. 2018. Survey about functional efficiency of DPF during PTI in Zürich. ETH-Conference.
- Harris, S. J., and M. Maricq. 2001. Signature size distributions for diesel and gasoline engine exhaust particulate matter. J. Aerosol Sci. 32 (6):749–64. doi:10.1016/S0021-8502(00)00111-7.
- ICRP. 1994. Human respiratory tract model for radiological protection. ICRP Publication 66 Ann. ICRP 24 (1-3).
- ISO27981. 2015. International Standard ISO 27891:2015(E) Aerosol particle number concentration—Calibration of condensation particle counters.
- Johnson, T. J., M. Irwin, J. P. R. Symonds, J. S. Olfert, and A. Boies. 2018. Measuring aerosol size distributions with the aerodynamic aerosol classifier. Aerosol Sci. Technol. 52 (6):655–65. doi:10.1080/02786826.2018.1440063.
- Jung, H., and D. B. Kittelson. 2005. Characterization of aerosol surface instruments in transition regime. Aerosol Sci. Technol. 39 (9):902–11. doi:10.1080/02786820500295701.
- Kadijk, G., M. Elstgeest, N. E. Ligterink, and P. J. van der Mark. 2017. Investigation into a Periodic Technical Inspection (PTI) test method to check for presence and proper functioning of Diesel Particulate Filters in light-duty diesel vehicles—Part 2. Technical report, Earth, Life & Social Sciences, Den Haag.
- Kittelson, D. B. 1998. Engines and nanoparticles: A review. J. Aerosol Sci. 29 (5–6):575–88. doi:10.1016/S0021-8502(97)10037-4.
- Kulkarni, P., P. A. Baron, and K. Willeke. 2011. Aerosol measurement: Principles, techniques, and applications. 3rd ed. Hoboken, NJ: Wiley.
- Litton, C. D., L. Graybeal, and M. Hertzberg. 1979. Submicrometer particle detector and size analyzer. Rev. Sci. Instrum. 50 (7):817–23. doi:10.1063/1.1135957.
- Maricq, M. M. 2006. On the electrical charge of motor vehicle exhaust particles. J. Aerosol Sci. 37 (7):858–74. doi:10.1016/j.jaerosci.2005.08.003.
- Marra, J., M. Voetz, and H. J. Kiesling. 2010. Monitor for detecting and assessing exposure to airborne nanoparticles. J. Nanopart. Res. 12 (1):21–37. doi:10.1007/s11051-009-9695-x.
- Ministerie van Infrastructuur En Waterstaat, N. 2019. Regulation of the Minister for Environment and Housing of November 21, 2019, No. IENW/BSK-2019/202498, amending the Vehicle Regulations to enable the control of diesel particulate filters with a particle counter and to apply other technical changes. https://ec.europa.eu/growth/tools-databases/tris/en/index.cfm/search/?trisaction=search.detail&year=2019&num=328&mLang=DE.
- Mohr, M., U. Lehmann, and J. Rutter. 2005. Comparison of mass-based and non-mass-based particle measurement systems for ultra-low emissions from automotive sources. Environ. Sci. Technol. 39 (7):2229–38. doi:10.1021/es049550d.
- Nishida, R. T., T. J. Johnson, A. M. Boies, and S. Hochgreb. 2019a. Measuring aerosol active surface area by direct ultraviolet photoionization and charge capture in continuous flow. Aerosol Sci. Technol. 53 (12):1429–40. doi:10.1080/02786826.2019.1661958.
- Nishida, R. T., N. Yamasaki, M. A. Schriefl, A. M. Boies, and S. Hochgreb. 2019b. Modelling the effect of aerosol polydispersity on unipolar charging and measurement. J. Aerosol Sci. 130:10–21. doi:10.1016/j.jaerosci.2019.01.003.
- Ntziachristos, L., B. Giechaskiel, J. Ristimaki, and J. Keskinen. 2004. Use of a corona charger for the characterisation of automotive exhaust aerosol. J. Aerosol Sci. 35:943–63. doi:10.1016/j.jaerosci.2004.02.005.
- Regulation2017/1347. 2017. Commission Regulation (EU) 2017/1347.
- Reinisch, T., A. Bergmann, G. Brunnhofer, A. Mamakos, and M. Fierz. 2015. Particle Number Portable Emission Measurement System. In Aerosol Technology 2015, 122, Tampere.
- Rönkkö, T., A. Virtanen, J. Kannosto, J. Keskinen, M. Lappi, and L. Pirjola. 2007. Nucleation mode particles with a nonvolatile core in the exhaust of a heavy duty diesel vehicle. Environ. Sci. Technol. 41 (18):6384–9. doi:10.1021/es0705339.
- Schmidt-Ott, A. 1988. New approaches to in situ characterization of ultrafine agglomerates. J. Aerosol Sci. 19 (5):553–63. doi:10.1016/0021-8502(88)90207-8.
- Schriefl, M. A., A. Bergmann, and M. Fierz. 2016. Characterization and Modelling of a Novel Particle Number Detector. In European Aerosol Conference, Tours.
- Schriefl, M. A., A. Bergmann, and M. Fierz. 2018. Design principles for sensing particle number concentration and mean particle size with unipolar diffusion charging. IEEE Sensors J. 19 (4):1392–99. doi:10.1109/JSEN.2018.2880278.
- Schwelberger, M., A. Mamakos, M. Fierz, and B. Giechaskiel. 2019. Experimental assessment of an electrofilter and a tandem positive-negative corona charger for the measurement of charged nanoparticles formed in selective catalytic reduction systems. Appl. Sci. 9 (6):1051. doi:10.3390/app9061051.
- Shibata, H., S. Abe, and T. Yamaguchi. 1983. New NaCl aerosol generator. J. Aerosol Sci. 14 (3):242–248. doi:10.1016/0021-8502(83)90100-3.
- Shin, W. G., J. Wang, M. Mertler, B. Sachweh, H. Fissan, and D. Y. H. Pui. 2010. The effect of particle morphology on unipolar diffusion charging of nanoparticle agglomerates in the transition regime. J. Aerosol Sci. 41 (11):975–986. doi:10.1016/j.jaerosci.2010.07.004.
- Stabile, L., C. V. Trassierra, G. Dell’Agli, and G. Buonanno. 2013. Ultrafine particle generation through atomization technique: The influence of the solution. Aerosol Air Qual. Res. 13 (6):1667–1677. doi:10.4209/aaqr.2013.03.0085.
- Todea, A. M., S. Beckmann, H. Kaminski, and C. Asbach. 2015. Accuracy of electrical aerosol sensors measuring lung deposited surface area concentrations. J. Aerosol Sci. 89:96–109. doi:10.1016/j.jaerosci.2015.07.003.
- TSI Incorporated. 2006. Model 3776 Ultrafine Condensation Particle Counter, Operation and Service Manual.
- TSI Incorporated. 2012. Condensation Particle Counter Model 3775—Specification Sheet, P/N 2980343 Rev C.
- TSI Incorporated. 2015. Specification Sheet: Emissions Tester Model 3795, P/N 5001623 Rev D (A4).
- Wang, X., R. Caldow, G. J. Sem, N. Hama, and H. Sakurai. 2010. Evaluation of a condensation particle counter for vehicle emission measurement: Experimental procedure and effects of calibration aerosol material. J. Aerosol Sci. 41 (3):306–18. doi:10.1016/j.jaerosci.2010.01.001.
- Yamada, H. 2019. Improving methodology of particulate measurement in periodic technical inspection with high-sensitivity techniques: laser light scattering photometry and particle number method. Emiss. Control Sci. Technol. 5 (1):37–44. doi:10.1007/s40825-019-0108-z.