
Abstract
A study was conducted to compare two methods for analysis of functional groups in secondary organic aerosol (SOA) generated in the laboratory and organic aerosol collected in the Southeastern Oxidants and Aerosol Study (SOAS). Although not as widely used as molecular and elemental analysis, functional group analysis of filter samples provides chemically specific information that can be used to characterize organic aerosol sources, mechanisms of formation, and physical-chemical properties. Here, we compared measurements made using Fourier Transform Infrared (FTIR) spectroscopy, the most widely used method of functional group analysis, with those made using derivatization-spectrophotometric methods. When used to analyze SOA generated from a series of environmental chamber reactions, the methods agreed quite well when results were assigned to four groups: (1) functional groups that contain an O–H bond; (2) non-acid functional groups containing a C = O moiety; (3) organonitrate groups; and (4) alkane groups. Overall, the agreement between the two methods indicates that either is adequate for measuring the functional group composition of SOA. While the derivitization-spectrophotometric methods offer more specificity, they also require more time and aerosol mass for sample analysis than the FTIR methods. It was also shown that functional group signatures obtained from SOA generated in environmental chambers can potentially be used to gain insight into oxidation and particle-phase reactions responsible for SOA formation in field samples.
Copyright © 2021 American Association for Aerosol Research
EDITOR:
Introduction
Atmospheric aerosols are derived from natural and anthropogenic sources and are known to impact human and ecosystem health, visibility, and climate (Pöschl Citation2005). Whereas primary aerosols are directly emitted from processes such as combustion, or as wind-blown dust or sea spray (Jacobson et al. Citation2000), secondary aerosols are formed in the atmosphere through the photo-oxidation of volatile organic compounds (VOCs) and nitrogen and sulfur oxides (Ziemann and Atkinson Citation2012). Biogenic VOCs (BVOCs) are the most abundant class of VOCs emitted into the atmosphere, with isoprene and monoterpenes accounting for ∼70% of global emissions (Guenther et al. Citation2012). BVOCs are dominant precursors of secondary organic aerosol (SOA) formation, due to their large emissions and high reactivity with atmospheric oxidants (Atkinson and Arey Citation2003; Hallquist et al. Citation2009). These reactions lead to the formation of products with a large variety of functional groups, such as carboxyl, hydroxyl, ketone, aldehyde, ester, organonitrate, and peroxide, all of which reduce compound vapor pressure and thus enhance gas-to-particle partitioning (Kroll and Seinfeld Citation2008; Ziemann and Atkinson Citation2012). The specific functional groups formed depend primarily on the BVOC structure, oxidant (OH radical, NO3 radical, or O3), and NOx concentrations, which influence the fate of organic peroxy radicals that are key intermediates in oxidation reactions. Whereas water can play a minor role in gas-phase reactions (primarily by reacting with Criegee intermediates formed from alkene ozonolysis), water along with sulfuric and nitric acid can participate in organic particle-phase reactions that can form or hydrolyze oligomers, thus altering functional group composition. Understanding the factors that influence the formation of SOA from BVOCs, such as oxidation regime, humidity, particle acidity, temperature, and interactions with anthropogenic emissions of nitrogen and sulfur oxides, is vital to understanding how current and future regulations will impact regional and global air quality (Ziemann and Atkinson Citation2012; Orlando and Tyndall Citation2012).
Measurements of organic aerosol composition have most often been made using online or offline mass spectrometry (Hallquist et al. Citation2009; Hoffmann, Huang, and Kalberer Citation2011). The chemical information obtained varies widely in specificity, ranging from molecular characterization (typically involving component separation by gas or liquid chromatography or temperature-programmed thermal desorption) to quantifying bulk aerosol properties like O/C ratios. While characterization of individual aerosol compounds is valuable, it is time consuming and rarely comprehensive due to sample complexity. An alternative approach is to characterize organic aerosol by functional groups, which yields chemical detail between molecular identification and elemental ratios. The benefit of such analysis is that measurements are specific enough to allow inferences to be made about the chemistry by which the aerosol was formed as well as the environmental conditions (Russell, Bahadur, and Ziemann Citation2011).
The most commonly used method for quantifying the functional group composition of SOA is Fourier Transform Infrared (FTIR) spectroscopy, which has been developed and employed for field applications primarily by the Russell, Dillner, and Takahama groups (Maria et al. Citation2002; Coury and Dillner Citation2007, Citation2009; Russell, Bahadur Citation2009; Takahama, Johnson, and Russell Citation2013; Reggente, Dillner, and Takahama Citation2019; Takahama et al. Citation2019). More recently, the Ziemann group at the University of Colorado, Boulder (CU) has developed an alternative approach that employs derivatization-spectrophotometry (Deriv-Spec) (Aimanant and Ziemann Citation2013a; Ranney and Ziemann Citation2016a) and applied it in a number of laboratory studies where functional group analysis has compared well with and complemented chromatographic and mass spectrometric analysis of molecular composition (Aimanant and Ziemann Citation2013b; Algrim and Ziemann Citation2016; Claflin and Ziemann Citation2018; Claflin et al. Citation2018; Pagonis and Ziemann Citation2018). Each of these methods have benefits and draw-backs, but both aim to characterize SOA by quantifying functional groups (though not all the same ones) commonly present in atmospheric aerosol.
The FTIR method employed here by the Russell group at the Scripps Institution of Oceanography (SIO) determines the aerosol functional group composition from the FTIR absorption spectrum (measured directly by transmission) of filter samples. The spectrum is used to quantify groups classified as acid-carbonyl, non-acid carbonyl, alcohol, organonitrate, organosulfate, amine, and alkane. While this technique provides relative ease of sampling, automated analysis, and the ability to work with small amounts of aerosol mass (∼10 μg), all of which are critical for field studies, identification and quantification can be impacted by overlapping absorbance by some functional groups and by differences in the location and absorptivity of the same group in different molecules. The method also does not distinguish between certain structural components that are common to some functional groups, such as C(O) in carboxyl, ketone, aldehyde, and ester groups; and –OH in alcohol and hydroperoxide groups.
The Deriv-Spec methods quantify groups classified as carboxyl, carbonyl (ketone/aldehyde), ester, hydroxyl, peroxide, and organonitrate, and then methylene groups are quantified by difference compared to total mass. The methods are specific for each functional group because of the use of derivatizing agents, targeted iodometric reactions, and characteristic wavelengths for detection, and the methods have been developed to avoid potential interferences (Aimanant and Ziemann Citation2013a). We note that in previous studies employing the Deriv-Spec methods we referred to the measurement of C(O) as carbonyl, meaning ketones and aldehydes but not esters or carboxylic acids. Here we make that more explicit by using the term ketone/aldehyde when referring to results of Deriv-Spec analyses. Compared to the FTIR method, Deriv-Spec analyses require more time (typically ∼15 h, but for practical reasons these are often spread out over the course of a few days) for complete sample analysis, and more aerosol mass (∼50 μg compared to ∼10 ug).
In the study presented here, the SIO FTIR and CU Deriv-Spec methods for quantifying the functional group composition of SOA are compared using aerosol formed in environmental chamber experiments and ambient samples collected during the Southern Oxidant and Aerosol Study (SOAS). In addition, the results of the environmental chamber experiments were used to aid in the identification of possible sources, environmental conditions, and processes involved in the formation of the SOA collected during SOAS. The SOAS campaign took place during the summer of 2013 in the Southeast US, an environment dominated by isoprene and monoterpene emissions (Carlton et al. Citation2018). An overarching goal was to identify and quantify the effects of anthropogenic inorganic and organic emissions on SOA formed from BVOCs. In this regard, observations made during the campaign indicated the presence of organonitrates in SOA (Xu et al. Citation2015a; Ayres et al. Citation2015; Lee et al. Citation2015; Xu et al. Citation2015b; Massoli et al. Citation2018) and an impact of sulfate on SOA formation (Xu et al. Citation2015a; Xu et al. Citation2015b; Liu et al. Citation2017; Rattanavaraha et al. Citation2016), with Xu et al. (Citation2015b) estimating that the formation of 43–70% of the total organic aerosol in the Southeast US was mediated by the presence of anthropogenic sulfate and NOx. Several studies reported correlations between isoprene SOA formed through IEPOX pathways and the presence of particulate sulfate. Liu et al. (Citation2017) reported evidence of selective uptake of isoprene SOA onto sulfate particles, indicative of heterogeneous reactions, and it was shown that the formation of isoprene SOA was directly mediated by the abundance of sulfate, not by the aerosol water content or particle acidity (Xu et al. Citation2015a; Xu et al. Citation2015b). This was presumably because the aerosol was so acidic (pH < 2) and the air so humid, that these were not limiting factors during the campaign. Furthermore, it was reported that organonitrates accounted for 5–12% of the total organic aerosol (Xu et al. Citation2015a), and that organonitrates formed from the reaction of monoterpenes with NO3 radicals accounted for 50% of the total nighttime SOA (Xu et al. Citation2015b). Because the ambient samples analyzed in the present study were collected during SOAS, the chamber experiments were designed to target the VOCs, oxidation regimes, humidity, and particle acidity observed during the campaign.
Experimental
Chemicals
The following chemicals with purities/grades and suppliers were used for the chamber experiments and subsequent filter extraction: pentadecane (99%), (-)-α-pinene (99%), (1 s)-(-)-β-pinene (99%), (R)-(+)-limonene (97%), camphene (95%), isoprene (99%), cyclohexane (99%, ACS grade), (Sigma-Aldrich); (NH4)2SO4 (99.5%, ACS grade), H2SO4 (ACS grade), H2O2 (30% in water) (Fisher); ethyl acetate (99.5%, ACS grade) (EMD Millipore); methanol (HPLC grade) (Honeywell); NO (CP grade, 99%) (Matheson); 18 MΩ water purified using Milli-Q Advantage A10 water system. O3 was generated using a BMT 802 N O3 generator with ultra-high purity (UHP) O2 (Airgas). N2O5 was synthesized according to the procedures of Atkinson et al. (Citation1984) and was stored in a glass vacuum bulb in dry ice until used. Methyl nitrite (CH3ONO) was synthesized (Taylor et al. Citation1980) and stored in a lecture bottle at room temperature until used. Chemicals used for the Deriv-Spec functional group analyses are too numerous to list here, but with the exception of the following chemicals used in this study for the hydroxyl analysis they have been reported previously (Docherty et al. Citation2005; Aimanant and Ziemann Citation2013a; Ranney and Ziemann Citation2016a): 2 M trimethylsilydiazomethane in diethyl ether, toluene (99.8%), 3,5-dinitrobenzoyl chloride (98%), pyridine (99.5%) (Sigma-Aldrich); acetonitrile (HPLC grade, ACS grade), NaHCO3 (ACS grade), water (HPLC grade), HCl (ACS grade), NaCl (ACS grade) (Fisher); dichloromethane (ACS grade) (EMD Millipore). Chemicals used as standards for the Deriv-Spec analyses were: tridecanoic acid (98%), 1,2-tetradecanediol (90%), benzoyl peroxide (98%), ethyl hexyl nitrate (97%) (Sigma-Aldrich); bis(2-ethylhexyl) sebecate (97%) (Fluka); 3-hexadecanone (99%) (ChemSampCo).
Environmental chamber experiments
The following observations made during the SOAS campaign were used as a guide in selecting the conditions for the experiments: (1) the dominant VOCs were isoprene, α-pinene, β-pinene, and limonene (Kaiser et al. Citation2016; Xu et al. Citation2015b); (2) VOC reactions with OH radicals, O3, and NO3 radicals were all important (Massoli et al. Citation2018; Xu et al. Citation2015b); (3) the relative humidity ranged from ∼35–100% (Xu et al. Citation2015b); and (4) the average aerosol pH was ∼1 (Guo et al. Citation2015). As shown in , our experiments were conducted with the major SOAS VOCs and oxidants under low- and high-NOx conditions, in dry air (RH < 1%) and at a typical SOAS humidity (50% RH), and without and with deliquesced ammonium sulfate seed particles (in one case with added sulfuric acid) with a typical SOAS pH∼1 (as indicated by E-AIM (http://www.aim.env.uea.ac.uk/aim/aim.php; Clegg, Brimblecombe, and Wexler Citation1998; Wexler and Clegg Citation2002) calculations. The low pH of these particles is due to the evaporation of ammonia from the ammonium sulfate seed particles to the gas phase, though in the OH/NOx experiments conducted in the absence of seed particles SOA also contained HNO3 formed by the OH + NO2 reaction (Lim and Ziemann Citation2009; Ranney and Ziemann Citation2016b).
Table 1. Experiments and conditions used to form SOA for analysis of functional group composition using the Deriv-Spec and FTIR methods.
In each experiment, SOA was formed in an ∼7 m3 environmental Teflon FEP chamber filled with clean, dry air supplied by two AADCO Model 737-14 A clean air generators (<5 ppb hydrocarbons, <0.1% RH) at room temperature (∼23oC) and pressure (∼630 Torr). Experiments 1, 3, and 5 were conducted under dry conditions (<1% RH) without seed aerosol. Experiments 2, 4, and 6–9 were conducted under humid conditions (50% RH) by evaporating water into the chamber from a heated glass bulb in a stream of ultra-high purity (UHP) N2. Ammonium sulfate particles formed with a Collison atomizer were then flushed into the humidified chamber to obtain a concentration of ∼200 μg m-3 of deliquesced seed particles, and in experiment 9 the ammonium sulfate solution was doped with sulfuric acid. For all experiments the VOC of interest was added to the chamber from a heated glass bulb into a flow of UHP N2 to achieve the desired concentration in the chamber. And for experiment 1 (O3 oxidation) 1200 ppm of cyclohexane was also added to the chamber, sufficient to scavenge >99% of the OH radicals formed during the reaction (Docherty et al. Citation2005). Finally, O3, H2O2, CH3ONO/NO, or N2O5 was added to the chamber by a similar method to the VOC with only the H2O2 requiring mild heating. A Teflon-coated fan was run for 30 s after adding each component to ensure a well-mixed chamber. The O3 or NO3 radicals (formed by thermal decomposition of N2O5 at room temperature to NO3 + NO2) reacted immediately with the VOC, whereas photolysis of H2O2 or the CH3ONO/NO mixture by blacklights that cover two walls of the chamber formed OH radicals under low or high NOx conditions, respectively.
Gas analysis
Ozone concentrations were monitored using a Thermo Scientific 49i O3 monitor, NOx concentrations were monitored using a Thermo Scientific Model 42 C NO-NO2-NOx Analyzer, and humidity was monitored using a Vaisala HMP110 RH probe. The concentration of parent VOC was measured before and after reaction by collecting samples onto Tenax adsorbent for gas chromatography-flame ionization detection (GC-FID) analysis. Chamber air was first drawn through a 30 cm stainless steel sampling line for 20 min at 250 cm3 min–1 to passivate the walls of the tube (Deming et al. Citation2019), and then through an attached Tenax cartridge at the same flow rate for 4 min, with samples taken 30 and 90 min before and after the reaction. Tenax cartridges were inserted into an Agilent 6890 GC and compounds were thermally desorbed onto a 30 m × 0.32 mm Agilent DB-1701 column with 1 μm film thickness by ramping the inlet to 250ºC in 7 min while the column was held at 40ºC. The column temperature was then ramped at 10ºC min–1 to 280ºC and eluted compounds were quantified with the FID.
Particle analysis
After each reaction four SOA samples were collected, two for the Deriv-Spec analyses and two for the FTIR analysis. The two replicate CU samples were collected onto pre-weighed filters (Millipore Fluoropore PTFE, 0.45 μm) for 120 min at a flow rate of 14 L min–1. The filters were reweighed after sampling to determine the mass of SOA collected. Filters were weighed using a Mettler Toledo XS3DU Microbalance. Filter samples were separately extracted into 10 mL of ethyl acetate, the extracts were combined in a pre-weighed vial and dried in a stream of UHP N2, and the vial was reweighed to determine the extracted SOA mass. Comparison of collected and extracted mass indicated ∼100% extraction efficiency. Dried SOA was reconstituted in ethyl acetate to achieve a concentration of 1 mg mL–1 for Deriv-Spec analysis and stored at −20ºC between analyses. The two SIO samples were collected onto 37 mm stretched Teflon filters for 5 min at a flow rate of 12 L min–1, immediately sealed in a container, and stored at −20ºC until mailed to SIO for FTIR analysis.
Deriv-Spec analysis of chamber samples
The functional group composition of chamber SOA was quantified using the macro-methods we developed previously (Docherty et al. Citation2005; Aimanant and Ziemann Citation2013a). Briefly, these methods measure carboxyl, ketone/aldehyde, ester, and hydroxyl groups by converting them to UV-Vis absorbing forms by derivatizing with 2-NPH.HCl, 2,4-DNPH, hydroxamic acid, and 4-NBC, respectively; peroxides (hydroperoxides, dialkyl and diacyl peroxides, peroxy acids, and peroxynitrates) are reacted with I– to form an absorbing I3– solution; and organonitrate groups are directly quantified using their characteristic strong absorbance at 210 nm. The remaining sample mass is then attributed to methylene groups. Surrogate standards used for carboxyl, ketone/aldehyde, ester, hydroxyl, peroxide, and organonitrate groups were tridecanoic acid, 3-hexadecanone, bis(2-ethylhexyl) sebecate, 1,2-tetradecanediol, benzoyl peroxide, and 2-ethylhexyl nitrate, respectively. Absorbance was measured using an Ocean Optics USB4000-UV-Vis Miniature Fiber Optic spectrophotometer with a 1 cm quartz cell, and for each analysis a five-point calibration curve, a standard blank, a filter blank, and two duplicate SOA samples were analyzed.
FTIR analysis of chamber samples
Filters were analyzed in a clean room before and after chamber sampling using a Bruker Tensor 27 FTIR spectrometer with a deuterated triglycine sulfate (DTGS) detector following equilibration to a temperature of 20 °C and an RH controlled to 50% (within ∼5%). At this RH, likely below the deliquescence RH (typically >60%, Brooks et al. [Citation2002]) and above the efflorescence RH (∼35%, Gao, Chen, and Yu [Citation2006]), the amount of water the particles should contain depends on whether they are on the wetting branch or drying branch. Since the samples were stored, dried and frozen before equilibration in the cleanroom, the wetting branch is expected. On this branch, SOA hygroscopic growth factors will be very close to zero (Prenni et al. Citation2007). Under these conditions no evidence for water vapor or hydrates was observed in any of the spectra sampled in this project. An automated algorithm was used to quantify the mass of organic functional groups (Russell, Bahadur Citation2009; Takahama, Johnson, and Russell Citation2013). In short, FTIR spectroscopy quantifies organic functional groups by their absorbance, which is associated with the frequency of particular bonds within the molecule. An algorithm is then used to quantify the mass of each functional group, which is then summed to get a total SOA mass, and then mass fractions are calculated by dividing the mass of each functional group category by the total mass. The types of functional groups quantified with the FTIR technique reported here are normally classified as follows: acid-carbonyl (absorbance of C–OH also associated with C = O from carboxyl groups O = C–OH), non-acid carbonyl (C = O group contribution from non-speciated aldehydes, ketones, and esters), alcohol (C–OH), organonitrate (R–ONO2), and alkane (saturated aliphatic CH2) groups. As noted above, the FTIR method can also quantify organosulfates; however, for the work presented here this group was not included.
Collection of field samples
During the SOAS field campaign, samples of ambient aerosol were collected onto pre-scanned Teflon filters (Teflon, Pall Life Science Inc., 37 mm diameter, 1.0 μm pore size) at the Centerville, AL (CTR) and Look Rock, TN (LRK) field sites. Samples were frozen and transported to the SIO laboratory for FTIR analysis of individual filters and then re-frozen and sent to CU, where they were stored at −20°C for about four years prior to Deriv-Spec analysis. Whereas this may seem like a long period of time, we have stored hundreds of monofunctional and multifunctional standards containing carboxyl, ketone, aldehyde, alcohol, and organonitrate groups for decades under these conditions without observing detectable degradation when analyzed by various types of chromatography and mass spectrometry. Although many types of peroxides are also stable under these storage conditions, because of concerns regarding possible decomposition during the brief exposure of filters to ambient temperatures between the field site and CU, peroxide analyses were not performed. In general, the low temperature and humidity during storage greatly reduces reaction rates, which are also limited by slow rates of diffusion in organic aerosol particles under these conditions (estimated particle mixing timescales of ∼1 yr or more, Reid et al. Citation2018), and the containers were well sealed to prevent reactions with oxygen. It therefore seems unlikely that significant changes in composition occurred during storage. The field samples were pooled and placed into four categories: (1) combined daytime and nighttime samples from LRK during low-NOx conditions; (2) combined daytime and nighttime samples from LRK during high-NOx conditions; (3) nighttime samples from CTR during low-NOx conditions; and (4) daytime samples from CTR during high-NOx conditions. Each category contained between three and seven filter samples, and were chosen to provide enough mass for all CU analyses once the samples were pooled, and to provide samples from both high- and low-NOx conditions at both field sites.
Deriv-Spec analysis of field samples
Filters were separately extracted into 8 mL of ethyl acetate, extracts for each of the four categories above were combined in a pre-weighed vial, dried in a stream of UHP N2, and then reweighed to obtain the mass of aerosol extracted. To ensure that all organic mass was extracted, each pool of filters was placed in 20 mL of methanol and sonicated for 30 min. This extract was transferred to a pre-weighed vial, dried in a stream of UHP N2, and reweighed to obtain the mass extracted. Filter blanks for each pooled sample were extracted using the same methods. In addition, because the Deriv-Spec analyses use UV-Vis absorbance measurements for quantification, the presence of inorganic components and black carbon in field samples present potential interferences. In particular, during methanol extraction inorganic components that did not dissolve during ethyl acetate extraction could dissolve during sonication. To test for this artifact, each sample category and its associated blank for both extraction methods were reconstituted in ethyl acetate and its UV-Vis spectrum was measured using an IMPLEN NanoPhotometer NP80. The similarity of the spectra obtained from the two extraction methods indicated that this artifact was negligible. To obtain as much mass as possible for the Deriv-Spec analyses, the extracts from both the ethyl acetate and methanol extractions were combined for each of the four categories into a pre-weighed vial. The samples were again dried in a stream of UHP N2 and reweighed to obtain a final mass of aerosol sample, and then reconstituted into ethyl acetate to obtain a 1 μg μL–1 solution for the subsequent functional group analyses.
The functional group composition of each of the four field sample groups was quantified using our micro-methods (Ranney and Ziemann Citation2016a), which are similar to the macro-methods described above for the chamber sample analyses. Although the micro-methods were developed to measure carboxyl, ketone/aldehyde, ester, hydroxyl, peroxide, and organonitrate groups, not all were used for the field samples. The method for measuring organonitrate groups was not used because it does not include a derivatization reaction that leads to high specificity, and instead quantifies organonitrate groups through the absorbance at 210 nm. While this approach works well for laboratory aerosol (Matsunaga and Ziemann Citation2009), ambient samples have absorbance from species such as aromatics that can confound this method. Peroxide analysis was also not attempted because it was expected that peroxides had probably decomposed during storage (Krapf et al. Citation2016; Pagonis and Ziemann Citation2018) and limited sample mass was available. One other note about the CU field sample analysis is that the micro-method for hydroxyl quantification was slightly modified from the procedure previously reported (Ranney and Ziemann Citation2016a) to avoid interferences that can occur with that method. The modified method is described in Supplemental Information (SI).
To summarize, the field samples were quantified for their carboxyl, ketone/aldehyde, and ester content using the Deriv-Spec micro-methods and the hydroxyl content was quantified using the modified procedure described in SI. Surrogate standards used for ketone/aldehyde, carboxyl, ester, and hydroxyl groups were 3-hexadecanone, tridecanoic acid, bis(2-ethylhexyl) sebecate, and 1,2-tetradecanediol, respectively. For each analysis absorbance was measured for a 2 µL drop using an IMPLEN NanoPhotometer NP80, and a five-point calibration curve, a standard blank, a filter blank, and duplicate SOA samples (two from each of the four sample categories) were analyzed.
FTIR analysis of field samples
The filters were scanned and spectral peaks integrated and quantified following the same procedure used for the chamber samples described above (Russell, Bahadur Citation2009; Takahama, Johnson, and Russell Citation2013). The field samples were quantified by FTIR for the functional groups listed above for the chamber samples (alkane, non-acid carbonyl, acid-carbonyl, and alcohol groups) and for the contribution from primary amines (CNH2). Because the measurements found that organonitrate groups were below the limit of quantification at both sites they were excluded (Liu et al. Citation2018).
Description of reported functional group composition and properties of SOA
The functional group composition of laboratory-generated SOA measured with the Deriv-Spec methods is normally reported as the average number of each measured functional group per parent VOC molecule (Aimanant and Ziemann Citation2013a), assuming that the SOA only contained peroxide [CHOOH], ester [C(O)O], ketone/aldehyde [C(O)], carboxyl [C(O)OH], hydroxyl [CHOH], organonitrate [CHONO2] and methylene [CH2] groups. This composition is determined by summing the masses of measured functional groups, calculated as the measured moles × molecular weight (g mol–1) of each group: peroxide = 46, ester = 44, ketone/aldehyde = 28, carboxyl = 45, hydroxyl = 30, organonitrate = 75. The moles of methylene groups are then obtained by subtracting this sum from the measured SOA mass and dividing by the molecular weight of the methylene group, 14 g mol–1. Molar concentrations of functional groups in the SOA are used to calculate mole fractions, which are then multiplied by the carbon number of the parent VOC to obtain the number of functional groups per molecule in the SOA. These values can also be used to calculate the average O/C, H/C, and N/C ratios, molecular weight, density (using the O/C, H/C, and N/C ratios and the equation of Kuwata, Zorn, and Martin (Citation2012) by assuming that an N atom contributed the same to the density as an O atom), and saturation concentration of the SOA, with the latter calculation employing SIMPOL.1 (Pankow and Asher Citation2008) to estimate effects of functional groups on compound vapor pressure. This description of the composition and properties of the SOA can be especially valuable when one is interested in using the stoichiometry of SOA-forming reactions for interpreting or modeling SOA composition or when comparing with other analyses (such as elemental composition determined by mass spectrometry), and so is reported in Tables S1 and S2. But because analyses of aerosol functional group composition (including those made using the SIO FTIR method) of field samples are reported as mass fractions, the Deriv-Spec results are reported in those units in Figures S1 and . This was done by multiplying the moles of each functional group in the aerosol sample by the molecular weight of each functional group and then dividing by the total mass.
Figure 1. Functional group composition of SOA formed in environmental chamber experiments designed to mimic daytime reaction conditions observed during the SOAS field campaign and analyzed using the Deriv-Spec (CU) and FTIR (SIO) methods. These correspond to experiments 1–4 in .
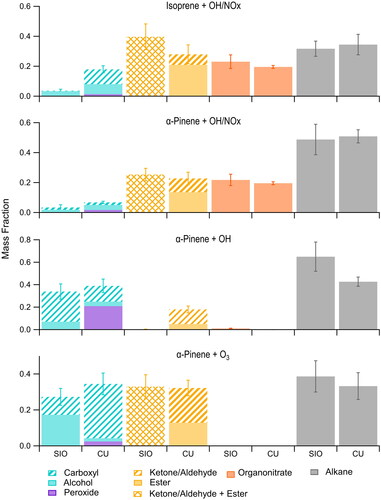
The error bars shown in and represent the uncertainties in the reported mass fractions. For the Deriv-Spec measurements, the uncertainties are as follows: (+/–) 10%, 30%, 10%, 20%, 20%, and 5% for peroxide, ester, ketone/aldehyde, carboxyl, hydroxyl, and organonitrate groups (Aimanant and Ziemann Citation2013a; Banerjee and Budke Citation1964; Claflin and Ziemann Citation2018). The uncertainty in the Deriv-Spec alkane measurement was calculated as a propagation of the errors associated with the directly measured functional groups listed above. For the FTIR measurements, the uncertainties for all functional groups and limits of detection (LOD) for alcohol, acid, alkane, amine, and carbonyl groups were calculated as in Russell (Citation2003) and Russell, Takahama (Citation2009) and the LOD of organonitrate is from Day et al. (Citation2010). The error bars for the FTIR measurements in are root mean-square errors calculated from the uncertainties for each of the filters in the pooled samples.
Results and discussion
In the following discussion we compare the results of the FTIR and Deriv-Spec analyses of SOA formed in the environmental chamber experiments and of aerosol collected during the SOAS field campaign. Because the Deriv-Spec methods are usually able to quantify functional groups with greater specificity and accuracy, results obtained with those methods are generally treated here as a “reference” for the purposes of comparison. It is important to note, however, that because the Deriv-Spec methods involve filter extraction and derivatization reactions while the FTIR filter analysis is conducted in situ, in some cases discrepancies may be due to these differences. Fortunately, the potential effects of this sample processing on reported functional group composition are reasonably well understood, and so will be included in the discussion.
Comparison of methods: Environmental chamber studies
Results of FTIR and Deriv-Spec functional group analysis of SOA formed in environmental chamber reactions of pentadecane, isoprene, α-pinene, β-pinene, and limonene with O3, OH, OH/NOx, or NO3 radicals are reported in as mass fractions using a common classification scheme that employs terms selected from among those normally used to classify the functional group composition measured with the two methods. The scheme is as follows, where the terms normally used are given in parentheses (FTIR:Deriv-Spec): carboxyl (acid carbonyl:carboxyl), ketone/aldehyde (non-acid carbonyl:ketone/aldehyde), ester (non-acid carbonyl:ester), alcohol (alcohol:hydroxyl), peroxide (NA:peroxide), organonitrate (organonitrate:organonitrate), amine (amine:NA), and alkane (alkane:methylene). We note that one source of uncertainty in this scheme is that peroxides detected with the Deriv-Spec methods can be either hydroperoxides [ROOH], peroxyhemiacetals [R1OOCH(OH)R2], or dialkyl peroxides [R1OOR2]. None of these are normally reported from FTIR analysis, although hydroperoxides and peroxyhemiacetals (which are also alcohols) will be detected as alcohols because of RO–OH and C–OH bond absorption (Shreve et al. Citation1951). Because peroxides were only detected in a significant amount in SOA formed in one environmental chamber experiment, and the analysis was not performed on field samples because of expected decomposition during transport and storage and limited available sample mass, we’ve chosen not to attempt to modify this scheme and instead include these issues when discussing the peroxide-containing SOA sample. A comparison of the results obtained using this scheme suggests that the measurements be assigned to four groups defined as follows. Group 1 is functional groups that have an O–H bond (for the FTIR method this is carboxyl (acid carbonyl) + alcohol groups, and would also include hydroperoxide groups in the α-pinene + OH SOA), and for the Deriv-Spec methods this is carboxyl + alcohol + peroxide groups). Group 2 is non-acid functional groups that have a C = O moiety (for the FTIR method this includes the non-acid carbonyl groups calculated as the difference between mass of carbonyl C = O and mass of C = O associated with carboxyl C–OH, and for the Deriv-Spec methods this is ketone/aldehyde + ester groups). Group 3 is the organonitrate group, which is a direct comparison between the FTIR and Deriv-Spec measurements of this group. Group 4 is the alkane group, which is a direct comparison between the FTIR alkane and Deriv-Spec methylene measurements. These groupings are shown in , , and for the different types of SOA as carboxyl + alcohol + peroxide (Group 1), ketone/aldehyde + ester (Group 2), organonitrate (Group 3), and alkane (Group 4).
Figure 2. Functional group composition of SOA formed in environmental chamber experiments designed to mimic nighttime reaction conditions observed during the SOAS field campaign and analyzed using the Deriv-Spec (CU) and FTIR (SIO) methods. These correspond to experiments 6–9 in . Note that reactions with O3 (experiment 1, ) can also occur at night.
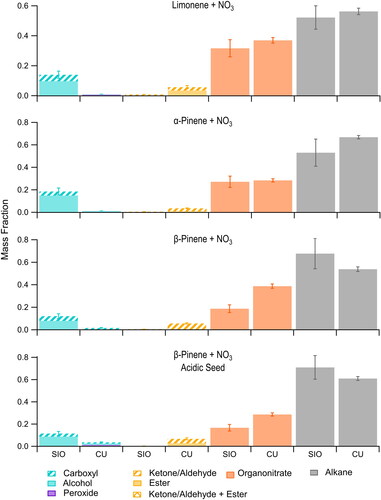
Most of the results shown in for the two methods are within measurement uncertainties (as indicated by the degree of overlap of error bars) when the results are grouped in this way, but there are two cases for which the results are consistently outside measurement uncertainties. One is that the contribution from Group 1 to SOA formed from the reactions of monoterpenes + NO3 radicals () is always larger in the FTIR analysis. This may be due to the incomplete removal of the absorbance from the ammonium sulfate seed present in the aerosol in the algorithm used for peak fitting (Russell, Takahama Citation2009). The overlap of N–H bonds with the C–OH stretching region is accounted for by subtracting the maximum possible N—H double-peak from the spectrum before fitting the C-OH, which theoretically should be an over-correction. However, minor shifts in the peak shape due to mixtures in particles could increase the uncertainty in this correction. We do not think that the Deriv-Spec analyses might instead be biased low, since the conditions employed during the analysis of alcohols do not lead to reactions that might alter the structures of SOA components (Aimanant and Ziemann Citation2013a, Citation2013b, Claflin and Ziemann Citation2018, and Claflin et al. Citation2018). Furthermore, in a previous study that employed liquid chromatography, mass spectrometry, attenuated total reflectance-FTIR and Deriv-Spec analysis, we showed that the low alcohol content of the SOA produced from the β-pinene + NO3 radical reaction is due to the formation of acetals via particle-phase reactions (Claflin and Ziemann Citation2018). In these reactions multifunctional monomers containing alcohol and ketone groups (as well as organonitrate groups) cyclize to form hemiacetals, which then react with each other or with other alcohols through a dehydration reaction to form acetals. The reactions result in the loss of two alcohol groups for every acetal formed. The other discrepancy is that the contribution from Group 2 to SOA formed from the reactions of pentadecane + OH/NOx (), α-pinene + OH (), and monoterpenes + NO3 radicals () is larger than in the FTIR analyses. This could be due to uncertainties in the empirical fitting and scaling of the carboxylic OH region in the FTIR analyses (Takahama, Johnson, and Russell Citation2013), especially for α-pinene + OH (), where the higher amount of carboxyl could be enough to account for the missing Group 2. For the pentadecane + OH/NOx () and the nighttime reactions (), there is insufficient Group 2 even if 1 is mis-apportioned, suggesting that in these cases the discrepancy may be more likely attributed to differences in sample processing since the acidic conditions employed in Deriv-Spec analysis hydrolyze hemiacetals, peroxyhemiacetals, and acetals that are major components of the SOA to form monomers containing ketone/aldehyde groups (Aimanant and Ziemann Citation2013a, Citation2013b; Pagonis and Ziemann Citation2018; Claflin and Ziemann Citation2018), whereas in FTIR analysis only the intact forms that do not have ketone/aldehyde groups are detected. It is clear from this that the effects of sample processing on results of Deriv-Spec analyses must be kept in mind when comparing results obtained with the two methods.
Environmental chamber studies: Criteria for distinguishing SOA sources
A number of valuable observations were made by comparing the measured functional group composition of the SOA generated in the terpene oxidation reactions shown in and , which we use to propose criteria for distinguishing SOA sources. The experiments were designed to form SOA from reactions of the major terpene emissions at SOAS (isoprene and the monoterpenes α-pinene, β-pinene, and limonene) with the major daytime (OH radicals and O3) and nighttime (NO3 radicals) oxidants. Although alkanes were not expected to be a significant source of SOA during the SOAS campaign, the reaction of pentadecane with OH/NOx was also included as a useful comparison since our previous studies (Lim and Ziemann Citation2009, Aimanant and Ziemann Citation2013a) have shown via molecular and Deriv-Spec analysis that the SOA contains all the functional groups of primary interest here: carboxyl, ketone/aldehyde, ester, alcohol, organonitrate, and alkane. As seen in , the FTIR and Deriv-Spec methods measure roughly similar amounts of Groups 1, 3, and 4; and the Deriv-Spec methods measure larger contributions of Group 2 for the reasons discussed above. We note that these same functional groups have also been observed here () and in the molecular analysis of SOA formed from the reactions of OH radicals with isoprene (Surratt et al. Citation2006) and O3 and OH radicals with α-pinene (Yu et al. Citation1999; Eddingsaas et al. Citation2012).
The criteria proposed from these experiments are as follows: (1) SOA formed from reactions of isoprene and monoterpenes (α-pinene) with OH/NOx and the three monoterpenes with NO3 radicals always have a large contribution from Group 3. This is expected in both cases since under high-NOx conditions organic peroxy radicals formed in the reaction can react with NO to form organonitrates (and alkoxy radicals), and reactions of monoterpenes with NO3 radicals begin by addition of the NO3 radical to the C = C double bond to form an organonitrate group that is maintained in most of the subsequent reaction products. It thus appears that the organonitrate groups formed in these reactions are mostly a mixture of primary and secondary organonitrates, since it has been shown that tertiary organonitrates hydrolyze on timescales relevant to these chamber reactions and sample processing (Hu, Darer, and Elrod Citation2011; Jacobs, Burke, and Elrod Citation2014). (2) The SOA formed from the reaction of monoterpenes with NO3 radicals has only a small contribution from Group 2, with the ketone/aldehyde groups measured with the Deriv-Spec methods being attributed to hydrolysis of acetals; and a small contribution from Group 1, with those measured by FTIR being attributed to algorithm uncertainties associated with the ammonium sulfate seed particles rather than SOA. Conversely, the SOA formed from the reactions of isoprene or a monoterpene (α-pinene) with OH/NOx has significant contributions from Group 2 as well as smaller contributions from Group 1. This difference in SOA composition might make it possible to distinguish contributions to SOA from daytime OH/NOx reactions and nighttime NO3 reactions. (3) The SOA formed from the reaction of isoprene with OH/NOx contains similar contributions from Groups 4 and 3 (ratio ∼1), whereas SOA formed from the reaction of a monoterpene (α-pinene) with OH/NOx has a significantly larger contribution from Group 4 compared to Group 3 (ratio ∼2). This is apparently due to the fact that isoprene has 5 alkane groups and monoterpenes have 10, and also that isoprene has two highly reactive C = C double bonds while most of the major monoterpenes (including α-pinene) have one. The ratio of Group 4 to Group 3 in SOA formed from the reaction of isoprene or a monoterpene with OH/NOx (as determined by meeting Criteria 2) might therefore be used to distinguish isoprene and monoterpenes as SOA sources in high-NOx areas. (4) SOA formed from the reaction of a monoterpene (α-pinene) with OH radicals or O3 in the absence of NOx, systems that are considered to be important ambient daytime SOA sources, typically contain significant contributions from Groups 1 and 2 and no contribution from Group 3 since there is no NOx or NO3 radicals present.
As will be discussed below, the results of the functional groups analyses of SOA formed in the environmental chamber experiments can be used to help interpret the SOAS field samples that were also analyzed by the CU and SIO methods.
Comparison of SOAS field samples
Four groups of field samples from the SOAS campaign were analyzed by the FTIR and Deriv-Spec methods. Each sample group contained several filter samples that were collected under similar atmospheric conditions and analyzed individually by the FTIR methods and as a pooled single sample extract by the Deriv-Spec methods. As discussed above, the four field sample groups, two from the Centerville, AL (CTR) site and two from the Look Rock, TN (LRK) site, were (1) combined daytime and nighttime samples from LRK during low-NOx conditions; (2) combined daytime and nighttime samples from LRK during high-NOx conditions; (3) nighttime samples from CTR during low-NOx conditions; and (4) daytime samples from CTR during high-NOx conditions. It should be noted that although the field samples have been assigned as low- or high-NOx the actual NOx conditions under which the aerosol was formed are difficult to determine because the history of the SOA in the atmosphere is uncertain, especially for pooled samples like those analyzed here.
The results of these measurements are shown in , where Groups 1 (carboxyl + alcohol), 2 (ketone/aldehyde + ester), and 4 (alkane) are the same as those defined for the laboratory studies. Because peroxide and organonitrate groups were not analyzed with the Deriv-Spec methods (for reasons discussed above) and because FTIR analyses of organonitrate groups were below the limit of quantification at both sites (∼5–10% of total organic matter) (Liu et al. Citation2018), neither peroxide nor organonitrate groups are included in the figure. Instead, because of possible contributions from amines, which can be measured by FTIR but not the Deriv-Spec methods, the previous Group 3 (organonitrate) has been replaced by Group 3 (amine).
Figure 3. Functional group composition of SOAS samples collected at (a,b) Look Rock, TN and (c,d) Centerville, AL measured using the Deriv-Spec (CU) and FTIR (SIO) methods. (a) and (b) were combined daytime + nighttime samples collected under low NOx conditions and high NOx conditions, respectively, (c) was a nighttime sample collected under low NOx conditions and (d) was a daytime sample collected under high NOx conditions.
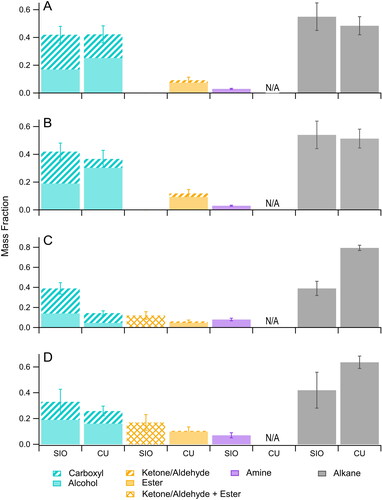
The functional group composition of the combined daytime and nighttime LRK samples are similar for the low-NOx () and high-NOx () conditions, although there is agreement and disagreement between the two methods. Whereas the FTIR and Deriv-Spec measurements agree within uncertainties for Groups 1 and 4, the Deriv-Spec methods measure significant Group 2 content while the FTIR method did not detect any contribution from this group. Interestingly, this discrepancy was noted above for SOA formed from the reactions of α-pinene with OH radicals without NOx and monoterpenes with NO3 radicals. There it was explained as being to be due to hydrolysis of hemiacetals, peroxyhemiacetals, or acetals to form monomers containing ketone/aldehyde groups during Deriv-Spec analysis, a process that does not occur in FTIR analysis. Because Group 2 in the Deriv-Spec analysis is mostly esters with little contribution from ketone/aldehyde groups that could have been present as hemiacetals, peroxyhemiacetals, or acetals it seems that in this case there is a different reason for the discrepancy. It is also worth noting that for 3A and 3B the FTIR absence of Group 2 coincides with a higher FTIR carboxyl (in Group 1), which suggests that the uncertainties in absorptivity for the carboxyl and carbonyl groups (Takahama, Johnson, and Russell Citation2013) could result in attributing too much to Group 1 at the expense of Group 2. Interestingly, this effect is not evident in the smaller discrepancies in 3C and 3D.
The functional group composition of the CTR samples are also similar for the low-NOx nighttime sample () and the high-NOx daytime sample (). Significant amounts of all four groups were measured with both methods (except the Deriv-Spec methods cannot detect amines) and the relative amounts are Group 4 > Group 1 > Group 2 > Group 3 for both samples. The results for the two methods are within or nearly within measurement uncertainties for the high-NOx daytime sample, but not for any of the measurements of the low-NOx nighttime sample. Rather than speculate as to the reasons for the discrepancies in the latter measurements, which typically differ by about a factor of 2, we note that, if for some unknown reason the Deriv-Spec Group 1 analysis is low by this factor, then accounting for this error and the contribution of the Group 3 amines would lead to a large decrease in the value calculated for Group 4 by mass balance and thus also bring those measurements into better agreement.
Comparison of field and chamber samples
The results of the analyses of SOA formed in the environmental chamber experiments can be used to help interpret the SOAS samples analyzed using the Deriv-Spec and FTIR methods. As shown in , all field samples contained significant contributions from Groups 1 and 2 (though none of Group 2 in two cases for the FTIR methods), and none from Group 3 (organonitrates were below the FTIR detection limit of 5–10% mass fraction were not analyzed with the Deriv-Spec methods). Comparing the compositions of the combined daytime and nighttime samples from LRK during low-NOx () and high-NOx () conditions with those shown in and suggests that a significant fraction of the SOA was formed from reactions of monoterpenes with OH radicals under low-NOx conditions, and likely from a similar reaction of isoprene as well, since this should form products with the same functional groups (Surratt et al. Citation2006) but was not studied here because of the low SOA yields. This comparison should only be minimally affected by decomposition of hydroxperoxides and peroxyhemiacetals in the field samples since the Baeyer-Villiger reactions by which it occurs primarily convert hydroperoxide groups to alcohol groups and ketone and aldehyde groups to ester and carboxyl groups, respectively (Claflin et al. Citation2018), leading to little change in the contributions of Groups 1 and 2. This is consistent with other measurements made at SOAS that attribute ∼20% of the organic aerosol to isoprene oxidation products at the LRK and CTR field sites (Rattanavaraha et al. Citation2016; Liu et al. Citation2018). Comparing the composition of samples collected at CTR for nighttime low-NOx () and daytime high-NOx () conditions with those shown in and suggests that a significant fraction of the SOA was also formed under low-NOx conditions from the reactions of monoterpenes and isoprene with OH radicals as well as from the reaction of monoterpenes with O3. This is consistent with the PMF analysis of AMS data conducted by Massoli et al. (Citation2018) for the CTR site, which concluded that the nighttime terpene factor was due mostly to products of monoterpene ozonolysis. And the significant amount of ester groups measured in all field samples suggests that particle-phase reactions occurred, either via Baeyer-Villager reactions (Claflin et al. Citation2018) or through acid-catalyzed reactions of carboxyl and alcohol groups (Ziemann and Atkinson Citation2012). This observation is consistent with other SOAS studies that associated the presence of acidic sulfate aerosol with heterogeneous chemistry during the campaign (Budisulistiorini et al. Citation2015; Liu et al. Citation2017).
Conclusions
In this study the SIO FTIR and CU Deriv-Spec methods for quantifying the functional group composition of SOA were compared. When used to analyze SOA generated from environmental chamber reactions, the methods agreed reasonably well when the results were assigned to groups that contain an O–H bond, non-acid functional groups containing a C = O moiety, organonitrate groups, and alkane groups, indicating that either is adequate for characterizing the functional group composition of SOA. In some cases, however, discrepancies were observed that appear to stem from sample processing (filter extraction and solution reactions) required in the Deriv-Spec but not FTIR methods, and interferences and overlaps in FTIR spectra that contribute to uncertainties in the SIO FTIR algorithm. In addition, although the Deriv-Spec methods offer more specificity, they require more time and aerosol mass than the FTIR methods, so these tradeoffs must be considered when choosing one over the other.
A number of observations made from the environmental chamber experiments suggest that patterns in the functional group composition can be used to help identify possible sources of SOA in field samples when used as source “fingerprints.” For example, SOA formed from reactions of terpenes with OH/NOx and NO3 radicals both have a large contribution from organonitrate groups, but then differ in having a large and small contribution, respectively, from ketone/aldehyde groups. This might make it possible to identify contributions from daytime OH/NOx reactions and nighttime NO3 reactions to SOA. Furthermore, whereas the ratio of alkane/organonitrate groups in SOA is ∼1 for the reaction of isoprene (a C5 alkene) with OH/NOx, the ratio is ∼2 for the reaction with monoterpenes (C10 alkenes), possibly allowing contributions from these two important VOC precursors to be identified in high-NOx regions. And lastly, SOA formed from reactions of monoterpenes with OH radicals or O3 under low-NOx conditions typically contain significant contributions from carboxyl, alcohol, ketone/aldehyde, and ester groups, but not organonitrate groups, since neither NOx nor NO3 radicals are present. Though not fully demonstrated in this study, the results presented here in combination with those from previous laboratory studies suggest that it might be possible to use differences in the patterns of functional groups determined by the FTIR and Deriv-Spec analyses and the presence of specific functional groups (such as esters) as indicators of oligomers in SOA.
Results from the environmental chamber experiments were also used to help interpret the functional group composition of a few filter samples of aerosol collected at the 2013 SOAS campaign, which resulted in a number of conclusions. The comparisons of the field results for FTIR and Deriv-Spec were generally better than those of the chamber studies, consistent with expectations since the FTIR algorithm was trained on field samples rather than chamber samples (Russell, Takahama Citation2009). The presence of significant amounts of carboxyl, alcohol, and ester groups and little or no ketone/aldehyde and organonitrate groups in samples from Look Rock, TN suggests that a significant fraction of the SOA was formed from reactions of monoterpenes (and probably isoprene) with OH radicals under low-NOx conditions, whereas the composition of samples from Centerville, AL indicated the importance of these same reactions as well as reactions of monoterpenes with O3. These results are mostly consistent with those reported by others based on different methods of aerosol chemical characterization.
The results of this study demonstrate that measuring the functional group composition of SOA can give information as to the sources and environmental conditions under which the SOA was formed, especially when paired with laboratory experiments that target potentially important reactions. Furthermore, it was shown that by using certain functional group signatures it may be possible to determine the oxidant (OH radicals, NO3 radicals, or O3) and the NOx conditions (low or high) responsible for the formation of SOA.
Supplemental Material
Download PDF (319.3 KB)Acknowledgments
The authors thank Annmarie Carlton, Joost de Gouw, Jose Jimenez, and Allen Goldstein for organizing the SOAS campaign, and Sherri Hunt for supporting the project.
Additional information
Funding
References
- Aimanant, S., and P. J. Ziemann. 2013a. Development of spectrophotometric methods for the analysis of functional groups in oxidized organic aerosol. Aerosol Sci. Technol. 47 (6):581–91. doi: 10.1080/02786826.2013.773579.
- Aimanant, S., and P. J. Ziemann. 2013b. Chemical mechanisms of aging of aerosol formed from the reaction of n-pentadecane with OH radicals in the presence of NOx. Aerosol Sci. Technol. 47 (9):979–90. doi: 10.1080/02786826.2013.804621.
- Algrim, L. B., and P. J. Ziemann. 2016. Effect of the keto group on yields and composition of organic aerosol formed from OH radical-initiated reactions of ketones in the presence of NOx. J. Phys. Chem. A 120:6978–89. doi: 10.1021/acs.jpca.6b05839.
- Atkinson, R., and J. Arey. 2003. Atmospheric degradation of volatile organic compounds. Chem. Rev. 103:4605–38. doi: 10.1021/cr0206420.
- Atkinson, R., C. N. Plum, W. P. L. Carter, A. M. Winer, and J. N. Pitts Jr. 1984. Rate constants for the gas-phase reactions of nitrate radicals with a series of organics in air at 298 ± 1 K. J. Phys. Chem. 88 (6):1210–5. doi: 10.1021/j150650a039.
- Ayres, B. R., H. M. Allen, D. C. Draper, S. S. Brown, R. J. Wild, J. L. Jimenez, D. A. Day, P. Campuzano-Jost, W. Hu, J. de Gouw, et al. 2015. Organic nitrate aerosol formation via NO3 + biogenic volatile organic compounds in the southeastern United States. Atmospheric Chem. Phys. 15 (23):13377–92. doi: 10.5194/acp-15-13377-2015.
- Banerjee, D. K., and C. C. Budke. 1964. Spectrophotometric determination of traces of peroxides in organic solvents. Anal. Chem. 36 (4):792–6. doi: 10.1021/ac60210a027.
- Brooks, S. D., M. E. Wise, M. Cushing, and M. A. Tolbert. 2002. Deliquescence behavior of organic/ammonium sulfate aerosol. Geophys. Res. Lett. 29 (19):23-1–23-4. doi: 10.1029/2002GL014733.
- Budisulistiorini, S. H., X. Li, S. T. Bairai, J. Renfro, Y. Liu, Y. J. Liu, K. A. McKinney, S. T. Martin, V. F. McNeill, H. O. T. Pye, et al. 2015. Examining the effects of anthropogenic emissions on isoprene-derived secondary organic aerosol formation during the 2013 Southern Oxidant and Aerosol Study (SOAS) at the Look Rock, Tennessee ground site. Atmospheric Chem. Phys. 15 (15):8871–88. doi: 10.5194/acp-15-8871-2015.
- Carlton, A. M., J. de Gouw, J. L. Jimenez, J. L. Ambrose, A. R. Attwood, S. Brown, K. R. Baker, C. A. Brock, R. C. Cohen, S. Edgerton, et al. 2018. The Southeast Atmosphere Studies (SAS): Coordinated investigation and discovery to answer critical questions about fundamental atmospheric processes. Bull. Am. Meteorol. Soc. 99 (3):547–67. doi: 10.1175/BAMS-D-16-0048.1.
- Claflin, M. S., J. E. Krechmer, W. Hu, J. L. Jimenez, and P. J. Ziemann. 2018. Functional group composition of secondary organic aerosol formed from ozonolysis of α-pinene under high VOC and autoxidation conditions. ACS Earth Space Chem. 2 (11):1196–210. doi: 10.1021/acsearthspacechem.8b00117.
- Claflin, M. S., and P. J. Ziemann. 2018. Identification and quantitation of aerosol products of the reaction of β-pinene with NO3 radicals and implications for gas- and particle-phase reaction mechanisms. J. Phys. Chem. A 122:3640–52. doi: 10.1021/acs.jpca.8b00692.
- Clegg, S. L., P. Brimblecombe, and A. S. Wexler. 1998. A thermodynamic model of the system H+ - NH4+ - Na+ - SO42- - NO3- - Cl- - H2O at 298.15 K. J. Phys. Chem. A. 102 (12):2155–71. doi: 10.1021/jp973043j.
- Coury, C., and A. M. Dillner. 2007. A Method to quantify organic functional groups and inorganic compounds in ambient aerosols using attenuated total reflectance FTIR spectroscopy and multivariate chemometric techniques. Atmospheric Environ. 41 (40):9309–23. doi: 10.1016/j.atmosenv.2008.03.026.
- Coury, C., and A. M. Dillner. 2009. ATR-FTIR Characterization of organic functional groups and inorganic ions in ambient aerosols at a rural site. Atmospheric Environ. 43 (4):940–8. doi: 10.1016/j.atmosenv.2008.10.056.
- Day, D. A., S. Liu, L. M. Russell, and P. J. Ziemann. 2010. Organonitrate group concentrations in submicron particles with high nitrate and organic fractions in coastal southern California. Atmospheric Environ. 44 (16):1970–9. doi: 10.1016/j.atmosenv.2010.02.045.
- Deming, B., D. Pagonis, X. Liu, D. Day, R. Talukdar, J. Krechmer, J. A. de Gouw, J. L. Jimenez, and P. J. Ziemann. 2019. Measurements of delays of gas-phase compounds in a wide variety of tubing materials due to gas-wall interactions. Atmos. Meas. Tech. 12 (6):3453–61. doi: 10.5194/amt-12-3453-2019.
- Docherty, K. S., W. Wu, Y. B. Lim, and P. J. Ziemann. 2005. Contributions of organic peroxides to secondary organic aerosol formed from reactions of monoterpenes with O3. Environ. Sci. Technol. 39:4049–59. doi: 10.1021/es050228s.
- Eddingsaas, N. C., C. L. Loza, L. D. Yee, M. Chan, K. A. Schilling, P. S. Chhabra, J. H. Seinfeld, and P. O. Wennberg. 2012. α-pinene photooxidation under controlled chemical conditions – Part 2: SOA yield and composition in low- and high-NOx environments. Atmospheric Chem. Phys. 12 (16):7413–27. doi: 10.5194/acp-12-7413-2012.
- Gao, Y., S. B. Chen, and L. E. Yu. 2006. Efflorescence relative humidity of ammonium sulfate particles. J. Phys. Chem. A 110:7602–8. doi: 10.1021/jp057574g.
- Guenther, A., X. Jiang, C. L. Heald, T. Sakulyanontvittaya, T. Duhl, L. K. Emmons, and X. Wang. 2012. The Model of Emissions of Gases and Aerosols from Nature version 2.1 (MEGAN2.1): An extended and updated framework for modeling biogenic emissions. Geosci. Model Dev. 5 (6):1471–92. doi: 10.5194/gmd-5-1471-2012.
- Guo, H., L. Xu, A. Bougiatioti, K. M. Cerully, S. L. Capps, J. R. Hite, A. G. Carlton, S.-H. Lee, M. H. Bergin, N. L. Ng, et al. 2015. Fine-particle water and pH in the southeastern United States. Atmospheric Chem. Phys. 15 (9):5211–28. doi: 10.5194/acp-15-5211-2015.
- Hallquist, M., J. C. Wenger, U. Baltensperger, Y. Rudich, D. Simpson, M. Claeys, J. Dommen, N. M. Donahue, C. George, A. H. Goldstein, et al. 2009. The formation, properties and impact of secondary organic aerosol: Current and emerging issues. Atmospheric Chem. Phys. 9 (14):5155–236. doi: 10.5194/acp-9-5155-2009.
- Hoffmann, T., R. J. Huang, and M. Kalberer. 2011. Atmospheric analytical chemistry. Anal. Chem 83:4649–64. doi: 10.1021/ac2010718.
- Hu, K. S., A. I. Darer, and M. J. Elrod. 2011. Thermodynamics and kinetics of the hydrolysis of atmospherically relevant organonitrates and organosulfates. Atmospheric Chem. Phys. 11 (16):8307–20. doi: 10.5194/acp-11-8307-2011.
- Jacobs, M. I., W. J. Burke, and M. J. Elrod. 2014. Kinetics of the reactions of isoprene-derived hydroxynitrates: Gas phase epoxide formation and solution phase hydrolysis. Atmospheric Chem. Phys. 14 (17):8933–46. doi: 10.5194/acp-14-8933-2014.
- Jacobson, M. C., H. C. Hansson, K. J. Noone, and R. J. Charlson. 2000. Organic atmospheric aerosols: Review and state of the science. Rev. Geophys. 38 (2):267–94. doi: 10.1029/1998RG000045.
- Kaiser, J., K. Skog, K. Baumann, S. Bertman, S. Brown, W. Brune, J. Crounse, J. de Gouw, E. Edgerton, P. Feiner, et al. 2016. Speciation of OH reactivity above the canopy of an isoprene-dominated forest. Atmospheric Chem. Phys. 16 (14):9349–59. doi: 10.5194/acp-16-9349-2016.
- Krapf, M., I. E. Haddad, E. A. Bruns, U. Molteni, K. R. Daellenbach, A. S. H. Prevot, U. Baltensperger, and J. Dommen. 2016. Labile peroxides in secondary organic aerosol. Chem 1 (4):603–16. doi: 10.1016/j.chempr.2016.09.007.
- Kroll, J. H., and J. H. Seinfeld. 2008. Chemistry of secondary organic aerosol: Formation and evolution of low-volatility organics in the atmosphere. Atmospheric Environ. 42 (16):3593–624. doi: 10.1016/j.atmosenv.2008.01.003.
- Kuwata, M., S. R. Zorn, and S. T. Martin. 2012. Using elemental ratios to predict the density of organic material composed of carbon, hydrogen, and oxygen. Environ. Sci. Technol. 46 (2):787–94. doi: 10.1021/es202525q.
- Lee, B. H., C. Mohr, F. D. Lopez-Hilfiker, A. Lutz, M. Hallquist, L. Lee, P. Romer, R. C. Cohen, S. Iyer, T. Kurtén, et al. 2015. Highly functionalized organic nitrates in the southeast United States: Contribution to secondary organic aerosol and reactive nitrogen budgets. Proc. Natl. Acad. Sci. 113:1516–21. doi: 10.1073/pnas.1508108113.
- Lim, Y. B., and P. J. Ziemann. 2009. Chemistry of secondary organic aerosol formation from OH radical-initiated reactions of linear, branched, and cyclic alkanes in the presence of NOx. Aerosol Sci. Technol. 43 (6):604–19. doi: 10.1080/02786820902802567.
- Liu, J., L. M. Russell, A. K. Y. Lee, K. A. McKinney, J. D. Surratt, and P. J. Ziemann. 2017. Observations evidence for pollution-influenced selective uptake contributing to biogenic secondary organic aerosols in the southeast U.S. Geophys. Res. Lett. 44 (15):8056–64. doi: 10.1002/2017GL074665.
- Liu, J., L. M. Russell, G. Ruggeri, S. Takahama, M. S. Claflin, P. J. Ziemann, H. O. T. Pye, B. N. Murphy, L. Xu, N. L. Ng, et al. 2018. Regional similarities and NOx-related increases in biogenic secondary organic aerosol in summertime southeastern U.S. J. Geophys. Res. Atmos. 123:10620–36. doi: 10.1029/2018JD028491.
- Maria, S. F., L. M. Russell, B. J. Turpin, and R. J. Porcja. 2002. FTIR measurements of functional groups and organic mass in aerosol samples over the Caribbean. Atmospheric Environ. 36 (33):5185–96. doi: 10.1016/S1352-2310(02)00654-4.
- Massoli, P., H. Stark, M. R. Canagaratna, J. E. Krechmer, L. Xu, N. L. Ng, R. L. Mauldin, C. Yan, J. Kimmel, P. K. Misztal, et al. 2018. Ambient measurements of highly oxidized gas-phase molecules during the Southern Oxidant and Aerosol Study (SOAS) 2013. ACS Earth Space Chem. 2 (7):653–72. doi: 10.1021/acsearthspacechem.8b00028.
- Matsunaga, A., and P. J. Ziemann. 2009. Yields of β-hydroxynitrates and dihydroxynitrates in aerosol formed from OH radical-initiated reactions of linear alkenes in the presence of NOx. J. Phys. Chem. A. 113 (3):599–606. doi: 10.1021/jp807764d.
- Orlando, J. J., and G. S. Tyndall. 2012. Laboratory studies of organic peroxy radical chemistry: An overview with emphasis on recent issues of atmospheric significance. Chem. Soc. Rev. 41:6294–317. doi: 10.1039/C2CS35166H.
- Pagonis, D., and P. J. Ziemann. 2018. Chemistry of hydroperoxycarbonyls in secondary organic aerosol. Aerosol Sci. Technol. 52 (10):1178–93. doi: 10.1080/02786826.2018.1511046.
- Pankow, J. F., and W. E. Asher. 2008. SIMPOL.1: A simple group contribution methods for predicting vapor pressures and enthalpies of vaporization of multifunctional organic compounds. Atmospheric Chem. Phys. 8 (10):2773–96. doi: 10.5194/acp-8-2773-2008.
- Pöschl, U. 2005. Atmospheric aerosols: Composition, transformation, climate and health effects. Angew. Chem. Int. Ed. 44:7520–40. 10.1002/anie.200501122.
- Prenni, A. J., M. D. Petters, S. M. Kreidenweis, P. J. DeMott, and P. J. Ziemann. 2007. Cloud droplet activation of secondary organic aerosol. J. Geophys. Res. 112:D10223. doi: 10.1029/2006JD007963.
- Ranney, A. P., and P. J. Ziemann. 2016a. Microscale spectrophotometric methods for quantification of functional groups in oxidized organic aerosol. Aerosol Sci. Technol. 50 (9):881–92. doi: 10.1080/02786826.2016.1201197.
- Ranney, A. P., and P. J. Ziemann. 2016b. Kinetics of acid-catalyzed dehydration of cyclic hemiacetals in aerosol particles in equilibrium with nitric acid vapor. J. Phys. Chem. A. 120 (16):2561–8. doi: 10.1021/acs.jpca.6b01402.
- Rattanavaraha, W., K. Chu, S. H. Budisulistiorini, M. Riva, Y. H. Lin, E. S. Edgerton, K. Baumann, S. L. Shaw, H. Guo, L. King, et al. 2016. Assessing the impact of anthropogenic pollution on isoprene-derived secondary organic aerosol formation in PM2.5 collected from the Birmingham, Alabama, ground site during the 2013 Southern Oxidant and Aerosol Study. Atmospheric Chem. Phys 16:4897–914. doi: 10.5194/acp-16-4897-2016.
- Reggente, M., A. M. Dillner, and S. Takahama. 2019. Analysis of functional groups in atmospheric aerosols by infrared spectroscopy: systematic intercomparison of calibration methods for US measurement network samples. Atmos. Meas. Tech. 12 (4):2287–312. doi: 10.5194/amt-12-2287-2019.
- Reid, J. P., A. K. Bertram, D. O. Topping, A. Laskin, S. T. Martin, M. D. Petters, F. D. Pope, and G. Rovelli. 2018. The viscosity of atmospherically relevant organic particles. Nat. Commun 9:956. doi: 10.1038/s41467-018-03027-z.
- Russell, L. M. 2003. Aerosol organic-mass-to-organic-carbon ratio measurements. Environ. Sci. Technol. 37:2982–7. doi: 10.1021/es026123w.
- Russell, L. M., R. Bahadur, L. N. Hawkins, J. Allan, D. Baumgardner, P. K. Quinn, and T. S. Bates. 2009. Organic aerosol characterization by complementary measurements of chemical bonds and molecular fragments. Atmospheric Environ. 43 (38):6100–5. doi: 10.1016/j.atmosenv.2009.09.036.
- Russell, L. M., R. Bahadur, and P. J. Ziemann. 2011. Identifying organic aerosol sources by comparing functional group composition in chamber and atmospheric particles. Proc. Natl. Acad. Sci 108:3516–21. doi: 10.1073/pnas.1006461108.
- Russell, L. M., S. Takahama, S. Liu, S. L. N. Hawkins, D. S. Covert, P. K. Quinn, and T. S. Bates. 2009. Oxygenated fraction and mass of organic aerosol from direct emission and atmospheric processing measured on the R/V Ronald Brown during TEXAQS/GoMACCS 2006. J. Geophys. Res. Atmos. 114:D00F05. doi: 10.1029/2008JD011275.
- Shreve, O. D., M. R. Heether, H. B. Knight, and D. Swern. 1951. Infrared absorption spectra of some hydroperoxides, peroxides, and related compounds. Anal. Chem. 23 (2):282–5. doi: 10.1021/ac60050a015.
- Surratt, J. D., S. M. Murphy, J. H. Kroll, N. L. Ng, L. Hildebrandt, A. Sorooshian, R. Szmigielski, R. Vermeylen, W. Maenhaut, M. Claeys, et al. 2006. Chemical composition of secondary organic aerosol formed from the photooxidation of isoprene. J. Phys. Chem. A 110:9665–90. doi: 10.1021/jp061734m.
- Takahama, S., A. M. Dillner, A. T. Weakley, M. Reggente, C. Bürki, M. Lbadaoui-Darvas, B. Debus, A. Kuzmiakova, and A. S. Wexler. 2019. Atmospheric particulate matter characterization by Fourier Transform Infrared spectroscopy: a review of statistical calibration strategies for carbonaceous aerosol quantification in US measurement networks. Atmos. Meas. Tech. 12 (1):525–67. doi: 10.5194/amt-12-525-2019.
- Takahama, S., A. Johnson, and L. M. Russell. 2013. Quantification of carboxylic and carbonyl functional groups in organic aerosol infrared absorbance spectra. Aerosol Sci. Technol. 47 (3):310–25. doi: 10.1080/02786826.2012.752065.
- Taylor, W. D., T. D. Allston, M. J. Moscato, G. B. Fazekas, R. Kozlowski, and G. A. Takacs. 1980. Atmospheric Photodissociation lifetimes for nitromethane, methyl nitrite, and methyl nitrate. Int. J. Chem. Kinet. 12 (4):231–40. doi: 10.1002/kin.550120404.
- Wexler, A. S., and S. L. Clegg. 2002. Atmospheric aerosol models for systems including the ions H+, NH4+, Na+, SO42-, NO3-, Cl-, Br-, and H2O. J. Geophys. Res. 107 (D14):14-1–14-4. doi: 10.1029/2001JD000451.
- Xu, L., H. Guo, C. Boyd, M. Klein, A. Bougiatioti, K. Cerully, J. R. Hite, G. Isaacman-VanWertz, N. Kreisberg, C. Knote, et al. 2015b. Effects of anthropogenic emissions on aerosol formation from isoprene and monoterpenes in the southeastern United States. Proc. Natl. Acad. Sci. 112:37–42. doi: 10.1073/pnas.1417609112.
- Xu, L., S. Suresh, H. Guo, R. J. Weber, and N. L. Ng. 2015a. Aerosol characterization over the southeastern united states using high-resolution aerosol mass spectrometry: Spatial and seasonal variation of aerosol composition and sources with a focus on organic nitrates. Atmospheric Chem. Phys. 15 (13):7307–36. doi: 10.5194/acp-15-7307-2015.
- Yu, J., D. R. Cocker, R. J. Griffin, R. C. Flagan, and J. H. Seinfeld. 1999. Gas-phase ozone oxidation of monoterpenes: gaseous and particulate products. J. Atmos. Chem. 34 (2):207–58. doi: 10.1023/A:1006254930583.
- Ziemann, P. J., and R. Atkinson. 2012. Kinetics, products, and mechanisms of secondary organic aerosol formation. Chem. Soc. Rev. 41:6582–605. doi: 10.1039/C2CS35122F.