
 ?Mathematical formulae have been encoded as MathML and are displayed in this HTML version using MathJax in order to improve their display. Uncheck the box to turn MathJax off. This feature requires Javascript. Click on a formula to zoom.
Abstract
The refractive index (RI) of atmospheric aerosols is a critical parameter in aerosol direct radiative forcing (DRF) calculation that exhibits considerable uncertainties owing partly to substantial spatiotemporal changes in the RI. A tandem system comprising a single-particle soot photometer connected to a differential mobility analyzer is developed. Two field campaigns are conducted to derive the size-resolved real part of the RI of scattering (i.e., BC-free) particles at 1064 nm (RRIsp1064nm) in urban Beijing. Measurements of the RRIsp1064nm within a mobility diameter (Dmob) range of approximately 200 nm to 400 nm in summer and winter clearly show seasonal variations in the RRIsp1064nm, including magnitude and size dependence. A decreasing RRIsp1064nm trend is observed in summer as the Dmob enlarges from 237 nm to 422 nm, whereas the RRIsp1064nm increases in winter as the Dmob grows. This finding likely indicates varying aerosol physicochemical properties with particle size in summer and winter. Size-resolved RRIsp1064nm values within the Dmob range are generally larger in summer than in winter, thereby resulting in a larger bulk RRIsp1064nm of 1.50 ± 0.01 in summer compared with winter (1.47 ± 0.02). The low RRIsp1064nm in winter is likely attributable to the high contribution of organic aerosols (OA), particularly less oxidized OA, which generally have lower RRI values than secondary inorganic aerosols. Pronounced low RRIsp1064nm values are observed during polluted episodes in winter, implying significant OA contribution. Photooxidation is likely an important regulator of the RRIsp1064nm in summer. This inference is supported by the fact that RRIsp1064nm values in the afternoon are larger than those at night, which corresponds well to diurnal variations in Ox (Ox=O3+NO2) concentrations. Results indicate that seasonal variations in the RRIsp1064nm should be considered carefully in research, such as in DRF assessments, aerosol property parameterization in chemical models, and aerosol optical property and composition remote sensing.
Copyright © 2021 American Association for Aerosol Research
EDITOR:
1. Introduction
Aerosols are crucial factors that influence the energy budget of Earth’s systems by scattering and absorbing solar radiation and interacting with clouds (IPCC, Citation2013). The direct radiative forcing (DRF) of atmospheric aerosols is dependent predominantly on aerosol optical properties, including aerosol optical depth, single scattering albedo, and asymmetry factors (Seinfeld and Pandis Citation2006). Owing to heterogeneity in the spatial and temporal distribution of aerosol optical properties, considerable uncertainties abound in the assessment of aerosol DRF (IPCC, Citation2013). The refractive index (RI) is one of the most important parameters that determine aerosol optical properties. The RI is essential in aerosol DRF evaluation in aerosol-involved climate model simulations (Liao et al. Citation2004; Han et al. Citation2012; J. W. Li, Cheng, et al. Citation2019). Small variations in the RI can lead to non-negligible alterations in aerosol DRF (Zarzana, Cappa, and Tolbert Citation2014; Moise, Flores, and Rudich Citation2015; Valenzuela et al. Citation2018). The RI is also a key parameter in aerosol optical property and composition remote sensing from satellite- or ground-based observations (Dubovik and King 2000; Li et al. Citation2018).
The RI of an aerosol particle is determined largely by its chemical composition. The components comprising aerosol particles are generally recognized by their RI values. For example, the theoretical real part of the RI (RRI) of ammonia sulfate at a wavelength of approximately 1000 nm is 1.52. However, special cases exist in which the RI varies in specific components. For instance, secondary organic aerosols (SOA) have a wide RRI range (1.35 to 1.66 at various wavelengths in a range of 220–1200 nm; Moise, Flores, and Rudich Citation2015) owing to the complexity and mutability of their molecular composition. Meanwhile, atmospheric aerosols are a mixture of various internal or external species and thus differ from the ideal case of one pure component. A volume-weight mixing scheme is widely employed in aerosol-involved climate models to calculate the RI value of an internal mixture, which is used in the subsequent optical estimation (Liao et al. Citation2004; Han et al. Citation2012; J. W. Li, Cheng, et al. Citation2019). Sometimes, direct RI measurements cannot be reconstructed effectively with simultaneously measured chemical composition with known RI values for individual species (Zhao, Tan, et al. Citation2019). This finding implies that further development of RI measurement techniques is necessary. Specifically, the measurement of size-resolved RI may address this issue to a certain extent. The direct measurement of aerosol RI is necessary to validate the reliability of estimations from substitutive parameters and approaches. From another perspective, measured RI can provide insights into aerosol physicochemical properties, including effective density (ρeff) and chemical composition. A relationship exists between RRI and ρeff in monocomponent particles (Liu and Daum Citation2008), which was extended by Zhao, Tan, et al. (Citation2019) to examine ambient aerosols, as follows:
(1)
(1)
The RI can be measured directly using ellipsometry for the real part and ultraviolet-visible spectroscopy for the imaginary part (Wang and Rood Citation2008; Liu et al. Citation2015). The scattering and/or absorption intensity of airborne aerosol particles is determined by particle size distribution (PSD) and the RI; thus, a combination of PSD and aerosol scattering and/or absorption intensity measurements is used widely to obtain the bulk aerosol RI (Liu and Daum Citation2000; Hand and Kreidenweis Citation2002; Sorooshian et al. Citation2008; Cai, Montague, and Deshler Citation2011; Vratolis et al. Citation2018; Wu et al. Citation2018). The RI and PSD can also be retrieved simultaneously by applying a secondary optimization technique based on the measurement of a double integrating sphere system (Ren et al. Citation2015). In addition, the RI and PSD of ambient aerosols can be retrieved from solar spectral extinction and scattering measurements using an optimize retrieval algorithm (Dubovik and King Citation2000). The aerosol scattering phase function is moderately dependent on the RRI; thus, methods based on scattering intensity measurements at different angles are also utilized to retrieve the RRI (Espinosa et al. Citation2019; Eidhammer, Montague, and Deshler Citation2008; Barkey, Paulson, and Chung Citation2007). Owing to the development of single-particle measurement technology, aerosol RRI can be obtained using an aerosol time-of-flight mass spectrometer (Moffet and Prather Citation2005; Moffet et al. Citation2008) or single-particle mass spectrometry (Zhang et al. Citation2016). Moteki, Kondo, and Nakamura (Citation2010) presented a method to infer RI of small nonspherical black carbon particles, based on a tandem system comprised by an aerosol particle mass analyzer (APM) and a single-particle soot photometer (SP2), which is developed based on single-particle measurement technology. These methods can generally measure the RI of bulk aerosol particles within a certain size range. However, the chemical composition and other properties (e.g., ρeff) of atmospheric aerosols are dependent on their size (M. Hu et al. Citation2012; W. W. Hu et al. Citation2016; W. Hu et al. Citation2017), which can result in potential variation in the RI with particle size. Therefore, investigations into the size dependence of the RI are important to improve aerosol DRF assessment accuracy and better understand size-resolved physicochemical properties.
In this study, a SP2 is combined with stepwise particle size selection using a differential mobility analyzer (DMA) to obtain the RRI of scattering (i.e., BC-free) particles (RRIsp). The advantage of this DMA-SP2 tandem system is that it can resolve the dependence of the RRIsp on aerosol size, which is valuable for analyzing aerosol density and chemical components as well as size dependence (Liu and Daum Citation2008). The in-depth experimental setup and data processing of this tandem system are introduced in one of our previous studies (Wu et al. Citation2019), in which the morphology and effective density of externally mixed BC particles in the atmosphere are revealed. A similar experimental design was also presented by Zhao, Zhao, et al. (Citation2019) and Zhao, Tan, et al. (Citation2019). Compared with previous studies focusing on either a method description (Zhao, Zhao, et al. Citation2019) or summer RRIsp estimation (Zhao, Tan, et al. Citation2019), the current study deploys the DMA-SP2 tandem system in two field campaigns (in summer and winter) during which aerosol physicochemical properties and sources differ significantly (Sun et al. Citation2015; W. W. Hu et al. Citation2016; W. Hu et al. Citation2017; Zhou et al. Citation2019). Seasonal discrepancies in the RRIsp, including magnitude and size dependence, are obtained for the first time in urban Beijing. In the following sections, first, we provide a detailed description of our experimental setup and field measurements. Next, the retrieved RRIsp values in summer and winter are presented, and the potential mechanisms leading to temporal variations in the RRIsp are discussed in detail. Finally, the impact of the RRIsp on coating thickness retrieval and light absorption enhancement in SP2-involved studies is determined. This study broadens knowledge on the size-resolved RRI of ambient aerosols, which is meaningful for model examinations and remote sensing retrievals.
2. Methodology
2.1. Tandem DMA-SP2/condensation particle counter (CPC) system
The tandem DMA-SP2/CPC system consists of a TSI model 3081 DMA, a TSI model 3776 CPC (TSI Inc., Shoreview, MN, USA), and a version C SP2 (Droplet Measurement Technologies, Boulder, CO, USA). This setup is built to obtain size-resolved aerosol physical properties, such as the morphology and effective density of externally mixed BC particles (Wu et al. Citation2019), BC mixing states, and the RRIsp. Briefly, the DMA selects particles with a given mobility (a narrow mobility range owing to the transfer function of the DMA). Size-resolved particles are delivered to the CPC for counting and to the parallel SP2 for particle scattering intensity and refractory BC (rBC) mass determination (). The selection of particles with different mobilities is achieved by altering the voltage of the DMA by controlling a TSI model 3080 electrostatic classifier. A TSI model 3087 neutralizer is installed in front of the DMA to charge the particles according to a known charge probability before size selection. The electrostatic classifier communicates with an external computer through a series cable, on which a self-compiled size selection program is run to alter the voltage of the DMA using a stepwise mode. Essential settings, including stepwise voltage, the duration of each voltage, and the operated sheath flow of the DMA, are compiled in the size selection program before the operator alters each measurement based on specific needs.
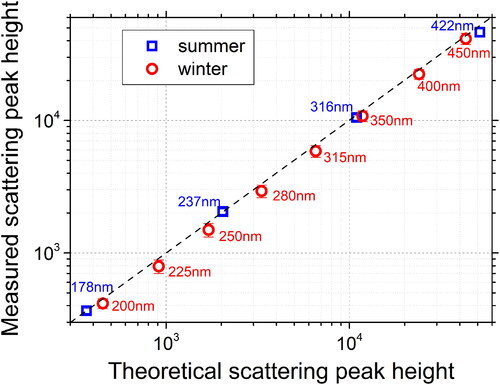
Figure 1. Comparisons of scattering peak heights detected by the SP2 for BC-free particles at prescribed mobility diameters with those theoretically calculated on the basis of Mie theory by assuming an RI of 1.50-0i; blue squares represent results in the summer campaign, and red dots represent results in the winter campaign.
2.2. Aerosol scattering cross-section determination
Particles with a given mobility selected by the DMA are drawn into the SP2 for single-particle quantitative measurements. The SP2 determines the rBC mass particle by particle using a laser-induced incandescence technique (Schwarz et al. Citation2006). Scattering signals at the laser wavelength of 1064 nm are synchronously detected, which provides an advantage for evaluating the mixing state of rBC-containing particles by comparing the incandescence signals (Gao et al. Citation2007; Moteki and Kondo Citation2007). Owing to the light absorption and consequential heating of an rBC-containing particle when it passes through the intensive and Gaussian-distributed laser beam in the SP2 measurement cavity, the coating of the rBC core evaporates before the onset of incandescence, thereby resulting in a gradual decrease in the particle scattering cross-section (σsp). Thus, the actual σsp of the rBC-containing particle cannot be obtained directly from the SP2 measurement unless lead-edge-only (LEO) fitting is employed for the scattering signal (Gao et al. Citation2007). However, the σsp is stable for a BC-free particle owing to the absence of evaporation, which is proportional to the induced scattering peak height (Hsp) when the particle is passing through the laser beam. In practice, the SP2 only detects scattering signals over a certain solid angle (ΔΩ) of scattered light collection (i.e., 15°–75° and 105°–165° in the plane parallel to the laser beam and 60°–120° in the plane perpendicular to the laser beam; Moteki and Kondo Citation2007). Thus, to be exact, the Hsp is proportional to the differential σsp (dσsp/dΩ) integrated over the solid angle (denoted as Δσsp), expressed as (Moteki and Kondo Citation2008):
(2)
(2)
where C is a scale factor which is dependent on the intensity of the laser beam. In the case of a stable laser intensity, C is a constant and can be obtained through calibration using pure scattering particles with known sizes, morphologies, and RRI, such as the polystyrene latex (PSL) microspheres with a 269 nm diameter used in the current study. PSL spheres have an RRI of 1.59 and a negligible RI imaginary part; thus, the Δσsp value of 269 nm PSL microspheres can be obtained by using Mie calculation. In practice, 269 nm PSL microspheres are generated by an aerosol generator (model AG-100, Droplet Measurement Technologies, Boulder, CO, USA) and delivered to the SP2 for scattering calibration. A diffusing dryer is installed in front of the SP2 to ensure the measurement of dry aerosols. To reduce the influence of the impurities of the PSL microspheres, they are further size selected by passing them through the DMA, given a fixed mobility diameter (Dmob) of 269 nm, before entering the SP2.
Owing to the detection efficiency of the SP2, only particles within a certain size range can be characterized effectively by their scattering signals (i.e., low gain Hsp within a range of 300–60,000 A/D counts for the SP2 used in the current study). Particles beyond the effective size range are either too small to be distinguished from instrument noise or too large to be detected accurately. Generally, a commercial SP2 has an effective scattering detection capability within a 200 nm to 400 nm diameter range for BC-free particles (Zhang et al. Citation2018), which somewhat depends on laser intensity (see Section 2.4). Gaussian or LEO fitting can be used to estimate the scattering peak intensity of particles larger than the upper limit of the scattering detection range (approximately 400 nm). However, additional uncertainties could arise from the fitting process. Moreover, in the atmosphere, particles larger than ∼400 nm generally have much lower number concentrations than smaller particles. This fact may result in insufficient data for further statistical analysis and fitting in the subsequent data processing. Thus, in the current study, we focus on particles within the effective scattering detection range of ∼200–400 nm.
2.3. Ambient measurements
The DMA-SP2/CPC system was deployed to obtain ambient measurements at an urban site in Beijing from 27 July to 23 August 2017 for the summer campaign and from 23 January to 10 February 2018 for the winter campaign. The observation site (39°58′N, 116°22′E) encompasses a residential community and a few hundred meters beyond several main roads and thus is affected by local vehicle emissions. Air quality in Beijing is influenced substantially by neighboring regions with intensive heavy industry emissions. Thus, the site is likely affected by regionally transported emissions, particularly during polluted periods, which are carried by moderate southerly winds (Ma et al. Citation2017).
In the summer campaign, we set the size selection program as 9 stepwise voltages to control the DMA to select particles with Dmob gradually increasing from 75 nm to 750 nm on a logarithmic scale. The indicated Dmob values correspond to the mobility diameters of single-charged particles at the prescribed DMA voltages. Particles with multiple charges have larger mobility diameters at each voltage compared with those with a single charge. If not specified, the mobility diameters hereinafter represent diameters corresponding to the mobility of single-charged particles. Each voltage is kept invariant for 48 s. A periodic cycle of the 9 stepwise voltages is operated in the measurement. In addition, 48 s for system stability are appended at the end of the last selected size (i.e., 750 nm), thereby leading to a total time cost of 8 min per cycle. For technical purposes, to obtain the time bias between the size selection and subsequent measurements, which results from the computer system time difference and consumption time of particles transported from the DMA to the SP2 and CPC (Wu et al. Citation2019), an auxiliary cycle is set to operate between the main cycles. The voltage (in turn, Dmob) setting of the auxiliary cycle is consistent with that of the main cycle, but the duration of each voltage and the system stable time decrease to 12 s. The total time of the auxiliary cycle is 2 min. The main cycle and auxiliary cycle operate alternately. Figure S2 shows an example of a variation in particle number concentration detected by the CPC and SP2 during an auxiliary cycle and adjacent main cycle in the summer campaign. The total number concentrations of SP2-detectable rBC-containing particles and BC-free particles are shown.
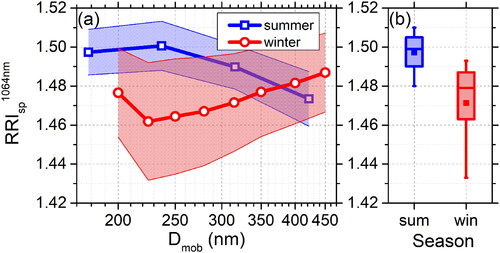
Figure 2. (a) Campaign-averaged size-resolved RRIsp1064nm as a function of Dmob, with shadow areas representing corresponding standard deviations; (b) boxplot of bulk RRIsp1064nm with upper and lower whisks representing 90% and 10% percentiles, respectively; upper and lower ends of the box representing 75% and 25% percentiles, respectively; the horizontal line in the box representing the median; and the square representing the mean value; blue represents results in summer, and red represents results in winter.
A similar size selection program setting is adopted for the winter campaign, except for the use of a fine voltage step for the DMA. The fine voltage setting is for the purpose of particle number size distribution inversion from CPC measurements at discrete Dmob. We set 33 stepwise voltages corresponding to single-charged particles within the 20–750 nm Dmob range on a logarithmic scale, each with a duration of 36 s, followed by 12 s for system stabilization, thereby resulting in a total duration of 20 min per cycle. An auxiliary cycle with a half-time duration of 10 min is set to operate between two major cycles. Correspondingly, the duration of each voltage in the auxiliary cycle decreases to 18 s, and the system stable time decreases to 6 s. An example of a variation in particle number concentrations during an auxiliary cycle and adjacent main cycle in the winter campaign is shown in Figure S3. Both in the summer and winter campaigns, only data from the main cycles are used in the following RRIsp determination.
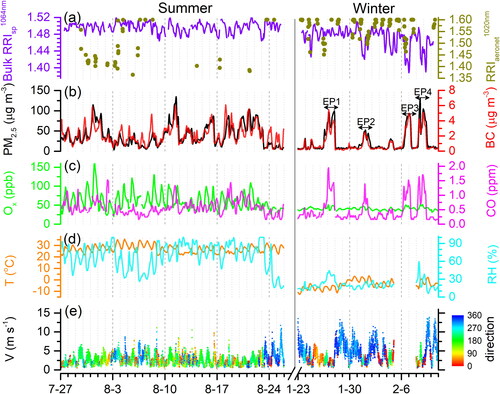
Figure 3. Temporal variations in (a) hourly retrieved bulk RRIsp1064nm and RRI of column-integrated aerosols over an urban site (i.e., CAMS) in Beijing (RRIaeronet1020nm); (b) PM2.5 and BC mass concentrations; (c) Ox (Ox=NO2+O3) and CO concentrations; (d) ambient T and RH at a height of 100 m; and (c) wind speed (V) at 100 m color scaled by wind direction.
The sheath flow rate of the DMA is set to 3 L min−1 (hereinafter STP) in both campaigns, but the total sample flow through the DMA is 0.55 L min−1 in summer, which is slightly lower than the flow rate of 0.70 L min−1 in winter. Flow rate discrepancies arise from different mounted instruments following the DMA. In addition to the SP2 and CPC, which operate with 0.10 L min−1 and 0.30 L min−1 flow rates, respectively, two microaethalometers (model AE51, AethLabs, San Francisco, CA, USA) operating with a 0.15 L min−1 flow rate are measured in parallel during the winter campaign (Figure S1). However, only one microaethalometer operating with a 0.15 L min−1 flow rate is deployed in the summer campaign. A nozzle with a diameter of 0.071 cm is installed in the impactor to prevent large particles from entering the DMA. Affected by the sample flow rate, particles with an aerodynamic diameter larger than 908 nm and 797 nm in the summer and winter campaigns, respectively, are blocked by the impactor. A model MD-700-12F-3 Nafion dryer (Perma Pure LLC, Toms River, NJ, USA) is deployed to dry the sampling aerosols before they enter the DMA-SP2/CPC system.
The SP2 operates under satisfactory conditions, with stable laser intensity throughout both campaigns. Hsp (low gain Hsp hereinafter if not specified) of 269 nm PSL microspheres is approximately 5900 A/D counts in the summer campaign, and its variation is within 3% based on two calibrations performed before and after the campaign. A lower Hsp of 269 nm PSL microspheres (∼3600 A/D counts) is observed in the winter campaign, largely attributed to the decreasing SP2 laser intensity. The decrease in laser intensity is illustrated by the considerable decrease in the YAG power recorded by the SP2, from ∼4.0 V in summer to ∼3.0 V in winter. However, only a < 1% difference is observed in Hsp of 269 nm PSL microspheres obtained from the calibrations before and after the winter campaign (3580 vs. 3600 A/D counts), thereby indicating that laser intensity remains stable throughout the winter campaign, even its absolute value decreases compared with that in summer. The Hsp value of 5900 A/D counts combined with the theoretically calculated Δσsp of 269 nm PSL spheres is used in the summer campaign to obtain the C value based on EquationEquation (2)(2)
(2) , while the Hsp value of 3600 A/D counts is used in the winter campaign.
PM2.5 mass concentrations are recorded using a synchronized hybrid ambient real-time particulate monitor (Model SHARP 5030, Thermo Scientific, Franklin, MA, USA), with an average 1-hour time resolution, for both campaigns. This PM2.5 monitor is based on the principles of aerosol light scattering (nephelometry) and beta attenuation to measure precise and accurate ambient aerosol concentrations. The instrument has an hourly precision of ±2.0 μg m−3 for measured mass loading less than 80 μg m−3 and ±5.0 μg m−3 for measurements greater than 80 μg m−3 as the manufacturer states. The accuracy is ±5% compared to 24 h Federal Reference Method and the minimum detectable limit for the mass transducer is < 0.5 µg. Ambient air is sampled at a flow rate of 16.7 L min−1 and passed through a PM2.5 cyclone inlet to remove particles with diameters >2.5 μm before entering the instrument. A model AE31 aethalometer (Magee Scientific, Berkeley, CA, USA) is used to record hourly BC mass concentrations. Hourly O3, NO2 and CO concentrations are obtained from the observations of the China National Environmental Monitoring Center at a site (Olympic center site) approximately 4 km away from our observation site. Meteorological variables, including air temperature (T), relative humidity (RH), and horizontal wind velocity and direction, are measured from 10 levels of a 325 m-high metrological tower approximately 50 m away from the aerosol measurement site. Hourly means at a 100-meter height are used in the analysis. In addition, the RI values (at 1020 nm) of column-integrated aerosols retrieved from ground-based sun photometer measurements at an urban site in Beijing (Chinese Academy of Meteorological Sciences [CAMS]) several kilometers away from our observation site are obtained from the dataset website of the Aerosol Robotic Network (AERONET, https://aeronet.gsfc.nasa.gov/) to compare the RRIsp obtained in this study. The uncertainty in AERONET RRI is expected to be <0.04.
2.4. Retrieval of size-resolved RRIsp
A local maximum method is utilized to identify the time bias between the size selection and subsequent measurements of the SP2 and CPC (Wu et al. Citation2019). and show that obvious time lags are observed in the SP2 and CPC measurements, which could result in inaccuracies in the size-resolved analysis if not corrected. After the time bias is corrected, particle information at each prescribed mobility size, including Hsp, rBC mass, and mixing state, is well characterized by the SP2, and the total aerosol number concentrations are determined by the CPC. In practice, the data collected in the first and last 3 s of each size step are eliminated from the analysis to reduce measurement errors arising from the size alteration.
and show that Hsp varies within a considerable range for each Dmob, owing to the effect of DMA transfer function. Multicharged particles also lead to evidently minor modes of Hsp probability distribution, particularly at sizes with a Dmob < 300 nm. The major mode of Hsp probability distribution, which is induced by singly charged particles, is fitted by a log-normal distribution function. The geometric mean value of Hsp of the log-normal distribution is considered the typical Hsp (Hsp0) corresponding to the given Dmob (Zhao, Zhao, et al. Citation2019; Zhao, Tan, et al. Citation2019). In practice, to ensure adequate data for the fitting, BC-free particles in a 3-hour moving time window are used to establish the probability distribution, as shown in and . Hourly Hsp0 values at each prescribed mobility are obtained. The campaign average Hsp0 values are shown in , which gradually increase as Dmob enlarges. Notably, owing to a lower laser intensity, the Hsp0 value for a given Dmob is evidently lower in winter than summer. Furthermore, because the detectable Hsp is limited within the range of 300–60,000 A/D counts, Hsp0 values within the 178–422 nm Dmob range in summer whereas within the 200–450 nm Dmob range in winter are obtained effectively. Theoretical Hsp values calculated on the basis of Mie theory and EquationEquation (2)(2)
(2) at different Dmob by using an initially guessed RRIsp value of 1.50 and a negligible RI imaginary part (Zhang et al. Citation2018) are comparably shown in . In general, the theoretical Hsp agrees well with the measured Hsp0, indicating the practicability of the particle size estimation from the scattering measurements of the SP2 combined with Mie calculation. However, systematic overestimations in the theoretical Hsp are observed, particularly in winter (red circles in ). The scattering intensity increases gradually with increasing RRIsp (Zhao, Zhao, et al. Citation2019), thus the overestimated theoretical Hsp implies that a high RRIsp (1.50) is likely adopted in the calculation. Thus, we adjust the RRIsp value to constrain the theoretical Hsp consistent with the measured Hsp0 at each prescribed Dmob. Subsequently, size-resolved RRIsp values are obtained hourly within the 178–422 nm Dmob range in summer and within the 200–450 nm range in winter. Notably, morphology is also an essential factor influencing particle scattering intensity beyond size and RI. However, a recent study showed that the dynamic shape factors of BC-free (i.e., they called non-rBC) particles were close to 1 within the 300–500 nm aerodynamic diameter (Dae) (equivalent to ∼240–400 nm physical diameter by assuming a density of 1.5 g cm−3; Cross et al. Citation2007), indicating a spherical structure of BC-free particles in urban Beijing (Liu et al. Citation2020). Thus, the morphology effect on particle scattering calculation is neglected in the current study. Furthermore, because the Hsp0 values are used in the retrieval, the scattering properties of the measured particle ensembles are studied instead of the particle-resolved properties. That is to say, the retrieved RRIsp values represent an effective value of the measured particle ensembles for each given Dmob.
Figure 4. Bulk RRIsp1064nm as function of PM2.5 mass concentrations during summer (blue) and winter (red), with shadow areas representing corresponding standard deviations.
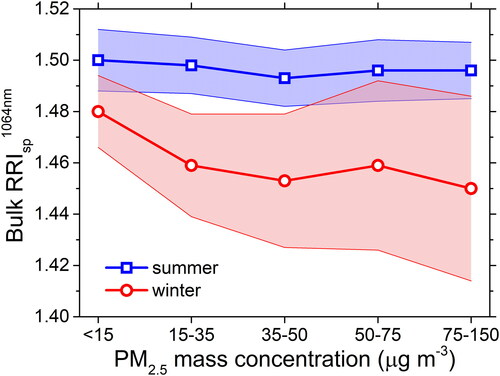
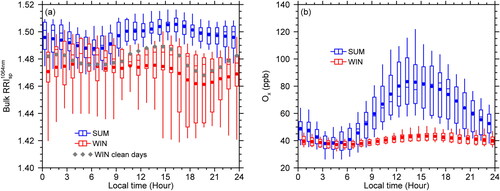
Figure 5. Diurnal variations in (a) bulk RRIsp1064nm and (b) Ox (Ox=NO2+O3) concentrations; the upper and lower whisks of each box represent 90% and 10% percentiles at each hour, respectively, and the upper and lower ends of each box represent 75% and 25% percentiles, respectively; the horizontal line in the box represents the median, and the dot represents the mean value; blue represents results in the summer campaign, and red represents results in the winter campaign; diurnal variations in bulk RRIsp1064nm on clean days in winter with maximum hourly PM2.5 concentrations lower than 20 μg m−3 are shown as gray diamonds in panel (a).
RRIsp at the SP2 laser wavelength 1064 nm (RRIsp1064nm) is retrieved in this study, which may be slightly discrepant to that at a short wavelength in the near-ultraviolet and visible spectra, particularly for particles dominated by organic matter. The clear spectral dependence of the RRI of SOA is observed, with the RRI increasing at short wavelengths (Moise, Flores, and Rudich Citation2015). The spectral dependence of the RRI of inorganic components, such as secondary inorganic aerosol (SIA; including sulfate, nitrate, and ammonium), is not obvious in the near-ultraviolet and visible spectra. Owing to the slight variation in laser intensity (<3%) in each campaign, the uncertainty in the retrieved RRIsp1064nm is estimated to be approximately 0.01 at a prescribed mobility based on Mie theory. Furthermore, because the SP2 is only efficient to detect rBC with mass larger than its lower detection limit (∼0.2 fg), the termed ‘BC-free’ particles in this study are likely to also have small BC fractions, thus have non-ignorable RI imaginary parts. According to the incandescence calibration factor and the criterion of incandescence peak heigh (>500 A/D at high gain) used to discriminate rBC-containing particles, the upper limit rBC mass in individual ‘BC-free’ particles is 0.19 fg. We assume all the termed ‘BC-free’ particles have rBC mass of 0.19 fg to examine the utmost effect of possibly existed RI imaginary parts on the retrieved RRIsp1064nm. A RI imaginary part value of 1.26 (at 1064 nm; Moteki, Kondo, and Nakamura Citation2010) and a density of 1.8 g cm−3 (Bond and Bergstrom Citation2006) is assumed for rBC in the calculation. The RI imaginary part value of a whole particle containing 0.19 fg rBC is calculated using the volume-weighted mixing scheme assuming a zero RI imaginary part value for remaining non-BC components of the particle. The absorption of brown carbon at the IR wavelength of 1064 nm is neglected. The retrieved RRIsp1064nm values are almost the same as those originally derived by assuming pure scattering particles without RI imaginary parts (Figure S6). The absolute biases of the retrieved RRIsp1064nm due to RI imaginary parts are within ±0.002 for all Dmob, which is much smaller compared to the uncertainty (∼0.01) resulted from the slight fluctuation of laser intensity. Considering the both effects of laser intensity fluctuation and possibly existed RI imaginary part, the retrieved RRIsp1064nm for ‘BC-free’ particle ensembles at each prescribed Dmob is expected to have a total uncertainty within 1%.
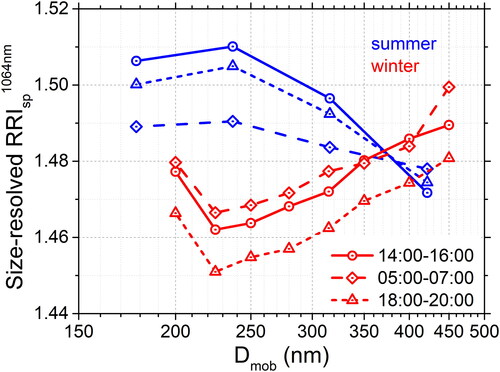
Figure 6. Size-resolved RRIsp1064nm as a function of the Dmob at local times of 14:00–16:00, 05:00–07:00, and 18:00–20:00; blue represents results in summer, and red represents results winter.
2.5. Estimation of bulk RRIsp
Based on the size-resolved RRIsp1064nm, the bulk RRIsp1064nm within the detectable size range (i.e., 178–422 nm in summer and 200–450 nm in winter) is further estimated using a volume-weighting mixing approach. Volume size distribution is inverted from the CPC-measured stepwise particle number concentration beforehand. The inversion approach for the particle number size distribution (dN/dlogDmob) is based on Hagen and Alofs (Citation1983). The charging probability of the neutralizer and transfer function of the DMA are calculated from the parameters and equations provided in the instruction manual of the TSI model 3080 electrostatic classifier. An assumption of the size-independent number fraction of BC-free particles in the total number of particles is employed in the estimation of the bulk RRIsp1064nm. The estimation of the bulk RRIsp1064nm is expressed as
(3)
(3)
where the RRI and dV/dlogDmob with subscript i represent the size-resolved RRIsp1064nm and volume size distribution at a specific Dmob, respectively. In addition, ΔlogDmob is the interval between two consecutive Dmob set on a logarithmic scale. The value of dV/dlogDmob is calculated from the dN/dlogDmob using a spherical assumption. The size-resolved RRIsp1064nm and dV/dlogDmob at four Dmob values of 178 nm, 237 nm, 316 nm, and 422 nm are deployed in the bulk RRIsp1064nm calculation in the summer campaign, and eight Dmob values of 200 nm, 225 nm, 250 nm, 280 nm, 315 nm, 350 nm, 400 nm, and 450 nm are used in the winter campaign. The mass fraction of particles located within the size range, which is employed to calculate the bulk RRIsp1064nm, accounts for approximately 22 ± 9% and 33 ± 16% of the PM2.5 mass concentrations in summer and winter, respectively, by assuming an average particle density of 1.5 g cm−3 (Cross et al. Citation2007). The low integrated mass in summer is likely attributable to coarse size resolution and high mass fraction beyond the concerned PM2.5 size range (i.e., 178–422 nm).
3. Results and discussion
3.1. Seasonal variation in size-resolved RRIsp
Seasonal average RRIsp1064nm varying with Dmob is shown in . Size-resolved RRIsp1064nm values are generally high in summer, thereby leading to a higher bulk RRIsp1064nm, with a mean ± standard deviation of 1.50 ± 0.01, compared with that with a mean rate of 1.47 ± 0.02 in winter. Seasonal discrepancies in the RRIsp1064nm indicate the pronounced differences in aerosol chemical composition in summer and winter. SIA and organic aerosols (OA) are the predominant components of ambient aerosols in Beijing, which contribute more than 80% of the total PM1 mass throughout the year (Sun et al. Citation2015; W. Hu et al. Citation2017). Thus, the RRIsp1064nm in this study is expected to be determined predominantly by SIA and OA, as only submicron scattering particles are measured. The RRI values of the main components of SIA are well known, 1.52 for ammonium sulfate (at approximately 1000 nm) and a high value of 1.55 for ammonium nitrate, which are generally higher than the observed RRIsp1064nm values in summer (1.50) and winter (1.47). This finding implies that OA should have a low RRI on average, such that their mixture with SIA has an RRIsp1064nm as low as the observed values. The possible influence of particle shape (nonsphere vs. sphere) on the RRIsp1064nm is neglected because BC-free particles within the studied diameter range are generally spherical in urban Beijing (Liu et al. Citation2020). Owing to the differing molecular composition, structure and mutability of OA in the atmosphere, obtaining a definite RRI value for OA is difficult. A wide range of RRIs for SOA (1.35–1.66 at various wavelengths in a range of 220–1200 nm) are given in the literature review of Moise, Flores, and Rudich (Citation2015). Nevertheless, compared with the well-known RRI values for SIA, attributing the low RRIsp1064nm in winter to an increase in the contribution of OA submicron particles would be reasonable. Although simultaneous measurements of aerosol chemical composition are absent in this study, previous studies show a significant increase in the mass fraction of OA, particularly less oxidized OA, in PM2.5 or PM1 in winter compared with in summer owing to the increase in coal combustion and/or possible biomass burning for residential heating (Zhang et al. Citation2013; Sun et al. Citation2015; W. W. Hu et al. Citation2016; Zhou et al. Citation2019). Seasonal standard deviation in the bulk RRIsp1064nm (0.02) is higher in winter than in summer (0.01), thereby indicating a larger variation in aerosol composition owing to more diverse emissions sources in winter.
In addition to seasonal discrepancies in the magnitude of the RRIsp1064nm, a clear difference is observed in the size dependence of the RRIsp1064nm in summer and winter. By neglecting the RRIsp1064nm retrieved at the low limit diameter (i.e., 178 nm in summer and 200 nm in winter), which may have considerable uncertainty owing to an imperfect lognormal distribution fitting ( and ), we observe a decreasing RRIsp1064nm trend with an increasing Dmob in summer and a slightly increasing RRIsp1064nm trend in winter (). Despite the ∼1% uncertainty in the retrieved RRIsp1064nm, the size dependence of the RRIsp1064nm seems reliable. The maximum discrepancy in the size-resolved RRIsp1064nm is approximately 0.03 both in summer (1.50 ± 0.01 at 237 nm vs. 1.47 ± 0.01 at 422 nm) and winter (1.46 ± 0.03 at 225 nm vs. 1.49 ± 0.02 at 450 nm). The dependence of RRIsp1064nm on Dmob is likely related to the variation in chemical composition with particle size. Although synchronous measurements of size-resolved aerosol chemical composition are absent, previous studies have showed a relatively stable mass ratio of SIA to OA throughout a Dae range of ∼100–2000 nm in winter (W. W. Hu et al. Citation2016; W. Hu et al. Citation2017). The slightly increasing RRIsp1064nm with Dmob in winter is likely related to more aged (i.e., oxidized) OA in large particles. An increase in the RRI of SOA from a certain precursor (e.g., toluene, α-pinene, or limonene) is observed as diameter changes from ∼180 nm to 360 nm (Moise, Flores, and Rudich Citation2015). However, the size dependence of RRIsp1064nm cannot be simply interpreted by the chemical composition variation with particle size in summer. An evident increase in SIA mass fraction whereas decrease in OA mass fraction with increasing particle size is generally observed in Beijing in summer (W. W. Hu et al. Citation2016; W. Hu et al. Citation2017). Considering the generally higher RRI of SIA than OA, an increasing RRIsp1064nm with Dmob is expected according to the volume-weighting scheme, which contradicts to the observed decrease in RRIsp1064nm as particle size grows in summer. The observed size dependence of RRIsp1064nm in summer in this study is also contrary to that obtained at a suburban site in East China, where the increase in RRIsp1064nm with increasing particle size was attributed to ρeff increase (Zhao, Tan, et al. Citation2019). Thus, we suspect that our observed decrease in RRIsp1064nm with particle size in summer is likely related to a decrease in ρeff. More internal voids may exist in larger particles, resulting in lower ρeff and, in turn, lower RRIsp1064nm. More evidences relevant to size-resolved chemical composition and ρeff are necessary in future studies. A slight increase in ρeff with increasing particle size in Beijing was observed in winter (M. Hu et al. Citation2012), corresponding to the increasing RRIsp1064nm with Dmob.
3.2. Variation in RRIsp with pollution level
Temporal variations in the RRIsp1064nm at a high time resolution of 1 h are presented in . The hourly variations in the size-resolved RRIsp1064nm are generally similar and consistent with those in the bulk RRIsp1064nm (Figure S7); thus, only the hourly bulk RRIsp1064nm is presented. A more dramatic fluctuation in the hourly RRIsp1064nm is observed in winter than in summer, corresponding well to the large standard deviation of the seasonal mean. Generally, wintertime pollution episodes with high PM2.5 concentrations are associated with a dramatic decrease in the RRIsp1064nm (). The bulk RRIsp1064nm values averaged in different PM2.5 segments are presented in . An evident decrease in RRIsp1064nm is observed in winter as PM2.5 mass concentration increases from <15 μg m−3 to >75 μg m−3. During the extremely clean period (with PM2.5<15 μg m−3), the bulk RRIsp1064nm has the largest mean of 1.48 ± 0.01. The lowest RRIsp1064nm with a mean of 1.45 ± 0.04 is observed during polluted period (with PM2.5>75 μg m−3). By contrast, the RRIsp1064nm varies slightly with pollution level in summer, with means of 1.49–1.50 throughout different PM2.5 segments, indicating relatively stable aerosol sources. The decreasing RRIsp1064nm as PM2.5 increases in winter is likely related to the increasing contribution of less oxidized OA, the RRI of which is generally lower than SIA. Northerly gales prevail in extremely period in winter (), bringing continental background aerosols which are generally aged and thus have high RRIsp1064nm values. With the aggravation of air pollution, the contribution of local and/or regional emissions to PM2.5 is likely to increase under the calm/weak southerly conditions (), thereby increasing the fraction of primary and/or less aged aerosols. This is likely to contribute to the evident decrease in RRIsp1064nm. Although numerous previous studies show that an increased SIA contribution is generally observed during heavily polluted periods (e.g., PM2.5>150 μg m−3) in winter, this increase is typically accompanied by high ambient RH, which favors the formation of SIA via a heterogeneous reaction (Wang et al. Citation2016; Ma et al. Citation2017; H. Li, Cheng, et al. Citation2019). However, PM2.5 pollution is generally light during the studied winter period, with the max hourly PM2.5 concentration of 131.5 μg m−3 and a campaign average of 23.5 ± 27.5 μg m−3 (). Furthermore, wintertime RH is generally less than 60%, even during the polluted episodes in this study (), which is unfavorable to the formation of SIA. By comparing aerosol chemical composition during polluted periods under dry and humid conditions, W. W. Hu et al. (Citation2016) found that OA dominates PM1 during the former period, whereas the contribution of SIA increases remarkably during the latter period. Thus, an increase in the contribution of OA (particularly less oxidized OA) is expected under dry conditions, thereby resulting in low RRIsp1064nm values. Notably, large standard deviations are observed when pollution elevates (), indicating more variant emission sources and complicated chemical composition during polluted periods in winter. The decrease in the RRIsp1064nm during polluted periods in winter can also be reproduced by the low RRI (at 1020 nm) of the column-integrated aerosols over Beijing obtained from AERONET (denoted as RRIaeronet1020nm), though RRIaeronet1020nm values are generally high (). Differences in the magnitude of the RRIsp1064nm and RRIaeronet1020nm may result from differences in physicochemical properties between near-surface and column-integrated aerosols as well as from discrepancies arising from the retrieval approaches, which are beyond the scope of this study. We focus mainly on relative variations in the RRIsp1064nm and RRIaeronet1020nm. Owing to considerable water content in aerosol particles resulted from hygroscopic growth under high ambient RH conditions (), the RRIaeronet1020nm is generally lower than the dry aerosol RRIsp1064nm in summer.
Variations in the dependence of RRIsp1064nm on particle size during polluted periods in winter are investigated further. Four polluted episodes are defined with a maximum hourly PM2.5 value exceeding 50 μg m−3, which are denoted as EP1 to EP4 (). The average values of the bulk RRIsp1064nm in EP2, EP3, and EP4 are 1.45 ± 0.02, 1.43 ± 0.03, and 1.44 ± 0.03, respectively, which are obviously lower than the average RRIsp1064nm (1.49 ± 0.01) during the clean period between EP1 and EP2. A slightly lower bulk RRIsp1064nm is observed in EP1, with a mean of 1.48 ± 0.01, compared with the clean period. The generally increasing RRIsp1064nm trend with increasing particle size in winter when the Dmob is larger than ∼250 nm does not change with pollution and is extremely evident in EP2 to EP4. The RRIsp1064nm values in polluted episodes appear to decrease substantially at a Dmob of ∼250 nm (Figure S8). This finding may indicate that the increased contribution of OA (particularly less oxidized OA) with a low RRI is apparent at a Dmob of ∼250 nm in the polluted episodes. Further research accompanied with size-resolved chemical composition during different polluted episodes is necessary.
3.3. Diurnal variations in RRIsp
The chemical composition of aerosols is influenced significantly by aging processes in the atmosphere; thus, diurnal variations in the RRIsp1064nm are investigated further. As shown in , high RRIsp1064nm values are clearly observed in the afternoon, peaking at around 15:00 (hereinafter the local time) in summer. The diurnal variations in the RRIsp1064nm are highly consistent with those in Ox (Ox=O3+NO2) concentrations, which can be considered as a proxy for atmospheric aging caused by photochemical reactions (Canonaco et al. Citation2015), thereby implying the important impact of aging processes on the RRIsp1064nm (). A significant positive correlation is found between hourly bulk RRIsp1064nm and Ox concentrations in summer with an R value of 0.42 (p < 0.001). Aging processes result in the formation of secondary aerosol components, including SIA and SOA, which likely have larger RRIsp1064nm values than primary components. In addition to the increase in the RRIsp1064nm resulting from an increase in SIA, SOA from a certain anthropogenic precursor (e.g., toluene) displays high RRI values at high NOx concentrations (Moise, Flores, and Rudich Citation2015). The diurnal variations in the size-resolved RRIsp1064nm are generally consistent with those in the bulk RRIsp1064nm (not shown). Similar diurnal variations in size-resolved RRIsp1064nm were observed by Zhao, Tan, et al. (Citation2019) in summer. However, no distinct diurnal peak is observed in winter, which has only a minimum value in the evening (around 19:00 local time). The weak diurnal variations in the RRIsp1064nm during daytime in winter are attributable to low Ox concentrations and weak diurnal variations ( and ), which correspond to low atmospheric aging caused by photochemical reactions. High primary aerosol emissions from traffic and residential heating may explain the low RRIsp1064nm values during evenings and at night (M. Hu et al. Citation2012). If only RRIsp1064nm values on clear days (with maximum hourly PM2.5 concentrations lower than 20 μg m−3) are investigated, then a clear double-valley diurnal pattern can be presented (gray diamonds in ). This high RRIsp1064nm value may be attributed to relatively high atmospheric photooxidation in the afternoon, whereas the low RRIsp1064nm values in the evenings and early mornings are likely related to high primary emissions.
The size dependence of the RRIsp1064nm is compared at three typical times, that is, 14:00–16:00, when the RRIsp1064nm reaches its maximum value; in the early morning at 05:00–07:00; and in the evening at 18:00–20:00, when RRIsp is low. As shown in , a decreasing RRIsp1064nm trend as Dmob increases is commonly observed in the three time periods in summer, whereas an increasing RRIsp1064nm trend is observed in winter. The increase in summertime RRIsp1064nm in the afternoon occurs mainly at a Dmob of < 400 nm, likely indicating that secondary aerosols formed by atmospheric photooxidation processes are located mainly in small particle sizes. The more evident increase in the RRIsp1064nm at a Dmob of < 400 nm is also likely related to the higher fraction of BC-free particles in small particle sizes. As shown in Figure S9, the number fraction of non-BC particles decreases from ∼70% at a Dmob of < 400 nm to ∼50% at a Dmob of 422 nm in summer, indicating large particles are more likely to contain BC. This finding implies SIA and/or SOA are more likely to exist solely with BC in small particle sizes, leading to a more evident increase in the RRIsp1064nm compared with large particles. The low RRIsp1064nm during evenings in winter is generally observed throughout the studied Dmob range (200–450 nm), thereby implying the uniform increase in the contribution of less oxidized aerosols at different particle sizes.
4. Conclusions
A DMA-SP2/CPC tandem system was designed and deployed into two field observations to continuously measure size-resolved RRIsp1064nm over a Dmob range of approximately 200 nm to 400 nm. Results are concluded as:
A decreasing RRIsp1064nm trend as Dmob increased from 237 nm to 422 nm was observed in summer, whereas an increasing RRIsp1064nm trend within the Dmob range of 225–400 nm was observed in winter, which likely indicate different variations in aerosol physicochemical properties with particle size in different seasons.
The size-resolved RRIsp1064nm values were generally higher in summer than in winter throughout the studied Dmob range, thereby resulting in a large seasonal average bulk RRIsp1064nm of 1.50 ± 0.01 in summer and a small seasonal bulk RRIsp1064nm of 1.47 ± 0.02 in winter. Submicron particles are generally dominated by SIA and OA (Sun et al. Citation2015; W. Hu et al. Citation2017); thus, the low RRIsp1064nm values in winter were likely attributable to the increased contribution of OA, particularly less oxidized OA, which may have lower RRI values than SIA.
Variations in the RRIsp1064nm were more dramatic in winter than in summer, thereby indicating increased diverse sources of atmospheric aerosols. Owing to the increasing contributions of primary aerosol locally emitted and/or transported from southern polluted regions, pronounced low RRIsp1064nm values were generally observed during polluted episodes in winter. By contrast, the RRIsp1064nm in summer mainly exhibited regular diurnal variations, with high values in the afternoon and low values at night, which corresponded well to diurnal variations in Ox concentrations. High Ox in the afternoon indicated a strong photooxidation, which is favorable to the formation of SIA and/or SOA and resulted in an increase in the RRIsp1064nm. However, chemical composition cannot be employed solely to interpret the decreasing RRIsp1064nm trend with an increasing Dmob in summer, because increased SIA contributions and decreased OA were generally observed as particle size enlarged, which should result in the expected increase in the RRIsp1064nm. Further studies on size-resolved chemical composition and physical properties, such as ρeff, are necessary to obtain an in-depth understanding of the size dependence of the RRIsp1064nm.
Supplemental Material
Download MS Word (1.6 MB)Acknowledgments
We would like to sincerely thank Prof. Aiguo Li and Dr. Yifan Tao from the Institute of Atmospheric Physics for providing the observational meteorological data from the Beijing 325 m-high meteorological tower.
Additional information
Funding
References
- Barkey, B., S. E. Paulson, and A. Chung. 2007. Genetic algorithm inversion of dual polarization polar nephelometer data to determine aerosol refractive index. Aerosol. Sci. Tech. 41 (8):751–60. doi: 10.1080/02786820701432640.
- Bond, T. C., and R. W. Bergstrom. 2006. Light absorption by carbonaceous particles: An investigative review. Aerosol. Sci. Technol. 40 (1):27–67. doi: 10.1080/02786820500421521.
- Cai, Y., D. C. Montague, and T. Deshler. 2011. Comparison of measured and calculated scattering from surface aerosols with an average, a size-dependent, and a time-dependent refractive index. J. Geophys. Res. 116 (D2):D02202. doi: 10.1029/2010JD014607.
- Canonaco, F., J. G. Slowik, U. Baltensperger, and A. S. H. Prévôt. 2015. Seasonal differences in oxygenated organic aerosol composition: implications for emissions sources and factor analysis. Atmos. Chem. Phys. 15 (12):6993–7002. doi: 10.5194/acp-15-6993-2015.
- Cross, E. S., J. G. Slowik, P. Davidovits, J. D. Allan, D. R. Worsnop, J. T. Jayne, D. K. Lewis, M. Canagaratna, and T. B. Onasch. 2007. Laboratory and ambient particle density determinations using light scattering in conjunction with aerosol mass spectrometry. Aerosol. Sci. Technol. 41 (4):343–59. doi: 10.1080/02786820701199736.
- Dubovik, O., and D. King. 2000. A flexible inversion algorithm for retrieval of aerosol optical properties from sun and sky radiance measurements. J. Geophys. Res. 105 (D16):20673–96. doi: 10.1029/2000JD900282.
- Eidhammer, T., D. C. Montague, and T. Deshler. 2008. Determination of index of refraction and size of supermicrometer particles from light scattering measurements at two angles. J. Geophys. Res. 113 (D16):D16206. doi: 10.1029/2007JD009607.
- Espinosa, W. R., J. V. Martins, L. A. Remer, O. Dubovik, T. Lapyonok, D. Fuertes, A. Puthukkudy, D. Orozco, L. Ziemba, K. L. Thornhill, et al. 2019. Retrievals of aerosol size distribution, spherical fraction and complex refractive index from airborne in situ angular light scattering and absorption measurements. J. Geophys. Res. Atmos. 124 (14):7997–8024. doi: 10.1029/2018JD030009.
- Gao, R. S., J. P. Schwarz, K. K. Kelly, D. W. Fahey, L. A. Watts, T. L. Thompson, J. R. Spackman, J. G. Slowik, E. S. Cross, J.-H. Han, et al. 2007. A novel method for estimating lights scattering properties of soot aerosols using a modified single particle soot photometer. Aerosol. Sci. Technol. 41 (2):125–35. doi: 10.1080/02786820601118398.
- Hagen, D. E., and D. J. Alofs. 1983. Linear inversion method to obtain aerosol size distributions from measurements with a differential mobility analyzer. Aerosol. Sci. Technol. 2 (4):465–75. doi: 10.1080/02786828308958650.
- Han, Z. W., J. W. Li, X. A. Xia, and R. J. Zhang. 2012. Investigation of direct radiative effects of aerosols in dust storm season over East Asia with an online coupled regional climate-chemistry-aerosol model. Atmos. Environ. 54:688–99. doi: 10.1016/j.atmosenv.2012.01.041.
- Hand, J. L., and S. M. Kreidenweis. 2002. A new method for retrieving particle refractive index and effective density from aerosol size distribution data. Aerosol Sci. Tech. 36 (10):1012–26. doi: 10.1080/02786820290092276.
- Hu, W. W., M. Hu, W. Hu, J. L. Jimenez, B. Yuan, W. T. Chen, M. Wang, Y. S. Wu, C. Chen, Z. B. Wang, et al. 2016. Chemical composition, sources, and aging process of submicron aerosols in Beijing: Contrast between summer and winter. J. Geophys. Res. Atmos. 121 (4):1955–77. doi: 10.1002/2015JD024020.
- Hu, W., M. Hu, W.-W. Hu, J. Zheng, C. Chen, Y. S. Wu, and S. Guo. 2017. Seasonal variations in high time-resolved chemical compositions, sources, and evolution of atmospheric submicron aerosols in the megacity Beijing. Atmos. Chem. Phys. 17 (16):9979–10000. doi: 10.5194/acp-17-9979-2017.
- Hu, M., J. F. Peng, K. Sun, D. L. Yue, S. Guo, A. Wiedensohler, and Z. J. Wu. 2012. Estimation of size-resolved ambient particle density based on the measurement of aerosol number, mass, and chemical size distributions in the winter in Beijing. Environ. Sci. Technol. 46:9941–7. doi: 10.1021/es204073t.
- IPCC. 2013. Summary for policymakers. In Climate change 2013: The physical science basis. Contribution of Working Group I to the Fifth Assessment Report of the intergovernmental panel on climate change, ed. T. F. Stocker, D. Qin, G.-K. Plattner, M. Tignor, S. K. Allen, J. Boschung, A. Nauels, Y. Xia, V. Bex, and P. M. Midgley. Cambridge, United Kingdom; New York, NY: Cambridge University Press.
- Liao, H., J. H. Seinfeld, P. J. Adams, and L. J. Mickley. 2004. Global radiative forcing of coupled tropospheric ozone and aerosols in a unified general circulation model. J. Geophys. Res. 109 (D16):D16207. doi: 10.1029/2003JD004456.
- Li, H., J. Cheng, Q. Zhang, B. Zheng, Y. Zhang, G. Zheng, and K. He. 2019. Rapid transition in winter aerosol composition in Beijing from 2014 to 2017: response to clean air actions. Atmos. Chem. Phys. 19 (17):11485–99. doi: 10.5194/acp-19-11485-2019.
- Li, J. W., Z. W. Han, X. H. Yao, Z. X. Xie, and S. C. Tan. 2019. The distributions and direct radiative effects of marine aerosols over East Asia in springtime. Sci. Tot. Environ. 651:1913–25. doi: 10.1016/j.scitotenv.2018.09.368.
- Liu, P. F., N. Abdelmalki, H.-M. Hung, Y. Wang, W. H. Brune, and S. T. Martin. 2015. Ultraviolet and visible complex refractive indices of secondary organic material produced by photooxidation of the aromatic compounds toluene and m-xylene. Atmos. Chem. Phys. 15 (3):1435–46. doi: 10.5194/acp-15-1435-2015.
- Liu, Y., and P. H. Daum. 2000. The effect of refractive index on size distributions and light scattering coefficients derived from optical particle counters? J. Aerosol. Sci. 31 (8):945–57. doi: 10.1016/S0021-8502(99)00573-X.
- Liu, Y., and P. H. Daum. 2008. Relationship of refractive index to mass density and self-consistency of mixing rules for multicomponent mixtures like ambient aerosols. J. Aerosol. Sci. 39 (11):974–86. doi: 10.1016/j.jaerosci.2008.06.006.
- Liu, H., X. L. Pan, Y. F. Wu, D. S. Ji, Y. Tian, X. S. Chen, and Z. F. Wang. 2020. Size-resolved mixing state and optical properties of black carbon at an urban site in Beijing. Sci. Tot. Environ. 749:141523. doi: 10.1016/j.scitotenv.2020.141523.
- Li, Z. Q., H. Xu, K. T. Li, D. H. Li, Y. S. Xie, L. Li, Y. Zhang, X. F. Gu, W. Zhao, Q. J. Tian, et al. 2018. Comprehensive study of optical, physical, chemical, and radiative properties of total columnar atmospheric aerosols over China: An overview of Sun–Sky Radiometer Observation Network (SONET) measurements. B. Am. Meteorol. Soc. 99 (4):739–55. doi: 10.1175/BAMS-D-17-0133.1.
- Ma, Q., Y. Wu, D. Zhang, X. Wang, Y. Xia, X. Liu, P. Tian, Z. Han, X. Xia, Y. Wang, et al. 2017. Roles of regional transport and heterogeneous reactions in the PM2:5 increase during winter haze episodes in Beijing. Sci. Total Environ. 599–600:246–53. doi: 10.1016/j.scitotenv.2017.04.193.
- Moffet, R. C., and K. A. Prather. 2005. Extending ATOFMS measurements to include refractive index and density. Anal. Chem. 77:6535–41. doi: 10.1021/ac0503097.
- Moffet, R. C., X. Y. Qin, T. Rebotier, H. Furutani, and K. A. Prather. 2008. Chemically segregated optical and microphysical properties of ambient aerosols measured in a single-particle mass spectrometer. J. Geophys. Res. 113 (D12):D12213. doi: 10.1029/2007JD009393.
- Moise, T., J. M. Flores, and Y. Rudich. 2015. Optical properties of secondary organic aerosols and their changes by chemical processes. Chem. Rev. 115:4400–39. doi: 10.1021/cr5005259.
- Moteki, N., and Y. Kondo. 2007. Effects of mixing state on black carbon measurements by laser-induced incandescence. Aerosol Sci. Technol. 41 (4):398–417. doi: 10.1080/02786820701199728.
- Moteki, N., and Y. Kondo. 2008. Method to measure time-dependent scattering cross sections of particles evaporating in a laser beam. J. Aerosol. Sci. 39 (4):348–64. doi: 10.1016/j.jaerosci.2007.12.002.
- Moteki, N., Y. Kondo, and S. Nakamura. 2010. Method to measure refractive indices of small nonspherical particles: application to black carbon particles. J. Aerosol. Sci. 41 (5):513–21. doi: 10.1016/j.jaerosci.2010.02.013.
- Ren, Y. T., H. Qi, Q. Chen, L. M. Ruan, and H. P. Tan. 2015. Simultaneous retrieval of the complex refractive index and particle size distribution. Opt. Express 23:19328–37. doi: 10.1364/OE.23.019328.
- Schwarz, J. P., R. S. Gao, D. W. Fahey, D. S. Thomson, L. A. Watts, J. C. Wilson, J. M. Reeves, M. Darbeheshti, D. G. Baumgardner, G. L. Kok, et al. 2006. Single-particle measurements of midlatitude black carbon and light-scattering aerosols from the boundary layer to the lower stratosphere. J. Geophys. Res. 111 (D16):D16207. doi: 10.1029/2006JD007076.
- Seinfeld, J. H., and S. N. Pandis. 2006. Atmospheric chemistry and physics: from air pollution to climate change. 2nd ed. Hoboken, NJ: John Wiley & Sons, Inc.
- Sorooshian, A., S. Hersey, F. J. Brechtel, A. Corless, R. C. Flagan, and J. H. Seinfeld. 2008. Rapid, size-resolved aerosol hygroscopic growth measurements: differential aerosol sizing and hygroscopicity spectrometer probe (DASH-SP). Aerosol. Sci. Tech. 42 (6):445–64. doi: 10.1080/02786820802178506.
- Sun, Y. L., Z. F. Wang, W. Du, Q. Zhang, Q. Q. Wang, P. Q. Fu, X. L. Pan, J. Li, J. Jayne, and D. R. Worsnop. 2015. Long-term real-time measurements of aerosol particle composition in Beijing, China: seasonal variations, meteorological effects, and source analysis. Atmos. Chem. Phys. 15 (17):10149–65. doi: 10.5194/acp-15-10149-2015.
- Valenzuela, A., J. P. Reid, B. R. Bzdek, and A. J. Orr-Ewing. 2018. Accuracy required in measurements of refractive index and hygroscopic response to reduce uncertainties in estimates of aerosol radiative forcing efficiency. J. Geophys. Res. Atmos. 123 (12):6469–86. doi: 10.1029/2018JD028365.
- Vratolis, S., P. Fetfatzis, A. Argyrouli, A. Papayannis, D. Müller, I. Veselovskii, A. Bougiatioti, A. Nenes, E. Remoundaki, E. Diapouli, et al. 2018. A new method to retrieve the real part of the equivalent refractive index of atmospheric aerosols. J. Aerosol. Sci. 117:54–62. doi: 10.1016/j.jaerosci.2017.12.013.
- Wang, W., and M. J. Rood. 2008. Real refractive index: Dependence on relative humidity and solute composition with relevancy to atmospheric aerosol particles. J. Geophys. Res. 113 (D23):D23305. doi: 10.1029/2008JD010165.
- Wang, G. H., R. Y. Zhang, M. E. Gomez, L. X. Yang, M. L. Zamora, M. Hu, Y. Lin, J. F. Peng, S. Guo, J. J. Meng, et al. 2016. Persistent sulfate formation from London Fog to Chinese haze. P. Natl. Acad. Sci. USA 113:13630–5. doi: 10.1073/pnas.1616540113.
- Wu, X. Q., J. Liu, Y. F. Wu, X. Wang, X. W. Yu, J. S. Shi, J. R. Bi, Z. W. Huang, T. Zhou, and R. J. Zhang. 2018. Aerosol optical absorption coefficients at a rural site in Northwest China: The great contribution of dust particles. Atmos. Environ 189:145–52. doi: 10.1016/j.atmosenv.2018.07.002.
- Wu, Y. F., Y. J. Xia, R. J. Huang, Z. Z. Deng, P. Tian, X. A. Xia, and R. J. Zhang. 2019. A study of the morphology and effective density of externally mixed black carbon aerosols in ambient air using a size-resolved single-particle soot photometer (SP2). Atmos. Meas. Tech. 12 (8):4347–59. doi: 10.5194/amt-12-4347-2019.
- Zarzana, K. J., C. D. Cappa, and M. A. Tolbert. 2014. Sensitivity of aerosol refractive index retrievals using optical spectroscopy. Aerosol Sci. Tech. 48 (11):1133–44. doi: 10.1080/02786826.2014.963498.
- Zhang, G. H., X. H. Bi, B. X. Han, N. Qiu, S. H. Dai, X. M. Wang, G. Y. Sheng, and J. M. Fu. 2016. Measurement of aerosol effective density by single particle mass spectrometry. Sci. China Earth Sci. 59 (2):320–7. doi: 10.1007/s11430-015-5146-y.
- Zhang, R., J. Jing, J. Tao, S.-C. Hsu, G. Wang, J. Cao, C. S. L. Lee, L. Zhu, Z. Chen, Y. Zhao, et al. 2013. Chemical characterization and source apportionment ofPM2.5 in Beijing: seasonal perspective. Atmos. Chem. Phys. 13 (14):7053–74. doi: 10.5194/acp-13-7053-2013.
- Zhang, Y., H. Su, N. Ma, G. Li, S. Kecorius, Z. Wang, M. Hu, T. Zhu, K. He, A. Wiedensohler, et al. 2018. Sizing of ambient particles from a Single-Particle Soot Photometer Measurement to retrieve mixing state of black carbon at a regional site of the North China Plain. J. Geophys. Res.-Atmos 123:12778–95. doi: 10.1029/2018JD028810.
- Zhao, G., T. Tan, W. Zhao, S. Guo, P. Tian, and C. Zhao. 2019. A new parameterization scheme for the real part of the ambient urban aerosol refractive index. Atmos. Chem. Phys. 19 (20):12875–85. doi: 10.5194/acp-19-12875-2019.
- Zhao, G., W. Zhao, and C. Zhao. 2019. Method to measure the size-resolved real part of aerosol refractive index using differential mobility analyzer in tandem with single- particle soot photometer. Atmos. Meas. Tech. 12 (7):3541–50. doi: 10.5194/amt-12-3541-2019.
- Zhou, W., M. Gao, Y. He, Q. Q. Wang, C. H. Xie, W. Q. Xu, J. Zhao, W. Du, Y. M. Qiu, L. Lei, et al. 2019. Response of aerosol chemistry to clean air action in Beijing, China: Insights from two-year ACSM measurements and model simulations. Environ. Pollut. 255:113345. doi: 10.1016/j.envpol.2019.113345.