
 ?Mathematical formulae have been encoded as MathML and are displayed in this HTML version using MathJax in order to improve their display. Uncheck the box to turn MathJax off. This feature requires Javascript. Click on a formula to zoom.
Abstract
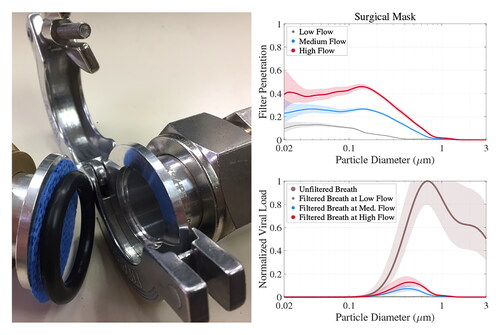
During the current pandemic and in the past, shortages of high quality respirators have forced people to protect themselves with homemade face masks that filter poorly in comparison to N95 respirators and are often designed in ways that makes them susceptible to leaks. Nevertheless, there is compelling epidemiological and laboratory evidence that face masks can be effective in impeding the spread of respiratory viruses such as SARS-CoV2. We explored this apparent inconsistency by developing a simple model of mask performance that estimates reduction of viral load during breathing and speaking as a function of breathing rate, relative humidity, mask surface area and leak size. The model uses viral concentrations measured in primates infected with COVID-19, existing data on exhaled speech and breath aerosol size distributions, and our filtration efficiency measurements of various mask materials with NaCl aerosol between 0.02 µm and 3 µm. Evaluating the model under a few selected conditions, we found that electrostatically charged materials perform the best but most uncharged fabrics remove up to >90% of the viral load on <10 µm particles in humid exhaled air if leaks are avoided, but modeled leaks around the nose dramatically reduce mask performance. As a consequence, when leaks are present, thinner and more breathable fabrics can outperform thicker materials which are less permeable and so force unfiltered air through the leak. The model also shows that most fabric masks provide some protection for the wearer from aerosols exhaled by others and dried to ambient humidity, reducing inhaled viral load by ∼20% when leaky and by ∼70% if sealed. Generally, masks with more surface area provide better protection.
Graphical Abstract
EDITOR:
1. Introduction
Respiratory viruses such as influenza and SARS-CoV-2 (severe acute respiratory syndrome coronavirus 2) are detectable in the fluids of the upper respiratory tract of infected people (Leung et al. Citation2020; To et al. Citation2020; Wölfel et al. Citation2020) and can be expelled from the nasal and oral cavity within giant liquid aerosols, often referred to as droplets, that are formed when mucus and saliva layers break up during sneezing and coughing (Chao et al. Citation2009; Han, Weng, and Huang Citation2013) and even speaking (Johnson et al. Citation2011; Asadi et al. Citation2019). The largest of these, with diameters >100 µm, rapidly settle to surfaces. Particles with diameters of a few tens of microns quickly lose water and shrink in relatively dry ambient air, so fall slowly and can remain airborne for extended periods. Even smaller aerosols are generated during these activities (Johnson et al. Citation2011; Morawska et al. Citation2009; Zayas et al. Citation2012) that can stay airborne for hours but originate from deeper inside the respiratory tract.
Interest in these tiny aerosols, that are in fact the result of normal breathing, reaches back almost a century, but it was not until the late 1990s that exhaled breath aerosol was analyzed comprehensively with a laser-based optical particle counter (Papineni and Rosenthal Citation1997). These observations have since been repeated with other measurement techniques yielding divergent results (Johnson et al. Citation2011; Asadi et al. Citation2019; Morawska et al. Citation2009) but also reproduced multiple times (Almstrand et al. Citation2010; Holmgren et al. Citation2010; Schwarz et al. Citation2010; Larsson et al. Citation2017), confirming the notion of two breath modes with average number concentration mode diameters around 0.95 µm and 3.36 µm at the high relative humidity (RH) of around 99.5% inside the respiratory tract. The RH inside the respiratory tract is just below 100% because respiratory fluids can be modeled as an aqueous NaCl solution with a water activity (equivalent to RH) of 0.995 (Holmgren et al. Citation2011).
The larger of these two breath modes originates from an area around the vocal cords (larynx mode) where air turbulence ruptures the laryngeal mucus layer during exhalation (Johnson and Morawska Citation2009), while the smaller mode originates deep in the lungs. Studies show that these tiny aerosols form during inhalation when the lining fluid inside the lungs stretches and ruptures during reopening of the bronchioles that close during exhalation (Almstrand et al. Citation2010; Schwarz et al. Citation2010; Malashenko, Tsuda, and Haber Citation2009). A single study found an even smaller lung mode created in the lungs with a mean diameter near 0.15 µm (Holmgren et al. Citation2010) at 99.5% RH, which is supported by numerical modeling (Malashenko, Tsuda, and Haber Citation2009). Given these findings face masks not only have to protect against giant droplets produced during sneezing, coughing and speaking but also against submicrometer aerosol. This is particularly important as these fine particles are readily inhaled deep into the respiratory tract of a susceptible individual (Heyder et al. Citation1986).
To calculate the viral load reduction due to a face mask, we need to know how viruses are distributed on these exhaled aerosols and the size-dependent filtration efficiency of the mask. The former is not well documented but can be approximated from measurements of size distributions of exhaled aerosols and observations of viral concentrations in the respiratory fluids that generate the particles. Filtration efficiency of a face mask depends on the physical characteristics of the material, breathing rate, relative humidity and any leaks through which aerosols can bypass the mask.
Filtration efficiency of all conventional filters and masks, including homemade fabric masks rely on three mechanism to trap particles. Aerosols larger than about 0.3 µm are collected mainly via inertial impaction and interception, while particles smaller than that are most efficiently deposited by Brownian diffusion. None of the three mechanisms are very effective around 0.3 µm, so purely mechanical filters perform poorly in that size range. Certified filtering facepiece respirators (FFR) and some surgical masks use electret filter materials that have permanent positive and/or negative electrostatically charged sites to enhance particle collection through the Coulomb force (attracting charged particles) and the dielectric effect (attracting neutral aerosols via charge separation within the particles). Together, these effects allow electret materials to efficiently collect 0.3 µm particles and exhibit much smaller most penetrating particle sizes (MPPS) than non-electret materials.
Testing common materials for emergency use as mask materials is nothing new (e.g., Cooper, Hinds, and Price Citation1983; Rengasamy, Eimer, and Shaffer Citation2010; Jung et al. Citation2014; Shakya et al. Citation2017), but since the beginning of the pandemic, many more papers have been written about the filtration efficiency of various fabrics and masks made from them. Most of the studies evaluated many materials, concentrating on filtration performance, and did not address leaks or the size distribution of virus-containing aerosols. For instance, Konda et al. (Citation2020) found that cotton could rival N95 respirators near 0.3 µm, which is a great surprise, and that adding layers did not multiply filtration efficiency as one would expect. On the other hand, Drewnick et al. (Citation2021) tested a great variety of materials and found that N95 and surgical masks were superior to cotton filters. They showed that layering filters behave as predicted from filtration theory with pressure drops additive and filtration efficiency multiplicative, and that random, or “fluffy” cloths performed better than smooth fabrics. They also did a crude physical test of leaks by punching holes in the material, finding that small holes greatly compromised the filters. An article from Joo et al. (Citation2021) tested a variety of common materials and found that cotton fabrics blocked 20 to 60% of sub-µm particles, largely in agreement with Drewnick et al. (Citation2021) and the pre-pandemic studies mentioned above. In another work, Morais et al. (Citation2021) tested an impressive 227 face masks used in Brazil and came to conclusions much like Joo et al. (Citation2021), adding that nonwoven materials are preferable, which is no surprise. Early in the pandemic, Asadi et al. (Citation2020) tested actual masks on real people, but could only measure particles exhaled through the masks; air leaking around the edges could not be sampled. They found that surgical masks worked as well as KN95 respirators. They also tested article towels and masks made from t-shirt material, which proved relatively ineffective.
Common fabric masks cannot replace FFRs in health care settings but there is compelling epidemiological (Lyu and Wehby Citation2020; Chu et al. Citation2020; Mitze et al. Citation2020) and laboratory evidence (Leung et al. Citation2020; Chan et al. Citation2020; Fischer et al. Citation2020; Asadi et al. Citation2020) that such masks impede the spread of viruses such as influenza and SARS-CoV-2, even though they only filter a small fraction of submicrometer aerosol number concentration (e.g., Cooper, Hinds, and Price Citation1983; Rengasamy, Eimer, and Shaffer Citation2010; Jung et al. Citation2014; Shakya et al. Citation2017; Drewnick et al. Citation2021). The effectiveness of fabric masks may be attributed to the synergy of two effects. The first one is that the number of viruses on exhaled aerosols, or viral load, is not proportional to aerosol number concentration but instead approximately proportional to aerosol volume, so most of the viruses are on larger particles that are more efficiently filtered as previous studies indicate (Cooper, Hinds, and Price Citation1983; Shakya et al. Citation2017; Drewnick et al. Citation2021). For example, particles with a diameter of 3 µm have 1000 times the aerosol volume of 0.3 µm aerosols so are far more important to filter. The second effect is that, should infection occur, exposure to a lower viral load can cause a less severe disease. This has been shown previously for influenza (Paulo et al. Citation2010) and recent research suggests this may also be the case for the SARS-CoV-2 virus (Guallar et al. Citation2020; Van Damme et al. Citation2021). The aim of this study is therefore to explore in what way face masks of various materials can reduce SARS-CoV-2 viral load so epidemiological models that study the spread of COVID-19 (coronavirus disease 2019) can be improved. Our study builds on recent mask performance research (Bazant and Bush Citation2021; Drewnick et al. Citation2021) by adding a simple leak model to the ongoing discussion, that aims to highlight how leaks affect the ability of various types of masks to reduce exposure to exhaled SARS-CoV-2 viral load.
A recent article by Schmitt and Wang (Citation2021) describes an extensive model extending from particle generation from respiratory fluids, exhaled through a mask (or not), entering a room with prescribed humidity and ventilation rates, inhaled through a mask (or not) by another person a known distance away and deposited at particular locations in the respiratory tract. Our goal here is much more modest: to estimate what fraction of viral particles are intercepted by masks, either exhaled by infected mask wearers, or inhaled by healthy people in the presence of infected people. All of the essential parts of our model are included in that of Schmitt and Wang (Citation2021), but there are some significant differences that will be discussed throughout this article.
In this work, we measured filtration efficiency as function of size and breathing rate and implemented a simple model that considers leaks and humidity. We applied this model to exhaled breath and speech aerosol <10 µm in diameter to study two scenarios. The first considers exhalation through the mask or how well masks protect others when the wearer is infected with COVID-19. The second scenario regards inhalation through the mask, which reflects the protection afforded to wearers of masks from SARS-CoV-2 viruses exhaled by infected people. Inputs to the model are the size- and flow-dependent filter penetration fraction, which we measured for several mask materials; the breathing rate of the mask wearer; the effective filtering area of the mask; the relative humidity (RH); and an approximate diameter of any leaks that bypass the mask. These are combined with the estimates of the size distribution of virus-containing particles discussed above to produce the viral load reduction, the fraction of viral particles that are intercepted by the mask.
The next section shows how we obtained mask filtration efficiency and the distribution of viruses on exhaled aerosols and how these are implemented in the model. Justifications for all chosen mask model assumptions can be found in Sec. 2.3.
2. Material and methods
2.1. Retrieval of mask filtration efficiency
2.1.1. Instrument setup
The Hawaii Group for Environmental Aerosol Research (HiGEAR) instrumentation suite was repurposed for this work to challenge a variety of proposed alternative mask materials with sodium chloride (NaCl) aerosol in a manner similar to the NIOSH (National Institute for Occupational Safety and Health) certification procedures for respirators. Test aerosol was generated by nebulizing a solution of NaCl (0.02 g ml−1) and ultra pure deionized water with a particle generator (B&F Medical Supplies, LLC) then adding desiccated filtered air to reduce RH well below the 45% efflorescence point of NaCl. All flows were regulated by flow controllers (Alicat Scientific) to ensure a stable aerosol concentration during experiments. This produced a monomodal log-normal particle size distribution with a geometric mean diameter of 0.115 µm and a standard deviation of 2.27. The dried particles were then diluted in a mixing chamber with filtered room air to a concentration of 1100 cm−3 (see flow chart in ).
Figure 1. Aluminum hose adapters used as filter holder with a single layer of Halyard H600 (top) and flow schematic for low flow sodium chloride aerosol tests (bottom). The exhaust of the APS was redirected to the sheath flow and the flow controller was set to 1.05 L min−1. This ensured a small flow (0.05 L min−1) through the pressure equalization tube and reduced the flow to the APS to 1.05 L min−1 while ensuring that the sheath and sample flows were at the same pressure. For the medium and high flow rates, the APS was operated normally, with 5 L min−1 drawn from the sample line, with 4 L min−1 used for sheath flow.
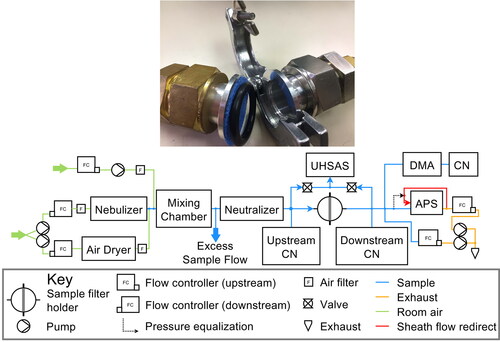
The aerosol passed through a 210Po-based charge neutralizer (a custom housing with 3 Staticmaster 2U500, NRD), before it reached the sample material. This neutralization of test aerosol is an important step because air friction charges test aerosols during the nebulization process (Chen et al. Citation2018). If left untreated, charged test aerosol can artificially enhance filtration efficiency of test materials because it induces charge separation in oncoming particles (dielectric effect) once trapped on the material fibers. Filter material samples were cut out of masks or sheets and clamped into a filter holder made from NW 25 ISO-KF hose adapters (MKS Instruments; exposed area of the filter sample is 6.88 cm2). To avoid changing filter performance due to contamination or crushing, samples were handled only near their edges, outside the region exposed to airflow, and were stored in clean polyethylene bags when not in use. No backup screen was used to prevent deformation at high air flow rates; such stretching would occur during heavy breathing while masks were in use, so should not be prevented during testing.
NaCl aerosol number concentrations were determined with condensation nuclei counters (0.01 µm to 3 µm, CN 3010, TSI) up- and down-stream of the filter holder during the experiment. Particle size distributions were measured with 3 instruments: a long Differential Mobility Analyzer (0.01 µm to 0.5 µm, LDMA 3071 A, TSI), an Ultra High Sensitivity Aerosol Spectrometer (0.06 µm to 1 µm, UHSAS, DMT) and an Aerodynamic Particle Sizer (0.5 µm to 10 µm, APS 3321, TSI). The UHSAS has been shown to agree well with the LDMA for NaCl aerosol (Howell et al. Citation2020). APS aerodynamic diameters were converted to geometric diameter using the dry NaCl density of 2.16 g.cm−3. For low flow rate tests, the APS was replumbed to recycle 3.95 of the 4 L min−1 sheath flow from the exhaust, reducing its demand to 1 L min−1 sample flow plus 0.05 L min−1 to ensure that sheath air remains at the sample line pressure despite the notoriously leaky pumps in the APS.
2.1.2. Face velocity
Material tests were conducted at face velocities of 2.7 cm s−1, 8 cm s−1, 22.7−1. The NIOSH testing protocol for N95 respirators uses 85 L min−1, which is a face velocity of 7.5 cm s−1 for a typical respirator with a surface area of 189 cm2 (Roberge et al. Citation2010), but it is useful to have a range of flow rates to account for variable surface areas of homemade masks as well as breathing rates. Breathing rates are typically given as minute volume (MV), the volume of air inhaled in one minute. We assumed that breathing can be divided equally into 3 parts (inhalation, holding breath, and exhalation) and that inhalation and exhalation occur at constant flow rates. Since inhalation occupies 1/3 of the time, flow rates while inhaling (and exhaling) are 3 times MV. Mask surface area and MV are related to face velocity
under leak-free conditions via
(1)
(1)
where
is the mask flow rate and
the velocity through the filter holder (see Sec. 2.3 for values of
in leak model). The assumption of constant flow rates while inhaling and exhaling greatly simplifies the model, as one only has to consider a single flow rate rather than integrating over the breathing cycle. We note that assuming sinusoidal breathing would give very similar results: peak flow during a sinusoid is
and most of the flow volume occurs near the maximum flow rate. Figures in George et al. (Citation2005) appear to show that constant rates are at least as good an approximation of real breathing as sinusoids. Of course real breathing is neither constant nor sinusoidal, particularly when speaking, singing, and coughing. The model could be modified to integrate over a breathing cycle, but other difficulties, such as effective mask area and leaks, are undoubtedly larger sources of error.
2.1.3. Filtration efficiency
Filter penetration fraction (FPF) is the ratio of particles penetrating the filter to those in the incoming air. It is a function of both particle size and flow rate, so was calculated as the ratio of average downstream () to upstream (
) concentration in each size bin at each flow rate. We corrected for any changes in nebulizer output by normalizing the size distributions to the upstream CN (UCN) concentration during the upstream (
) and downstream (
) periods:
(2)
(2)
Upstream and downstream size distributions were obtained by averaging overlapping instrument data from the 3 aerosol sizers used: we consider LDMA data below 0.45 µm, UHSAS data above 0.13 µm and APS measurements above 0.35 µm. Note, the UHSAS switched between up- and downstream aerosol with samples in place, while the higher flow rate LDMA and APS measurements were obtained with and without mask material in the filter holder. Sampling periods included at least two full LDMA scans, each of which were 60 s long.
Since FPF is a ratio, instrument errors, counting efficiency issues and flow-dependent tubing losses cancel each other when calculating measurement uncertainty so the error range depends mainly on the stability of the aerosol generation over time. Since EquationEquation (2)
(2)
(2) accounts for overall concentration changes, it is the shape of the distribution that must be evaluated. Nebulizer variability was certainly the same during upstream and downstream periods, so we used the size-dependent fractional standard deviation ε (standard deviation/mean) of the upstream distributions (
) over the course of the whole experiment. The
estimated error range is then
(3)
(3)
In the middle of the size distribution, where particle concentrations were high,
is 5 to 10%, with lower values when we extended sampling periods. Errors rose near the ends of the distribution because few particles were produced and perhaps the nebulization of those particles were more variable. Fractional errors were also high at very low FPF as too few particles were allowed through to get good counting statistics.
2.1.4. Air flow resistance
We measured air flow resistance or mask breathability because it is needed to calculate viral load reduction for face mask with leaks (see below).
is a velocity-independent constant for each filter material because pressure drop increases linearly with face velocity in the laminar flow regime enforced by the narrow, tortuous paths through the material.
was obtained by measuring pressure drop
across materials using the internal pressure sensor of the UHSAS unit (replumbed to measure pressure in the sample line). The effect on pressure readings induced by varying tubing length between up- and downstream setting was accounted for by assessing pressure drop
at a given
with no material in the filter holder.
then becomes
(4)
(4)
2.2. Retrieval of viral load
2.2.1. Approximating SARS-CoV-2 viral load in exhaled aerosols
Because it is not well-known how SARS-CoV-2 viruses are distributed in exhaled aerosols (Liu et al. Citation2020), we approximated it from observations of size distributions of exhaled aerosols of healthy people and SARS-CoV-2 viral concentrations measured in the respiratory fluids of primates infected with COVID-19 (see Sec. 2.3 for justification).
It is notoriously difficult to measure exhaled size distributions from healthy people since exhalation flow rates are highly variable, the size range is vast, there is considerable person-to-person variation, and particle size is strongly dependent on humidity (Gregson et al. Citation2022), so there are relatively few studies published, all have limitations on the size ranges covered, and the results frequently conflict (see the supplementary material, which describes our method to harmonize several pepers). There is no standard way to report or correct size distributions for the inevitable changes in humidity between respiratory tract and measurements. Many recent papers used distributions measured with APSs (e.g., Johnson et al. Citation2011) but neglected earlier papers that used optical particle counters (OPCs) and DMAs, which are capable of measuring smaller particles (e.g., Papineni and Rosenthal Citation1997; Almstrand et al. Citation2010; Holmgren et al. Citation2010).
The APS-centered studies of Johnson et al. (Citation2011) and Asadi et al. (Citation2019) were limited to particles >0.5 µm, and APS sizing is tenuous at the low end of their detection range. Since we were interested in those particles large enough to contain viruses (0.1 µm (Cascella et al. Citation2020)) and likely to penetrate filters with MPPS ∼0.3 µm, we opted to combine studies using APSs with those that used optical particle sizers and DMAs. This entailed taking averaged number concentration size distributions from several studies (Papineni and Rosenthal Citation1997; Almstrand et al. Citation2010; Holmgren et al. Citation2010; Johnson et al. Citation2011; Schwarz et al. Citation2010; Larsson et al. Citation2017; Asadi et al. Citation2019), making humidity corrections for every study, density corrections for APSs, and refractive index corrections for the optical measurements and harmonizing the resulting distributions. The full process is described in the supplementary material. All of the non-APS studies revealed an aerosol mode, apparently produced in the lungs, with dry diameters near 0.3 µm, too small for an APS to characterize.
The humidity adjustment was necessary because the concentration of water in exhaled particles at high humidity is a very strong function of RH, so even small deviations in humidity can cause significant changes in particle diameter. We assumed that particles were formed from respiratory fluids that behaved like NaCl solutions with water activity (equivalent to RH) of 0.995 (Holmgren et al. Citation2011). We used the droplet size changes with humidity determined with electrodynamic balance by Cohen, Flagan, and Seinfeld (Citation1987), which agree very closely with the corrections determined by Holmgren et al. (Citation2011) and by Liu et al. (Citation2017), which was used by Schmitt and Wang (Citation2021). All observations were reconciled by converting from measurement humidity to 50% and 99.5% RH as discussed in Sec. 2.3. Each size distribution consisted of only two modes, the smaller lung and larger larynx mode, because we ignored particles larger than 10 µm in diameter (see Sec. 2.3 for justification).
The average number size distributions for breath and speech were converted to aerosol volume and multiplied by virus concentrations in respiratory fluids to obtain size distributions of viral load or viral copies as illustrated in . The virus concentrations in respiratory fluids were drawn from Munster et al. (Citation2020), who reported the maximum SARS-CoV-2 viral concentration in bronchoalveolar fluid and throat swabs of rhesus macaques infected with COVID-19 at around 108 and 107 copies per mL, respectively (see supplementary material). Similar observations have been made in humans infected with the disease (Pan et al. Citation2020), if sputum is regarded as proxy for bronchoalveolar fluid (i.e., sputum is coughed up from the trachea and bronchi).
Figure 2. (a) Size distributions of viral copies (dC/dlogDp) for breath (brown) and speech (purple) aerosol constructed from several earlier studies as documented in the supplement. Solid and dashed lines represent 50% and 100% RH conditions, respectively, illustrating the decrease in particle diameter and so aerosol volume due to evaporation of water after particles are expelled. dC/dlogDp units are arbitrary as discussed in the supplement. (b) Same as (a) but normalized to the maximum value to illustrate distribution shape.
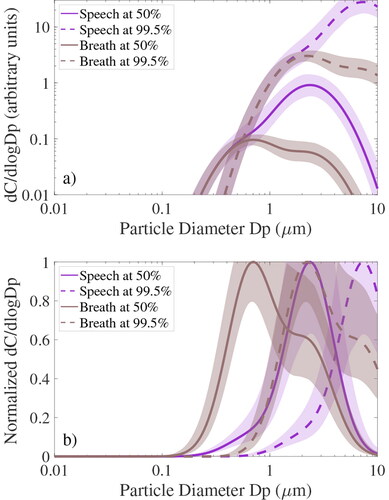
This order of magnitude difference in virus concentrations means that the lung mode, which is only a tiny fraction of exhaled particulate volume and unquantifiable in APS-only work, has a much larger share of the viral load than might be expected, and is near the size most likely to penetrate mechanical masks. This means our model viral size distribution is quite unlike that of Schmitt and Wang (Citation2021), whose indicates that over half of the viral load from quiet breathing is >10 µm even after the particles dry out. In contrast our shows that most of the viral load from quiet breathing is below 1 µm at 50% RH. This has profound implications for materials that inefficiently filter sub-micrometer particles.
2.2.2. Viral load reduction without leaks
In the absence of leaks, the viral load reduction (expressed as a percentage) is
(5)
(5)
where
is the integral of the exhaled viral load size distribution (
) and
the viral load penetrating the face mask, which is the integral of the product of the size distribution of viral load and filter penetration fraction. FPF varied considerably with face velocity
so was included in the calculation of
by interpolating between FPF data measured at the three face velocities.
2.2.3. Viral load reduction with leaks
To estimate VLR under more realistic conditions, with poorly fitted masks that leak on either side of the nose, we modeled leak paths as a pair of tubes 3 cm long and 1 cm in diameter. Some of the virus-laden air still goes through the mask, but the rest will divert through the leaks and remain unfiltered. VLR including the leak then becomes
(6)
(6)
where
and
are flows through the leak, the mask and the total exhalation (or inhalation) rates, respectively. This relationship simplifies to EquationEquation (5)
(5)
(5) if leaks are eliminated (
). The flow rates
and
are not immediately known but must satisfy the requirement that the pressure drops across face mask
(see EquationEquations (1)
(1)
(1) and Equation(4)
(4)
(4) ) and leak
are equal. This condition is described by a set of nonlinear equations, which were iteratively solved for
and
(7)
(7)
with leak length
and diameter
air density
(at 298.15 K and 1013.25 hPa), number of leaks
air viscosity μ, and the flow Reynolds number Re, which indicates laminar flow when below 2100 (
via equations 6.1.4, 6.2.11 and 6.2.12 in chapter 6 of Bird, Stewart, and Lightfoot (Citation2022)). The supplementary material contains the complete Matlab code to easily run the leak model. This calculation is almost identical to that of Schmitt and Wang (Citation2021), who used square rather than circular leak paths and did not include turbulent flow.
Our leak model reproduced lab measurements of the total inward leakage of NaCl aerosol (Rengasamy, Eimer, and Szalajda Citation2014), defined as the sum of aerosols that make it through a N95 respirator as well as leaks, to within 10% when we input the study’s test aerosol distribution and the dimensions of the tubes that were used as leak paths through a N95 respirator. We assumed their N95 respirator had the same filtration efficiency signatures and pressure drop as the N95 8210 tested here. This shows our leak EquationEquations (6)(6)
(6) and Equation(7)
(7)
(7) are reasonable, but does not address whether our assumption of a small cylindrical leak on each side of the nose is realistic.
This question is not easily answered because it would require a complex assessment of mask effectiveness in a population that would not only have to consider various mask designs but also face shapes and even the care with which a face mask is worn. We felt that such an attempt is completely impractical to model as epidemiological studies are much better suited to address this (e.g., Mitze et al. Citation2020). The simple leak model developed instead intends to highlight how leaks, pressure drop and filter efficiency interact and when masks are effective and when they fail to protect.
2.3. Model scenarios and assumptions
The aim of this work was not a complex assessment of mask effectiveness in a population. Our simple model was intended to highlight how leaks, pressure drop and filter efficiency interact and how this can affect face mask performance. A key assumption we had to make is that the exhaled particle size distributions for breath and speech from healthy subjects are the same as those from individuals infected with COVID-19, because there is a lack of observations. A recent study by Edwards et al. (Citation2021), who studied monkeys infected with COVID-19, showed that overall exhaled particle concentration increases with viral load but did not show that the shape of the exhaled size distribution changed significantly during infection. Previous research on the influenza virus suggests that our assumption may be reasonable (Fabian et al. Citation2008).
We defined two scenarios at relative humidities of 99.5% and 50% so an otherwise complex dynamic particle evaporation process (that depends on mask design, leak size, face shape, aerosol residence time and many more) could be simplified to discussing face mask performance at maximum/minimum RH, which is synonymous with a best-case/worst-case filtration performance as shown in Sec. 3.2. We chose 99.5% because respiratory fluids can be modeled as an aqueous NaCl solution with a water activity (equivalent to RH) of 0.995 (Holmgren et al. Citation2011). A humidity of 50% for ambient “dry” air was selected because it is reasonably representative of typical conditions and aqueous NaCl particles do not shrink much below this point (less than 10%) as shown earlier (Cohen, Flagan, and Seinfeld Citation1987; Holmgren et al. Citation2011; Schmitt and Wang Citation2021).
The model only included exhaled particles <10 µm in diameter because most fabrics filter particles above 3 µm with very high efficiencies as previously indicated (Cooper, Hinds, and Price Citation1983; Shakya et al. Citation2017; Drewnick et al. Citation2021) and also shown in this study. Some larger particles >10 µm may slip through the leaks we considered in our model, but their number is likely to be small compared to those inertially impacted onto the mask because they cannot make the sharp turns required to escape through a leak on each side of the nose (modeled as tubes 3 cm long and 1 cm in diameter). The larger particles may not be ignored for bigger leaks or different leak types (i.e., around the cheek), but most fabric masks cannot be considered efficient anymore if leaks are larger than what was considered in our model as discussed below. Additionally, in order to keep the model simple we ignored sneezing and coughing, because these violent expulsion events at very high face velocity are impractical to model. We also did not have the means to test materials at this flow rate in the laboratory (see Sec. 2.1.2).
Given these assumptions, one can select a mask surface and a breathing rate or minute volume MV, convert to
with the help of EquationEquation (1)
(1)
(1) , so the non-linear equations of our leak model can be solved (Sec. 2.2.3). EquationEquation (1)
(1)
(1) was also used to convert the selected MV to
so FPF, which is a strong function of
as shown below, could be interpolated between FPF data made at the three face velocities.
3. Results and discussion
3.1. Filtration efficacy of various materials
The filtration performance of various fabrics and electret materials has been discussed before (e.g., Cooper, Hinds, and Price Citation1983; Rengasamy, Eimer, and Shaffer Citation2010; Serfozo et al. Citation2017; Shakya et al. Citation2017; Lam et al. Citation2019; Ou et al. Citation2020; Drewnick et al. Citation2021; Schmitt and Wang Citation2021) so we focus this discussion on one material out of each filter category in this study (): a strongly electret KN95 mask (“white KN95”; Chinese N95 equivalent), a weakly electret surgical-style mask (“Berkshire”) and a self-made mask that consisted of 2 fabric layers, one made of rayon and the other of Ponte de Roma (“Allison mask”). All other materials are only briefly summarized below. shows descriptions of all 20 materials tested in this study together with for each filter material, determined by averaging
at medium and high face velocities. Low flow tests were excluded since pressure differences were small compared to the measurement uncertainty of the UHSAS pressure sensor.
Figure 3. (Top) Measured filter penetration fraction (FPF) at low, medium and high face velocity in gray, blue and red, respectively, for 3 selected face masks (see title). (Bottom) Size distribution of viral copies ( normalized to its maximum value) for unfiltered dry breath aerosol at 50% RH in brown color (same as ). Bottom plots also illustrate dry breath
after filtration (which is simply the product of
times FPF) at 3 selected flows (same as top row). Shading in all graphs illustrates measurement uncertainty (
) around the mean (solid lines).
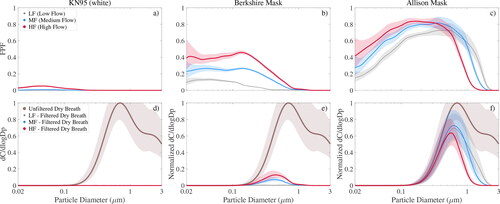
Table 1. Description and air flow resistance of tested filter materials.
To test whether our experiment was set up correctly, we compared fabrics against two cutouts from N95 respirators, 3 M models 8210 and 8000. These respirator types filter aerosol at efficiencies of 95% (Lee, Grinshpun, and Reponen Citation2008; Rengasamy, Eimer, and Shaffer Citation2009; He et al. Citation2013; Lam et al. Citation2019) or close to this value (Gao et al. Citation2016) at NIOSH standard flow rates around their MPPS. For N95 respirators this size is 0.04 µm to 0.1 µm in diameter (Lee, Grinshpun, and Reponen Citation2008; Rengasamy, Eimer, and Shaffer Citation2009; He et al. Citation2013; Lam et al. Citation2019; Gao et al. Citation2016), which agrees well with our results (see Figure S2 in the supplementary material). Higher velocity data showed FPFs for both models considerably exceeded 5% (red in Figure S2) consistent with earlier observations (Mostofi et al. Citation2011).
The strong electret trapping mechanism that makes N95 respirators so efficient without increasing resistance to airflow (Kanaoka et al. Citation1987), was also evident in the two tested KN95 masks that showed comparable FPF values ( and Figure S2 for the second model). However, while the “black KN95” had air flow resistance or mask breathability () similar to the N95 material, the “white KN95” was about two times harder to breathe through because the material was considerably thicker. As shown in the next section, this can have a profound effect on mask performance when leaks are present, because the increased flow resistance of the white KN95 mask forces more air through the leaks compared to N95 respirators. Note that the tested KN95-type models did not have the rigid hemispheric design of N95 respirators so are referred to as masks here.
The weakly electret Berkshire mask we tested had FPF values considerably below those of N95 respirators (), because these masks were generally thinner and more permeable than respirators (compare pressure drops in ), reducing time for particle trapping as air flowed through the material. A lower fiber charge density also played a role in its decreased filtration performance (Lathrache, Fissan, and Neumann Citation1986; Huang et al. Citation2013). Note that the wide variety of reported FPFs (5% to 95% at MPPS of 0.04 to µm 0.35 µm in diameter (Grinshpun et al. Citation2009; Lee, Grinshpun, and Reponen Citation2008; He et al. Citation2013; Rengasamy, Eimer, and Szalajda Citation2014)) indicates that some surgical-style masks lack an electret filtration layer. We also examined three electret air filters that show FPF distributions similar to the surgical-style mask because these materials are also designed for low air flow resistance (Lam et al. Citation2019) (3M Filtrete 1500 and 2500, Blue Air filter; see Figure S3). Of the 3 air filters only Filtrete 2500 outperformed the surgical-style mask at diameters above 0.1 µm, the approximate size of viruses such as influenza and SARS-CoV-2 (Rossman and Lamb Citation2011; Cascella et al. Citation2020). Halyard H600 was another weakly electret (Ou et al. Citation2020) material tested (Figure S3c). It is used as surgical wrap in hospitals and was proposed by medical professionals as mask material early in the pandemic (Univ. of Florida, Dept. of Anesthesiology, last access January 7, 2021, https://anest.ufl.edu/clinical-divisions/mask-alternative/, 2020). The material consisted of two easily separable layers (colored blue and white), which when tested had significantly different air flow resistance () but almost identical FPF, comparable to recent findings (Ou et al. Citation2020) and to the Berkshire mask although H600 would be harder to breathe through.
Homemade fabric masks such as the “Allison mask” lack electret material, so had considerably worse FPF between 0.7 and 0.85 () and MPPS around 0.3 µm. However, at higher flow velocities (in red) but more importantly larger diameters above about 1 µm this mask showed a decent filtration performance, which was of critical importance when evaluating viral load reduction (see below). The other 8 tested household materials (shown in Figure S3g–o) exhibited comparable MPPS and FPF with the exception of the coffee filter and dust cover fabric, which performed worse. FPF values above 3 µm were zero except for the coffee filter and dust cover fabric, which have been extrapolated beyond 3 µm. Our observations agreed well with previous household material studies that reported FPFs around 60–90% near their MPPS (Cooper, Hinds, and Price Citation1983; Rengasamy, Eimer, and Shaffer Citation2010; Jung et al. Citation2014; Shakya et al. Citation2017; Drewnick et al. Citation2021). As in earlier observations (Cooper, Hinds, and Price Citation1983) we observed a sharp increase in filtration efficiency above 1 µm with efficiency reaching 100% near 3 µm for all tested fabrics except the dust cover.
3.2. Viral load reduction of face masks
We begin in Sec. 3.2.1 by emphasizing the effect of leaks and mask surface area on mask performance for the “worst case” or dry breath scenario (see Sec. 2.3) because face masks performed the worst in this scenario that considered the smallest aerosol. Breath particles tend to be smaller in size than speech aerosols and dry particles have shrunk and are hence smaller in size than freshly expelled droplets. The effect of humidity during inhalation and exhalation is discussed in Sec. 3.2.2 for breath and speech, and a generalization of our results is presented in Sec. 3.2.3.
3.2.1. The effect of leaks and mask area
In the absence of leaks, the size-dependent viral load penetrating the mask is just the product of and FPF, shown in EquationEquation (5)
(5)
(5) and illustrated for dry breath at 50% RH in the bottom row of for the selected materials of each filter category. We show filtered
for low, medium and high face velocity in gray, blue and red, respectively, while dry breath
before filtration is shown in brown. The ratio of both quantities then gives VLR (EquationEquation (5)
(5)
(5) ), which was nearly 100% at all flow rates for the white KN95 mask () and somewhat lower for the weakly electret surgical-style mask (). The Allison fabric mask performed the worst but still gave a VLR value between 55% and 67% (depending on the face velocity), which was surprisingly good for a homemade fabric mask. The reason for this is the synergy of two effects: most SARS-CoV-2 viruses on exhaled aerosols are on larger particles (as indicated by the brown line) and fabrics masks showed a sharp increase in filtration efficiency above 1 µm. Because of this, fabric masks such as the Allison mask managed significant VLR despite their poor FPF for sub-µm particles ().
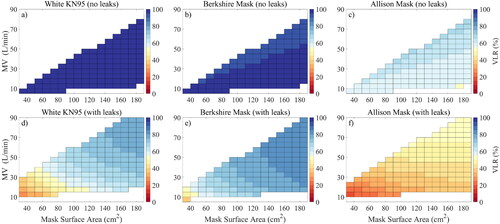
Unfortunately, as we see all around us, few masks actually fit tightly enough to seal, so some exploration of the effect of leaks is necessary. As a simple approximation for gaps on each side of the nose in the absence of a stiff nose bridge strip, we assumed two leaks with a diameter of 1 cm each, comparable to that of a small finger of a human hand. The effect of such leaks on the filtration performance of our selected masks of each category is shown in , where the top and bottom row illustrate model results without and with leaks, respectively. also shows the dependency of VLR (color) on face mask surface area and breathing rate or minute volume MV. We chose the distribution of SARS-CoV-2 viruses on dry breath aerosol at 50% RH again (brown line in ), so we could illustrate the mask’s performance at representative ambient conditions (masks of course perform better for humid breath or speech as discussed below because these come with much larger volume mean diameters as shown in ). Unsurprisingly, illustrates the dramatic drop in mask performance when leaks are present as shown recently (Drewnick et al. Citation2021). For example, VLR for the white KN95 mask was nearly 100% without leaks regardless of MV or
(), but decreased to 27% for a surface area of 31 cm2 and a breathing rate of 10 L min−1, which corresponds to resting activity according to a study from Zuurbier et al. (Citation2009), who studied typical breathing rates for various human activities. Breathing rates of 30 and 86 L min−1 were associated to moderate and strenuous activity levels (Zuurbier et al. Citation2009). A similar performance drop was observed for the Berkshire mask, while the performance drop was less pronounced for the Allison mask. This is because the filtration efficiency of the Allison mask was much lower compared to the two electret materials (top row in ), so the viral load escaping through leaks was closer to the viral load slipping through the fabric mask. Overall, this showed that none of modeled masks (with a surface area of 31 cm2) could be considered efficient for dry breath aerosol during activities such as desk work if leaks are larger than those considered in our model. , however, also shows that increasing
can dramatically boost mask performance, when leaks are present, because a larger mask surface area reduces the pressure drop across the mask so more air goes through the mask instead of the leak. Hence, a good mask design should aim to maximize surface area. also highlights a smaller dependency on breathing rate, which was most pronounced for the Allison mask, because its filtration efficiency varied substantially with flow rate around 1 µm where much of the viral load on exhaled breath particles is ().
Figure 4. Viral load reduction (VLR) as function of face mask surface area and minute volume MV for dry breath aerosol (at 50% RH) for 3 selected face masks (see title). Model results without and with leaks are shown in the top and bottom row, respectively. Uncolored regions are outside the measured face velocities.
3.2.2. Exhalation versus inhalation: the effect of relative humidity
The space between face and mask is usually small and its volume is quickly displaced by 99.5% RH air from the respiratory tract so the majority of exhalation through the mask is at this RH. This means mask performance can be expected to be considerably higher than what was discussed above (at a humidity of 50%), when considering how well masks protect others from a mask wearer, who is infected with COVID-19 (“community protection”). A humidity of 50%, however, is reasonably representative of ambient conditions. Lower RHs would cause the particles to shrink more, but only by about 10% (Cohen, Flagan, and Seinfeld Citation1987; Holmgren et al. Citation2011). This means that this RH can be used to model inhalation of particles through the mask that have shrunk in ambient “dry” air so may be suited to study the minimum protection afforded to wearers of masks from SARS-CoV-2 viruses exhaled by infected people (“self-protection”). Higher ambient RHs will of course yield higher protection.
We show mask performance for all tested masks and respirators for these “dry” and humid conditions in , where VLR for breath at 50% and 99.5% RH is shown in graphs (a) and (b), respectively, while speech aerosol is shown in the two bottom plots. The 20 tested materials are separated (by dashed lines) into 3 categories: non-electret fabrics and weakly and strongly electret filters (see title). Our 3 selected masks are highlighted in bold font on the bottom. We show model results for all materials in form of a stacked bar chart that illustrates model runs with and without leaks in orange and gray, respectively. To obtain these results, we limited our analysis to a fixed breathing rate. We chose an MV of 10 L min−1, which represents the worst-case scenario for non-electret face masks as discussed above. Our choice of a small surface area ( = 31 cm2; assuming a spherical cap shape with a diameter of 3 cm and height of 1 cm) for all face masks but the two N95 respirators assumed that only a small region around the nose and mouth are available while inhaling, as many fabric masks tend to collapse against the face. This is likely to be an underestimate for some masks such as the KN95 (even more so when exhaling as masks may inflate), but was intended as worst-case scenario. We assumed a
of 189 cm2 for the two rigid and hemispheric N95 respirators as measured earlier (Roberge et al. Citation2010).
Figure 5. Model results for fixed breathing rate MV of 10 L min−1 for tested masks separated into 3 categories (see title). Model results with and without leaks are colored orange and gray, respectively. VLR is shown for breath at 50% and 99.5% RH in plots (a) and (b), while dry and humid speech are shown in plots (d) and (c), respectively.
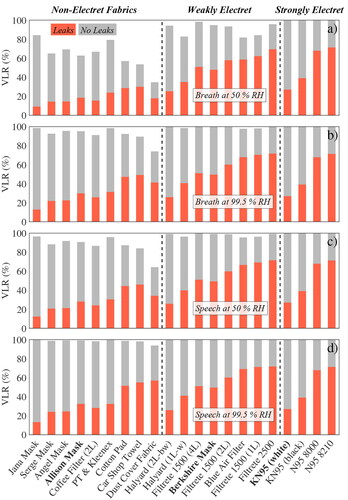
Both the N95 respirators and the KN95 masks exhibited identical VLR signatures for all 4 scenarios of dry/humid breath/speech () because each filter had a VLR value of nearly 100% under leak-free conditions (gray colored bars) and because their VLR value under leaky conditions only depended on the amount of unfiltered air passing through the leaks (shown in ), which was of course independent of humidity and exhaled aerosol size distribution. More importantly, these data showed that N95 respirators only reduced viral load by about 70% with small leaks present, which was merely 20% more than the average VLR value for non-electret fabrics such as the Allison mask in all scenarios but dry breathing (top graph). Non-electret fabrics performed poorly in this case (most VLRs < 20%) as discussed above (). The two tested KN95 masks performed even worse than N95 respirators with leaks present, because their was much smaller (1/6 of a N95 respirator), which increased flow resistance pushing more unfiltered air through the leak. As discussed above, the small
was likely an underestimate for some KN95 models but was intended as worst-case scenario since the ones tested here would deflate during inhalation.
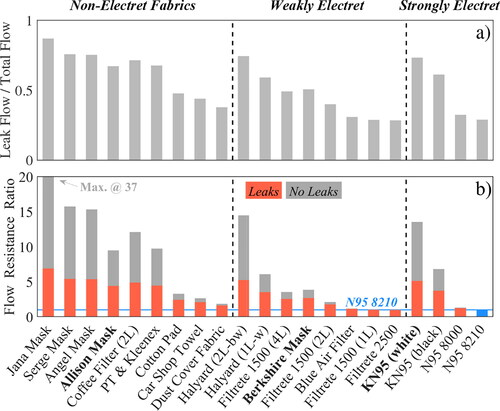
Figure 6. Model results for fixed breathing rate MV of 10 L min−1 for tested masks separated into 3 categories (see title). Model results with and without leaks are colored orange and gray, respectively. Plot (a) shows the ratio of leak flow to total flow (flow through mask and leaks), while plot (b) shows the mask flow resistance (or breathability) of selected materials in comparison to a N95 8210 respirator (blue solid line in background). The higher the flow resistance ratio is, the harder it is to breathe through compared to a N95 8210 respirator.
The results shown in are not directly comparable to any of the plots in Schmitt and Wang (Citation2021), but it is obvious that our results are far more pessimistic than theirs. Their shows cotton mask material reducing inhaled viral load of breathing (not speaking or coughing) aerosol by nearly 3 orders of magnitude or 99.9%, while our numbers run around 65%. The most obvious reason is that their virus size distribution placed most of the viral load at >10 µm, where all of the filter materials are extremely effective, whereas we found that viruses are concentrated near 1 µm, as shown in . A similar discrepancy exists for exhaled aerosol, which we found was reduced by about 90%, or one order of magnitude, while Schmitt and Wang (Citation2021) showed a drop of 5 to 8 orders of magnitude.
When small leaks around the nose were included, the four face masks provided by Hawaiian mask makers (termed “Jana,” “Serge,” “Angel” and “Allison” mask) showed the lowest VLR values of all tested materials around 10–25% depending on scenario with exception of the “Allison” mask (orange bars in ), even though their FPF distributions were comparable to the other household materials (see Figure S3). This was because these 3 masks were made out of multiple fabric layers or very tightly woven cotton () reducing the mask’s permeability and consequently forcing unfiltered air through the leaks instead (). Hence, while recent recommendations to double-mask are valuable to the extent that they may improve fit and so reduce leaks (Brooks et al. Citation2021), our results showed that double-masking can have the opposite effect if leaks are still present. The other effect of low permeability was that these 3 masks were about 5 times harder to breathe through than a N95 respirator when leaks were present as shown in . The graph shows mask flow resistance (or breathability) of selected materials in comparison to a N95 8210 respirator highlighting how much harder it is to breathe through compared to the respirator (blue solid line in background). When properly sealed, the 3 thicker Hawaiian masks provided exceptional protection with VLR values >90% in all cases except dry breath but were 15–37 times harder to breathe through than a N95 respirator making them less comfortable to wear and thus less likely to be used in the community. Non-woven materials like felted cotton (cotton pad), rayon (car shop towel) or polypropylene (dust cover) may be an alternative as they showed high breathability and increased VLR performance with leaks present but slightly lower protection when properly sealed. However, of the 9 non-electret materials tested the “Allison” mask, made out of two easily breathable rayon layers, may be the best design compromise since it yielded intermediate VLR values in the leak scenario and >90% in all cases except dry breath when properly sealed.
The 8 tested weakly electret materials had VLR values in between those of household materials and N95 respirators in accordance with their FPF (e.g., ). The surgical-style Berkshire mask was in the middle of the spectrum reducing viral load by 50% with leaks and nearly 100% when sealed. Halyard H600 showed the same filtration performance when sealed but decreased VLR values when leaks were present due to its high pressure drop. Filtrete and Blue Air filters were at the upper end of the VLR spectrum but it may be challenging to make masks from these thin materials. Their test results, however, were encouraging indicating effective air filtration in enclosed spaces such as class rooms or office spaces is possible with these filters.
Overall, if we consider 99.5% RH air as representative for exhalation through a face mask, we found that electrostatically charged materials provided the best “community protection,” but that even most non-electret materials removed up to >90% of the viral load in exhaled particles <10 µm in diameter, if leaks were avoided. Modeled leaks around the nose dramatically reduced mask performance to 20–40% as unfiltered air bypassed the mask. As a consequence, when leaks are present, thinner and more breathable fabrics can outperform thicker materials that generally filter more effectively but are also less air-permeable. Assuming a humidity of 50% is reasonably representative for inhalation of particles through the mask (“self-protection”), the model also showed that most fabric masks provide some protection for the wearer from aerosols exhaled by others reducing inhaled viral load by ∼20% when leaky and by ∼70% if sealed. One should keep in mind that the apparently good VLR performance of most masks for speech aerosol is slightly misleading, as it is largely an artifact of the enhanced larynx mode, which is effectively filtered. The lung mode aerosol is still produced, so the absolute risk does not become negligible (compare ).
3.2.3. Optimizing mask designs
When considering mask design, there are a few rules that are worthwhile to keep in mind. The most important is that the mask should fit well, preventing leaks by the nose, under the chin, and out the sides. If leaks are avoided, all of the materials we tested except the polypropylene dust cover reduce exhaled viral load by infected people by 90% or more and protect the mask wearer from inhaled particles with a VLR of at least 50% from aerosols exhaled by others. Any leaks severely compromise that protection. But leaks are very difficult to avoid, as people who wear glasses often experience when their lenses fog up.
In an environment rife with virus-containing aerosols, only the N95 masks (and well-designed equivalents) can offer near 100% protection when users are trained to fit masks properly and eliminate leaks. Such discipline is rare, and in real medical environments, surgical masks with electret elements often perform as well or better than N95s despite their slightly worse FPF. KN95 masks should be treated with caution; the ones we tested showed FPFs comparable to N95s, but had high pressure drops and designs prone to leaking, so offered little or no benefit over the surgical mask we tested. Other KN95 models may be better or worse.
Among the weakly electret filters, the ones intended for HVAC had very low pressure drops and moderate FPF, so would potentially make effective masks, but are not designed for use against the skin, so a thin layer of comfortable material against the face might be essential. The Filtrete 2500 was particularly effective, and two layers would provide VLR superior to the surgical mask at a lower pressure drop. With the exception of the Halyard H600, any of the weakly electret materials would provide superior protection to all of the purely mechanical filter materials. (The H600 had similar FPF values, but had such a high pressure drop that leaks would be difficult to avoid. It was not designed as a filter and would be useful in a mask only at low flow rates.)
If electret materials are not available, one has to choose a purely mechanical filter. The tradeoff between pressure drop and FPF was particularly notable for these. The woven and knitted fabrics had superior FPF when compared to the non-woven article and felted samples (the coffee filter had 2 layers and the article towel/kleenex had 5 layers, so their per-layer FPF was poor), but the non-woven materials had much lower pressure drops. That is a well known aspect of filters; most of the fibers in a knitted or woven fabric are twisted together into thread, offering little surface area to impact particles but serving to block airflow. Thus the cotton pad and car shop towel outperformed all of the other non-electret materials when leaks were present.
For electret materials, additional mask area is always beneficial, as it reduces air velocity, allowing the Coulomb and dielectric forces more time to attract particles. The situation is more complicated for non-electret materials, as the higher velocity associated with small mask areas improves impaction and interception. If there are no leaks, smaller mask areas actually improve VLR, as is evident in . However, if masks leak, flows through the leaks increase with smaller mask areas, so VLR is reduced, as seen in .
For most of the mask materials we tested, adding layers is counterproductive; each layer adds fully to the pressure drop while intercepting fewer particles than previous layers. That makes the masks harder to breathe through and more uncomfortable while making leaks worse. Layering can be useful in some circumstances: materials that have an exceptionally low pressure drops and moderate FPFs can benefit from layering; well-fitted cloth masks can aid in sealing a poorly fitted electret mask to ones face; and inner layers of pleasant-feeling material can protect one from irritating electret materials while simultaneously protecting the electret element from skin oils.
There are other elements of mask design that are not addressed here. People must be willing to wear masks, so style and comfort are serious considerations. To the extent possible, masks should be easy to breathe through, not irritate skin, and should not chafe ears. For many people, masks that offer only moderate protection but look and feel good are more likely to be effective than high quality but unattractive or uncomfortable masks that they hesitate to wear.
4. Conclusions
In summary, our model showed that the decent performance of simple non-electret face masks is the synergy of two effects: their excellent filtration performance above 1 µm and the fact that the majority of exhaled viral load is found above this diameter. In other words, face masks let a large portion of exhaled aerosols through because most of these are smaller than 1 µm in diameter, but block most of the viral load, which is carried on larger particles. A particle with a diameter of 3 µm has 1000 times the viral load of a 0.3 µm aerosol so is far more important to filter. While this means the nearly complete protection required in hospitals is only achieved with a properly fitted N95 respirator, it also reinforces the importance of wearing face masks in public during a pandemic.
A limitation of our study is that we only considered two small leaks around the nose in our model. Other leak scenarios are absolutely possible in the real world and can be estimated from our findings. It becomes clear from that larger leaks or more leaks (e.g., leaks on the side as are common for most surgical masks) do not add much to the discussion around mask function and effectiveness: except for the two N95 respirators tested and a few of the electret materials all other masks materials were only around 50% or less effective with two leaks each 1 cm in diameter (orange color in ). Larger or more leaks would decrease this number further so a conclusion of our simple model is: if leaks are bigger than those around the nose, masks do not provide substantial protection against breath/speech aerosols <10 µm. In the future, it would be valuable to develop testing procedures involving real masks on real faces to evaluate the accuracy of our leak model. Some interesting developments have happened along this line, as in Asadi et al. (Citation2020), but much work remains to fully characterize leaks and their effects on mask performance.
Authors’ contributions
S.F. and S.G.H. conceived the project and designed and conducted the experiment. S.F. did much of the data processing and analysis and wrote the manuscript. S.G.H. helped with model development, data analysis and preparation of manuscript. K.T.C.J. helped with originating the project, conducted initial tests and contributed to paperwriting.
Data and code availability
All data and developed code are attached as a supplement to this article.
Supplemental Material
Download PDF (597.6 KB)Supplemental Material
Download Zip (10.3 MB)Acknowledgments
We appreciate the help of Ian Wasnich who did initial breathing efficiency tests of household materials at Oceanit laboratory. We are grateful to the Hawaiian designers and face mask makers Jana Lam, Allison Izu, Angel Yanagihara and Sergey Negrashov and would especially like to thank Gabi Weiss for bringing researchers and mask makers together. We thank Antony Clarke for helpful comments.
Disclosure statement
The authors declare no competing interests.
Additional information
Funding
Related Research Data
References
- Almstrand, A.-C., B. Bake, E. Ljungström, P. Larsson, A. Bredberg, E. Mirgorodskaya, and A.-C. Olin. 2010. Effect of airway opening on production of exhaled particles. Journal of Applied Physiology 108 (3):584–8. doi:10.1152/japplphysiol.00873.2009.
- Asadi, S., C. D. Cappa, S. Barreda, A. S. Wexler, N. M. Bouvier, and W. D. Ristenpart. 2020. Efficacy of masks and face coverings in controlling outward aerosol particle emission from expiratory activities. Sci. Rep. 10 (1):1–13. doi:10.1038/s41598-020-72798-7.
- Asadi, S., A. S. Wexler, C. D. Cappa, S. Barreda, N. M. Bouvier, and W. D. Ristenpart. 2019. Aerosol emission and superemission during human speech increase with voice loudness. Sci. Rep. 9 (1):2348. doi:10.1038/s41598-019-38808-z.
- Bazant, M. Z, and J. W. M. Bush. 2021. A guideline to limit indoor airborne transmission of COVID-19. Proc. Natl. Acad. Sci. U.S.A. 118 (17):e2018995118. doi:10.1073/pnas.2018995118.
- Bird, R. B., W. E. Stewart, and E. N. Lightfoot. 2022. Transport phenomena. 2nd ed. New York: Wiley. doi:10.1115/1.1424298.
- Brooks, J. T., D. H. Beezhold, J. D. Noti, J. P. Coyle, R. C. Derk, F. M. Blachere, and W. G. Lindsley. 2021. Maximizing fit for cloth and medical procedure masks to improve performance and reduce SARS-CoV-2 transmission and exposure, 2021. MMWR Morb. Mortal. Wkly. Rep. 70 (7):254–7. doi:10.15585/mmwr.mm7007e1.
- Cascella, M. M. Rajnik, A. Cuomo, S. C. Dulebohn, and R. Di Napoli. 2020. Features, evaluation and treatment coronavirus [Internet]. StatPearls Publishing. https://www.ncbi.nlm.nih.gov/books/NBK554776/.
- Chan, J. F.-W., S. Yuan, A. J. Zhang, V. K.-M. Poon, C. C.-S. Chan, A. C.-Y. Lee, Z. Fan, C. Li, R. Liang, J. Cao, et al. 2020. Surgical mask partition reduces the risk of noncontact transmission in a golden Syrian hamster model for Coronavirus Disease 2019 (COVID-19). Clin. Infect. Dis. 71 (16):2139–49. doi:10.1093/cid/ciaa644.
- Chao, C., M. Wan, L. Morawska, G. Johnson, Z. Ristovski, M. Hargreaves, K. Mengersen, S. Corbett, Y. Li, X. Xie, et al. 2009. Characterization of expiration air jets and droplet size distributions immediately at the mouth opening. J. Aerosol Sci. 40 (2):122–33. doi:10.1016/j.jaerosci.2008.10.003.
- Chen, H., Z. Zhang, Z. Zhang, F. Jiang, and R. Du. 2018. Enhancement of filtration efficiency by electrical charges on nebulized particles. Particuology 37:81–90. doi:10.1016/j.partic.2017.07.008.
- Chu, D. K., E. A. Akl, S. Duda, K. Solo, S. Yaacoub, H. J. Schünemann, A. El-harakeh, A. Bognanni, T. Lotfi, M. Loeb, et al. 2020. Physical distancing, face masks, and eye protection to prevent person-to-person transmission of SARS-CoV-2 and COVID-19: A systematic review and meta-analysis. The Lancet 395 (10242):1973–87. doi:10.1016/S0140-6736(20)31142-9.
- Cohen, M. D., R. C. Flagan, and J. H. Seinfeld. 1987. Studies of concentrated electrolyte solutions using the electrodynamic balance. 1. Water activities for single-electrolyte solutions. J. Phys. Chem. 91 (17):4563–74. doi:10.1021/j100301a029.
- Cooper, D. W., W. C. Hinds, and J. M. Price. 1983. Emergency respiratory protection with common materials. Am. Ind. Hyg. Assoc. J. 44 (1):1–6. doi:10.1080/15298668391404275.
- Drewnick, F., J. Pikmann, F. Fachinger, L. Moormann, F. Sprang, and S. Borrmann. 2021. Aerosol filtration efficiency of household materials for homemade face masks: Influence of material properties, particle size, particle electrical charge, face velocity, and leaks. Aerosol Sci. Technol. 55 (1):63–79. doi:10.1080/02786826.2020.1817846.
- Edwards, D. A., D. Ausiello, J. Salzman, T. Devlin, R. Langer, B. J. Beddingfield, A. C. Fears, L. A. Doyle-Meyers, R. K. Redmann, S. Z. Killeen, et al. 2021. Exhaled aerosol increases with COVID-19 infection, age, and obesity. Proc. Natl. Acad. Sci. U.S.A. 118 (8):e2021830118. doi:10.1073/pnas.2021830118.
- Fabian, P., J. J. McDevitt, W. H. DeHaan, R. O. P. Fung, B. J. Cowling, K. H. Chan, G. M. Leung, and D. K. Milton. 2008. Influenza virus in human exhaled breath: An observational study. PLoS One. 3 (7):e2691–6. doi:10.1371/journal.pone.0002691.
- Fischer, E. P., M. C. Fischer, D. Grass, I. Henrion, W. S. Warren, and E. Westman. 2020. Low-cost measurement of facemask efficacy for filtering expelled droplets during speech. Sci. Adv. 6 (36): eabd3083, doi:10.1126/sciadv.abd3083.
- Gao, S., J. Kim, M. Yermakov, Y. Elmashae, X. He, T. Reponen, Z. Zhuang, S. Rengasamy, and S. A. Grinshpun. 2016. Performance of N95 FFRs against combustion and NaCl aerosols in dry and moderately humid air: Manikin-based study. ANNHYG. 60 (6):748–60. doi:10.1093/annhyg/mew019.
- George, R., S. S. Vedam, T. D. Chung, V. Ramakrishnan, and P. J. Keall. 2005. The application of the sinusoidal model to lung cancer patient respiratory motion. Med. Phys. 32 (9):2850–61. doi:10.1118/1.2001220.
- Gregson, F. K. A., S. Sheikh, J. Archer, H. E. Symons, J. S. Walker, A. E. Haddrell, C. M. Orton, F. W. Hamilton, J. M. Brown, B. R. Bzdek, et al. 2022. Analytical challenges when sampling and characterising exhaled aerosol. Aerosol Sci. Technol. 56 (2):160–75. doi:10.1080/02786826.2021.1990207.
- Grinshpun, S. A., H. Haruta, R. M. Eninger, T. Reponen, R. T. McKay, and S.-A. Lee. 2009. Performance of an N95 filtering facepiece particulate respirator and a surgical mask during human breathing: Two pathways for particle penetration. Journal of Occupational and Environmental Hygiene 6 (10):593–603. doi:10.1080/15459620903120086.
- Guallar, M. P., R. Meiriño, C. Donat-Vargas, O. Corral, N. Jouvé, and V. Soriano. 2020. Inoculum at the time of SARS-CoV-2 exposure and risk of disease severity. Int. J. Infect. Dis. 97:290–2. doi:10.1016/j.ijid.2020.06.035.
- Han, Z. Y., W. G. Weng, and Q. Y. Huang. 2013. Characterizations of particle size distribution of the droplets exhaled by sneeze. J. R. Soc. Interface 10 (88):20130560. doi:10.1098/rsif.2013.0560.
- He, X., T. Reponen, R. T. McKay, and S. A. Grinshpun. 2013. Effect of particle size on the performance of an N95 filtering facepiece respirator and a surgical mask at various breathing conditions. Aerosol Sci. Technol. 47 (11):1180–7. doi:10.1080/02786826.2013.829209.
- Heyder, J., J. Gebhart, G. Rudolf, C. Schiller, and W. Stahlhofen. 1986. Deposition of particles in the human respiratory tract in the size range 0.005–15 μm. J. Aerosol Sci. 17 (5):811–25. doi:10.1016/0021-8502(86)90035-2.
- Holmgren, H., B. Bake, A.-C. Olin, and E. Ljungström. 2011. Relation between humidity and size of exhaled particles. J. Aerosol. Med. Pulm. Drug Deliv. 24 (5):253–60. doi:10.1089/jamp.2011.0880.
- Holmgren, H., E. Ljungström, A.-C. Almstrand, B. Bake, and A.-C. Olin. 2010. Size distribution of exhaled particles in the range from 0.01 to 2.0μm. J. Aerosol Sci. 41 (5):439–46. doi:10.1016/j.jaerosci.2010.02.011.
- Howell, S. G., S. Freitag, A. Dobracki, N. Smirnow, I. I. I. Sedlacek, and A. J. 2020. Undersizing of aged African biomass burning aerosol by an ultra high sensitivity aerosol spectrometer. Atmos. Meas. Tech. Discuss. 2020:1–28. doi:10.5194/amt-2020-416.
- Huang, S.-H., C.-W. Chen, Y.-M. Kuo, C.-Y. Lai, R. McKay, and C.-C. Chen. 2013. Factors affecting filter penetration and quality factor of particulate respirators. Aerosol Air Qual. Res. 13 (1):162–71. doi:10.4209/aaqr.2012.07.0179.
- Johnson, G. R., and L. Morawska. 2009. The mechanism of breath aerosol formation. J. Aerosol Med. Pulm. Drug Deliv. 22 (3):229–37. doi:10.1089/jamp.2008.0720.
- Johnson, G., L. Morawska, Z. Ristovski, M. Hargreaves, K. Mengersen, C. Y. H. Chao, M. Wan, Y. Li, X. Xie, D. Katoshevski, et al. 2011. Modality of human expired aerosol size distributions. J. Aerosol Sci. 42 (12):839–51. doi:10.1016/j.jaerosci.2011.07.009.
- Joo, T., M. Takeuchi, F. Liu, M. P. Rivera, J. Barr, E. S. Blum, E. Parker, J. H. Tipton, J. Varnedoe, B. Dutta, et al. 2021. Evaluation of particle filtration efficiency of commercially available materials for homemade face mask usage. Aerosol Sci. Technol. 55 (8):930–42. doi:10.1080/02786826.2021.1905149.
- Jung, H., J. K. Kim, S. Lee, J. Lee, J. Kim, P. Tsai, and C. Yoon. 2014. Comparison of filtration efficiency and pressure drop in anti-yellow sand masks, quarantine masks, medical masks, general masks, and handkerchiefs. Aerosol Air Qual. Res. 14 (3):991–1002. doi:10.4209/aaqr.2013.06.0201.
- Kanaoka, C., H. Emi, Y. Otani, and T. Iiyama. 1987. Effect of charging state of particles on electret filtration. Aerosol Sci. Technol. 7 (1):1–13. doi:10.1080/02786828708959142.
- Konda, A., A. Prakash, G. A. Moss, M. Schmoldt, G. D. Grant, and S. Guha. 2020. Aerosol filtration efficiency of common fabrics used in respiratory cloth masks. ACS Nano 14 (5):6339–47. doi:10.1021/acsnano.0c03252.
- Lam, T.-N., C.-H. Wu, S.-H. Huang, W.-C. Ko, Y.-L. Huang, C.-Y. Ma, C.-C. Wang, and E.-W. Huang. 2019. Multi-scale microstructure investigation for a PM2. 5 air-filter efficiency study of non-woven polypropylene. QuBS 3 (4):20. doi:10.3390/qubs3040020.
- Larsson, P., B. Bake, A. Wallin, O. Hammar, A.-C. Almstrand, M. Lärstad, E. Ljungström, E. Mirgorodskaya, and A.-C. Olin. 2017. The effect of exhalation flow on endogenous particle emission and phospholipid composition. Respir. Physiol. Neurobiol. 243:39–46. doi:10.1016/j.resp.2017.05.003.
- Lathrache, R., H. Fissan, and S. Neumann. 1986. Deposition of submicron particles on electrically charged fibers. J. Aerosol Sci. 17 (3):446–9. doi:10.1016/0021-8502(86)90127-8.
- Lee, S.-A., S. A. Grinshpun, and T. Reponen. 2008. Respiratory performance offered by N95 respirators and surgical masks: Human subject evaluation with NaCl aerosol representing bacterial and viral particle size range. Annals of Occupational Hygiene 52 (3):177–85. doi:10.1093/annhyg/men005.
- Leung, N. H. L., D. K. W. Chu, E. Y. C. Shiu, K.-H. Chan, J. J. McDevitt, B. J. P. Hau, H.-L. Yen, Y. Li, D. K. M. Ip, J. S. M. Peiris, et al. 2020. Respiratory virus shedding in exhaled breath and efficacy of face masks. Nat. Med. 26 (5):676–80. doi:10.1038/s41591-020-0843-2.
- Liu, L., J. Wei, Y. Li, and A. Ooi. 2017. Evaporation and dispersion of respiratory droplets from coughing. Indoor Air. 27 (1):179–90. doi:10.1111/ina.12297.
- Liu, Y., Z. Ning, Y. Chen, M. Guo, Y. Liu, N. K. Gali, L. Sun, Y. Duan, J. Cai, D. Westerdahl, et al. 2020. Aerodynamic analysis of SARS-CoV-2 in two Wuhan hospitals. Nature 582 (7813):557–6. doi:10.1038/s41586-020-2271-3.
- Lyu, W., and G. L. Wehby. 2020. Community use of face masks and COVID-19: Evidence from a natural experiment of state mandates in the US: Study examines impact on COVID-19 growth rates associated with state government mandates requiring face mask use in public. Health Aff. (Millwood) 39 (8):1419–25. doi:10.1377/hlthaff.2020.00818.
- Malashenko, A., A. Tsuda, and S. Haber. 2009. Propagation and breakup of liquid menisci and aerosol generation in small airways. J. Aerosol Med. Pulm. Drug. Deliv. 22 (4):341–53. doi:10.1089/jamp.2008.0696.
- Mitze, T., R. Kosfeld, J. Rode, and K. Wälde. 2020. Face masks considerably reduce COVID-19 cases in Germany. Proc. Natl. Acad. Sci. U.S.A. 117 (51):32293–301. doi:10.1073/pnas.2015954117.
- Morais, F. G., V. K. Sakano, L. N. de Lima, M. A. Franco, D. C. Reis, L. M. Zanchetta, F. Jorge, E. Landulfo, L. H. Catalani, H. M. J. Barbosa, et al. 2021. Filtration efficiency of a large set of COVID-19 face masks commonly used in Brazil. Aerosol Sci. Technol. 55 (9):1028–41. doi:10.1080/02786826.2021.1915466.
- Morawska, L., G. Johnson, Z. Ristovski, M. Hargreaves, K. Mengersen, S. Corbett, C. Y. H. Chao, Y. Li, and D. Katoshevski. 2009. Size distribution and sites of origin of droplets expelled from the human respiratory tract during expiratory activities. J. Aerosol Sci. 40 (3):256–69. doi:10.1016/j.jaerosci.2008.11.002.
- Mostofi, R., A. Bahloul, J. Lara, B. Wang, Y. Cloutier, and F. Haghighat. 2011. Investigation of potential affecting factors on performance of N95 respirator. Journal of the International Society for Respiratory Protection 28:26–39.
- Munster, V. J., F. Feldmann, B. N. Williamson, N. Van Doremalen, L. Pérez-Pérez, J. Schulz, K. Meade-White, A. Okumura, J. Callison, B. Brumbaugh, et al. 2020. Respiratory disease in rhesus macaques inoculated with SARS-CoV-2. Nature 585 (7824):268–72. doi:10.1038/s41586-020-2324-7.
- Ou, Q., C. Pei, S. C. Kim, E. Abell, and D. Y. Pui. 2020. Evaluation of decontamination methods for commercial and alternative respirator and mask materials - View from filtration aspect. J. Aerosol Sci. 150:105609. doi:10.1016/j.jaerosci.2020.105609.
- Pan, Y., D. Zhang, P. Yang, L. L. Poon, and Q. Wang. 2020. Viral load of SARS-CoV-2 in clinical samples. Lancet. Infect. Dis. 20 (4):411–2. doi:10.1016/S1473-3099(20)30113-4.
- Papineni, R. S., and F. S. Rosenthal. 1997. The size distribution of droplets in the exhaled breath of healthy human subjects. J. Aerosol Med. 10 (2):105–16. doi:10.1089/jam.1997.10.105.
- Paulo, A. C., M. Correia-Neves, T. Domingos, A. G. Murta, and J. Pedrosa. 2010. Influenza infectious dose may explain the high mortality of the second and third wave of 1918–1919 influenza pandemic. PLoS One. 5 (7):e11655. doi:10.1371/journal.pone.0011655.
- Rengasamy, S., B. C. Eimer, and R. E. Shaffer. 2009. Comparison of nanoparticle filtration performance of NIOSH-approved and CE-marked particulate filtering facepiece respirators. Ann. Occup. Hyg. 53 (2):117–28. doi:10.1093/annhyg/men086.
- Rengasamy, S., B. Eimer, and R. E. Shaffer. 2010. Simple Respiratory protection-evaluation of the filtration performance of cloth masks and common fabric materials against 20–1000 nm size particles. Ann. Occup. Hyg. 54 (7):789–98. doi:10.1093/annhyg/meq044.
- Rengasamy, S., B. C. Eimer, and J. Szalajda. 2014. A quantitative assessment of the total inward leakage of NaCl aerosol representing submicron-size bioaerosol through N95 filtering facepiece respirators and surgical masks. J. Occup. Environ. Hyg. 11 (6):388–96. doi:10.1080/15459624.2013.866715.
- Roberge, R. J., E. Bayer, J. B. Powell, A. Coca, M. R. Roberge, and S. M. Benson. 2010. Effect of exhaled moisture on breathing resistance of N95 filtering facepiece respirators. Ann. Occup. Hyg. 54 (6):671–7. doi:10.1093/annhyg/meq042.
- Rossman, J. S., and R. A. Lamb. 2011. Influenza virus assembly and budding. Virology 411 (2):229–36. doi:10.1016/j.virol.2010.12.003.
- Schmitt, J., and J. Wang. 2021. Quantitative modeling of the impact of facemasks and associated leakage on the airborne transmission of SARS-CoV-2. Sci. Rep. 11 (1):19403. doi:10.1038/s41598-021-98895-9.
- Schwarz, K., H. Biller, H. Windt, W. Koch, and J. M. Hohlfeld. 2010. Characterization of exhaled particles from the healthy human lung-a systematic analysis in relation to pulmonary function variables. J. Aerosol Med. Pulm. Drug Deliv. 23 (6):371–9. doi:10.1089/jamp.2009.0809.
- Serfozo, N., J. Ondráček, N. Zíková, M. Lazaridis, and V. Ždímal. 2017. Size-resolved penetration of filtering materials from CE-marked filtering facepiece respirators. Aerosol Air Qual. Res. 17 (5):1305–15. doi:10.4209/aaqr.2016.09.0390.
- Shakya, K. M., A. Noyes, R. Kallin, and R. E. Peltier. 2017. Evaluating the efficacy of cloth facemasks in reducing particulate matter exposure. J. Expo. Sci. Environ. Epidemiol. 27 (3):352–7. doi:10.1038/jes.2016.42.
- To, K. K.-W., O. T.-Y. Tsang, W.-S. Leung, A. R. Tam, T.-C. Wu, D. C. Lung, C. C.-Y. Yip, J.-P. Cai, J. M.-C. Chan, T. S.-H. Chik, et al. 2020. Temporal profiles of viral load in posterior oropharyngeal saliva samples and serum antibody responses during infection by SARS-CoV-2: An observational cohort study. Lancet Infect. Dis. 20 (5):565–74. doi:10.1016/S1473-3099(20)30196-1.
- Univ. of Florida, Dept. of Anesthesiology. 2021. Mask alternative guide. https://anest.ufl.edu/clinical-divisions/mask-alternative/, https://anest.ufl.edu/clinical-divisions/mask-alternative/. Last accessed January 7, 2020.
- Van Damme, W., R. Dahake, R. van de Pas, G. Vanham, and Y. Assefa. 2021. COVID-19: Does the infectious inoculum dose-response relationship contribute to understanding heterogeneity in disease severity and transmission dynamics? Med. Hypotheses 146:110431. doi:10.1016/j.mehy.2020.110431. https://www.sciencedirect.com/science/article/pii/S0306987720333223.
- Wölfel, R., V. M. Corman, W. Guggemos, M. Seilmaier, S. Zange, M. A. Müller, D. Niemeyer, T. C. Jones, P. Vollmar, C. Rothe, et al. 2020. Virological assessment of hospitalized patients with COVID-2019. Nature 581 (7809):465–9. doi:10.1038/s41586-020-2196-x.
- Zayas, G., M. C. Chiang, E. Wong, F. MacDonald, C. F. Lange, A. Senthilselvan, and M. King. 2012. Cough aerosol in healthy participants: Fundamental knowledge to optimize droplet-spread infectious respiratory disease management. BMC Pulm. Med. 12 (1):1–12. doi:10.1186/1471-2466-12-11.
- Zuurbier, M., G. Hoek, P. Van den Hazel, and B. Brunekreef. 2009. Minute ventilation of cyclists, car and bus passengers: An experimental study. Environ. Health 8:48. doi:10.1186/1476-069X-8-48.