
Abstract
Ash and soot particles are generated during engine combustion and are deposited in particulate filters. In order to understand the basic processes that occur in a particulate filter during the filtration process the particles have to be generated quickly and replicably. In this study, fundamental investigations are conducted on the generation of ash particles independently of an engine to produce a defined aerosol. The formation of ash particles from engine oils with differences in sulfate ash content (SAC; 0.7%, 2.6%, 4.5%) as well as the variation of process parameters (oil temperature, nozzle volume flow) are investigated. The ash particles are produced by nebulizing engine oil and a subsequent thermal conversion in a furnace. The SAC of the oil does influence the ash particles that are generated. With the increase of the SAC, the ash mass flow and the number weighted median diameter increase. Raising the nozzle volume flow as well as the oil temperature leads to an increase in total number concentration and mass flow of the ash particles. The number median diameter of the oil mist and ash particles decrease with the increase of oil temperature and nozzle volume flow. For the fast loading of a particulate filter, the SAC of the oil should be 4.5%. The oil temperature and nozzle volume flow should be set at 30 °C and 6 L·min−1. In conclusion, the ash generation method can be used for the rapid loading of a particulate filter.
EDITOR:
1. Introduction
Nowadays everyone is affected by air pollution. In order to reduce emissions, mandatory exhaust after-treatment systems have been introduced many years ago in vehicles to remove particulate matter from the exhaust gases. The particles generated during engine combustion are ash and soot particles, which are separated in particulate filters.
Ash is a solid combustion residue formed from inorganic components of the oil or other fuel additives during thermal conversion and is defined as an inert particle (Kamp et al. Citation2015; Zhu et al. Citation2014). A schematic picture of the formation of an ash particle from an oil droplet by thermal conversion is shown in .
Figure 1. Thermal conversion of a droplet into an ash particle (Messing, Zhang, and Jayanthi Citation1993).
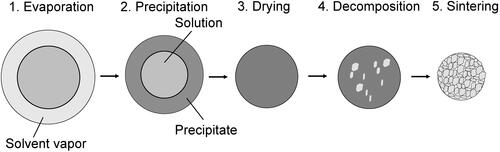
The ash formation can be divided into the five following steps:
Evaporation: A layer of solvent vapor from the highly volatile components is formed around the droplet and evaporates from the droplet surface. This process depends on the temperature and on the droplet’s velocity. Both factors influence the heat transfer and residence time.
Precipitation: If the temperature is high enough, a microporous particle is formed in which the solid components of the liquid are precipitated. Precipitation takes place from the outside to the inside of the droplet. In this state, liquid can still be present inside the particle at the beginning of the conversion.
Drying: During the process of thermal conversion, the droplet dries and a solid particle is formed without soluble components.
Decomposition: The droplet is further converted until a microporous ash particle is formed in which only the inorganic components are present.
Sintering: Sintering of the particles can only take place if the temperature is high enough and the residence time during thermal conversion is sufficient (Messing, Zhang, and Jayanthi Citation1993). The process of sintering is not relevant in this work due to the low experimental temperature during the thermal conversion (max. 900 °C).
Ash particles consist of oxides, phosphates, and sulfates of the chemical elements Ca, Mg, and Zn (A. Liati et al. Citation2012; Nemoto et al. Citation2004; Serrano et al. Citation2014; Zarvalis, Lorentzou, and Konstandopoulos Citation2009) and originate mostly from lubricating oil or fuel additives (Givens et al. Citation2003; Zarvalis, Lorentzou, and Konstandopoulos Citation2009). The primary particles have a size <1 µm and are preponderantly spherical (Ishizawa et al. Citation2009).
Soot (reactive particles) is also formed during the combustion in an engine and consists mainly of the chemical element carbon. Both kinds of particles, soot and ash, are deposited in a particulate filter to clean the exhaust gas after the engine combustion. Diesel particulate filters (DPF) and gasoline particulate filters (GPF) are nowadays a standard component in exhaust after treatment systems (Jiang et al. Citation2016). A particulate filter (wall-flow filter) typically consists of parallelly arranged channels with alternately blocked ends. This structure allows the aerosol to flow into the open inlets parallelly to the filter channel’s surface while the gas flow passes the filter wall and leaves the outlet channel as clean gas. The particles are deposited on the porous filter walls of the inlet channel and form a particle layer (Karin et al. Citation2009). After reaching a defined pressure drop to remove the organic components from the filter, the filter is automatically regenerated. That means that the soot particles are oxidized and react to the end products carbon dioxide and water vapor (Dittler Citation2014; Seher et al. Citation2016). During the regeneration, the particle layer breaks up. Due to the flow through the filter, agglomerates can be detached and rearranged in the filter channels. The detachment of an agglomerate depends on the particle size, on the adhesive forces between the particles themselves and with the wall, and on the flow velocity. After the regeneration, only the inorganic components remain in the inlet channel and form an increasing particle layer over filtration time (A. G. Sappok Citation2013).
Since engine lubricant additive formulations have normally ash contents below 1.0% (A. G. Sappok and Wong Citation2007) the ash accumulation in particulate filters during the loading phase would take several thousand hours (A. Sappok and Wong Citation2010). To save time and to accelerate the process, various investigations in literature have tested accelerated ash loading methods of particulate filters.
One of these investigations was done by Hertzberg (Citation2003) who conducted studies on the fast ashing of DPFs based on oil-doped fuel. He observed a 10–20 times higher particle number concentration in the exhaust gas when 2% oil was added to the fuel. The addition of the doped fuel produced a uniform layer in the DPF, but showed significant differences in ash structure and composition (Dittler Citation2014).
Bardasz et al. (Citation2003) also carried out experiments with oil-doped fuel where the particle layer could be observed after a test period of 200 h in the filter. This fast ashing resulted in a different deposition pattern, which can be attributed to a different ash-soot ratio (Bardasz et al. Citation2003).
Another attempt of examining the effects of the ash contents in lube oils was done by Sonntag and Eilts (Citation2015). They investigated different ash generation methods on an engine test bench that used various lube oils with different ash contents and a system for the injection of oil in an additional burner. The exhaust gas of the burner was mixed with the engine exhaust gas. The different methods lead to high ash productions while the ash particles differ in morphology to reference ash from the engine combustion (Sonntag and Eilts Citation2015).
A study by Schwanzer et al. (Citation2021) investigated an improved synthetic ash-loading method for a GPF. An active oil injection with a multi-point injection system was used. This can respond more quickly to changes in the combustion process and produces more comparable ash than the previous mentioned studies. With this method, more ash was generated and the primary particle size is comparable to the particle size produced in the regular engine operation. Another method of accelerating ash formation in the engine is, for example, the use of other piston rings (inverted lower compression ring), which is not considered in more detail here (Eakle et al. Citation2018).
These works have in common that the ash particles were produced with the aid of a combustion engine or an additional burner. Thus, the individual influencing factors of the generation could not be considered. In order to set precise process parameters and to generate replicable ash particles, it is essential to produce ash particles independently of the engine combustion. This ensures that the deposited particle systems and their properties can be characterized precisely. It enables to link specific characteristics of the particles to the processes of layer formation and rearrangement (detachment, transport and deposition) of agglomerates in a particulate filter.
The investigations in this article will examine how the process parameters, under which oil droplets are thermally converted, as well as the different oils themselves, influence the ash particles generated. The oil droplet size as well as the ash particle size, their concentration and mass flows will be varied by the process parameters of oil temperature, nozzle volume flow, and SAC of the oil.
The dependence between generated oil droplets and the resulting ash particles will be characterized using various measurement methods (OPC and SMPS measurement system, gravimetric analysis, scanning electrone microscope (SEM) images) and the influence of the different parameters will be discussed. The aim is to verify whether the sulfate ash content of the oil or different process parameters affect the ash particle size, particle concentration, and mass flow in the exhaust gas. The results will be used to develop an alternative ash generation system for rapid ashing of a particulate filter in order to produce different aerosols simply by varying the process parameters.
2. Materials and methods
2.1. Experimental setup
In this project, ash is produced by nebulizing engine oil with different SAC and subsequent thermal conversion in a furnace. The generated oil droplets and ash particles are characterized by various methods. shows the schematic experimental setup of the generation method (a) as well as a schematic drawing of the used two-fluid nozzle (b).
Figure 2. (a) Schematic experimental setup of droplet and ash generation as well as the characterization. The numbers indicate the different paths of aerosol characterization. (1a) measuring the particle size distribution of oil droplets with OPC and SMPS, (2a) measuring the particle size distribution of ash particles with OPC- and SMPS, or (2b) gravimetry, SEM-images and elemental analyses (EDX-analyses) by deposition of the ash particles on glass fiber filter media and (2c) removal of a part of the aerosol to achieve a constant residence time in the furnace. Abbreviations: FIC – Flow Indicating Control; TIC – Temperature Indicating Control; (b) schematic scheme of the used two-fluid-nozzle.
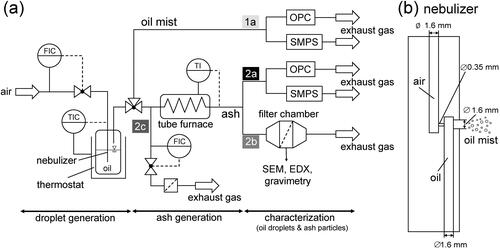
The oil reservoir of the nebulizer was conditioned by a thermostat (Julabo F12, JULABO GmbH) to control the oil temperature. The nebulization was realized by particle-free dry air and a two-fluid nozzle. A schematic illustration of the two-fluid nozzle used is shown in . It consists of two tubes. One contains the oil and the compressed air flows through the other. Due to the overflow of the oil, oil droplets are entrained and the oil is nebulized. The flow of the compressed air through the nozzle was held constant by a mass flow controller (MFC, Brooks Instrument GmbH). After the nebulization of the oil, the oil mist was led into a tube furnace (Nabertherm B180, Nabertherm GmbH) to generate ash particles by thermal conversion. The temperature of the furnace was set to its maximum of 1200 °C for all experiments. Furthermore, the gas temperature at the furnace’s outlet was measured. It indicates at which temperature the oil droplets were thermally converted. This temperature depends on the volume flow passing through the quartz glass tube with an inner diameter of 20 mm. As the volume flow rate increases, the gas temperature in the furnace decreases. At a set furnace temperature of 1200 °C and a volume flow of 5 L·min−1, a gas temperature of 910 °C was reached at the furnace outlet.
For the experiments, three oils with different SAC were used. The oils consist of a similar basis oil and differ essentially in the added elements that result in the different sulfate ash contents. The chemical and physical composition of the oils are listed in .
Table 1. Chemical and physical composition of the tested oils.
For the characterization of the oil mist (, path 1a) and ash particles (, path 2a), the particle size distributions were measured by combining a scanning mobility particle sizing system (SMPS) for the submicron particles (fine fraction) with an optical particle counter (OPC) for the size range from 0.2 µm to 10 µm (coarse fraction). The aerosols were cooled to ambient temperature before being introduced into the measuring instruments.
The SMPS measurements were performed using two SMPS instruments. One with a radioactive (oil droplets) and the other with an X-ray (ash particles) source. The SMPS system for the measurement of the oil droplets consists of an 85Kr neutralizer, a Differential Mobility Analyzer (DMA; Model Vienna Long, Hauke) and a Condensation Particle Counter (CPC; Model 3775, TSI GmbH). The SMPS combines size determination via electrical mobility with counting of individual particles and output nanoparticle concentrations in 64 size bins per decade. The measuring range was set between 0.02 µm – 1.0 µm and a scanning time of 180 s was applied. The ash particles were measured with a SMPS 3936 that consists of an X-Ray source, DMA 3082 and CPC 3756 (all from TSI GmbH). Particle sizes <0.02 µm were not measured in this study.
The coarse particle size range was determined by an OPC measurement system Promo 2000HP from PALAS GmbH with a Welas 2070HP sensor. The measuring principle was based on scattered light intensity and a resolution of 64 size channels per decade was set.
For optical, gravimetric and compositional analysis, the ash particles are deposited on a glass fiber filter (MN 85/90BF, MACHERY-NAGEL GmbH and Co. KG). The SEM images are used to characterize the particle shape and their surface. The mass flow is determined by gravimetric analysis. The filter is weighed before and after particle loading. The mass flow is determined from the mass difference. For the analysis of the element composition, EDX (energy dispersive X-ray) measurements are carried out.
2.2. Experimental procedure
For the experiments of the generation of ash particles from an oil mist, three oils with different SAC were used (described in section 2.1) and the oil temperature as well as the nozzle volume flow were varied. The oil temperature and the nozzle volume flow influence the nebulization of the oil and thus also the generated ash particles. The oil temperature was varied between 15 – 30 °C and the nozzle volume flow was set between 4 L·min−1 to 7 L·min−1. The oil temperature was selected that the furnace could convert the mass flow of oil droplets with as little organic residue as possible. The parameters for nebulizing the oil (nozzle volume flow 5 L·min−1 and oil temperature 15 °C) have been kept constant during the experiments to investigate the influence of different SAC on the oil mist generation and the subsequent thermal conversion to ash particles. For the variation of the nozzle volume flow, a part of the aerosol flow was removed before the furnace (see , path 2c) to prevent a decreased time of thermal conversion due to the increase of the nozzle volume flow rate. Therefore, the residence time (3.64 s) in the furnace has been held constant for all experiments. summarizes the ranges of oil temperature, nozzle volume flow, and sulfate ash content.
Table 2. Range of the process parameters.
3. Results and discussion
3.1. Influence of SAC on ash particle generation
Three different oils with an identical base oil and different SAC were used for the investigations. The oil properties are listed in . illustrates the number particle size distributions (PSD) of the oil droplets (a) and ash particles (b) for the three tested oils with different SAC. The particle size distributions were measured in the size ranges of 0.02–1.0 µm and 0.2–10 µm, which is marked as fine (filled) and coarse fraction (unfilled) in the following figures. The overlapping range of the two fractions remained between 0.2 and 1.0 µm.
Figure 3. Number-based PSD of generated oil mist (a) and ash particles (b) with various SAC for the coarse (OPC) and fine (SMPS) particle fractions. The PSD was measured at ambient temperature. Process parameters: Toil = 15 °C, V̇nozzle = 5 L·min−1, Tfurnace = 1200 °C, Tgas = 910 °C, τ = 2.63 s.
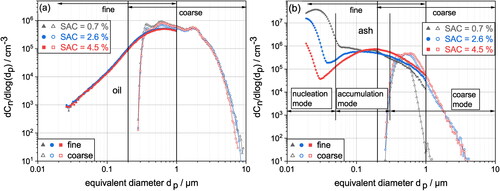
The oil droplets are in a particle size range between 0.03 µm to 9 µm (). The overlapping region (0.2–1.0 µm) of the fine and coarse fraction shows a good agreement of the results at the upper limit of the overlapping range at 1.0 µm. A significant drop can be seen at the lower measurement limit of the coarse fraction at 0.2 µm for all measurements. This can be attributed to the reduced counting efficiency of the OPC measurement system at small particle sizes. This characteristic was observed in all measurements. It is noteworthy that the two measuring devices (SMPS and OPC) were based on different measurement principles. This may lead to differences in number concentrations, which are mainly evident in the transition region (0.2–1.0 µm) of the two devices. The difference in the measurement principles must be considered in any comparison of SMPS and OPC data.
The difference of the SAC in the oil leads to a comparable PSD of the oil droplets. All process parameters, such as oil temperature or gas velocity through the nozzle (nozzle volume flow), were kept constant during nebulization, such that the sole influence of the SAC can be observed. In conclusion, the SAC of the oil does not affect the PSD of the oil droplets. Thereby, a comparable PSD enters the furnace for the thermal conversion.
The generated ash particles from the three oils show differences in particle number concentration and particle size, which is illustrated in . The measurement of the coarse particles from the oil with SAC of 2.6% and 4.5% indicate a qualitatively similar curve of the PSD in the coarse mode (see 0.3 µm < dp<10 µm). In the size range of 0.6–2.0 µm, slightly more particles of the high-ash oil (SAC = 4.5%) were produced. One noticeable particularity is that the oil with a SAC of 0.7% shows a different behavior in the coarse mode than the other two oils. The distribution is narrower and the maximum concentration is lower. These results were also confirmed by further measurements. The low SAC content in the oil results in fewer large ash particles being generated. After thermal conversion of the oil droplets, only the SAC in the oil remains as ash particles. A droplet from an oil with high SAC generates a larger ash particle than a comparable droplet from an oil with low SAC. This may result in smaller particles in the coarse fraction of the generated ash particles from an oil with a low SAC.
Considering the measured PSD of the ash particles of the fine fraction, two modes can be identified: the nucleation mode (dp<0.05 µm) and the accumulation mode (0,05 µm < dp<0.3 µm) (Kittelson Citation1998). Other researchers, such as Burtscher (Citation2005), Rönkkö et al. (Citation2007) and Heikkilä et al. (Citation2009) have observed these two modes in emission measurements of heavy-duty engines. Rönkkö et al. (Citation2007) showed that the PSD of a heavy-duty diesel vehicle is dominated by particles in the size range 19–35 nm. In further studies by, e.g., Dorscheidt et al. (Citation2020) and Schwanzer et al. (Citation2021), which measured particle size distributions on engine test benches and with an active oil injection using a multi-point injection system upstream of the GPF, many nanoparticles were analyzed as well. The measurements were performed in a particle size range of 0.005–0.2 µm. The modal value in nucleation mode is slightly smaller in these two studies, being approximately 23 nm (Dorscheidt et al. Citation2020) and 12–17 nm (Schwanzer et al. Citation2021). Comparable results were also obtained by Rönkkö et al. (Citation2014) when measuring the particle size distribution of a heavy duty diesel engine truck during normal operation. The many small particles were attributed to high soluble organic fraction (SOF) values. The measured PSD of the diesel truck also revealed some particles in the accumulation mode. However, engine combustion produces not only ash but also soot, which also leads to small particles. Observing the two regions in , it is also noticeable that in the accumulation mode, the concentration increases with the increase in SAC for particles larger than 0.2 µm. In the size range of the nucleation mode, a different behavior of the tested oils is observed. A significant number of small particles is produced during thermal conversion, which were not existent during the oil droplet analysis. As already mentioned above, these could be attributed to high SOF values (Rönkkö et al. 2007).
The small particles can also be a result of the temperature gradient between the furnace and the ambient condition in front of the measurement instruments. This can cause homogeneous nucleation due to the supersaturation of the gas phase (Heikkilä et al. Citation2009). The process causes attractive forces between the molecules, such as van der Waals forces, which lead to the formation of molecular clusters (Hinds Citation2012). These clusters become stable in connection with a supersaturated vapor and grow into a larger particle by condensation. This process could produce submicron particles which are measured in the subsequent measuring devices (Heikkilä et al. Citation2009; Hinds Citation2012).
Besides nucleation, particles in the submicron size range can also result from micro explosions during thermal conversion. Micro explosions can occur when the components in the oil droplets evaporate at different rates (Hou et al. Citation2013). Engine oil consists mainly of hydrocarbons and the additives magnesium or calcium (Givens et al. Citation2003). Due to the different chain lengths, the ingredients evaporate at unequal points in time (Kurzweil Citation2020). The boiling temperature of the straight-chain hydrocarbons increases with chain length, e.g., tetradecane (C14H30) has a boiling point at 254 °C and tetracosane (C24H50) at 391 °C (Kurzweil Citation2020). Another decisive factor is how quickly the heat is transported to the droplet’s surface during evaporation. A component that has a low-boiling point evaporates faster and can be trapped inside the droplet (Shang et al. Citation2020). In a droplet, the temperature gradient decreases from the surface toward its center. By that, the low-boiling components evaporate quickly on the outside while the rest remains in their liquid state in the core of the droplet (Messing, Zhang, and Jayanthi Citation1993). The liquid part gets trapped inside of the arising shell of ash (Precipitation-stage, (Messing, Zhang, and Jayanthi Citation1993)) but is still heated. It evaporates inside of the shell until the increasing pressure of the evaporated gases blows up the particle (Botero et al. Citation2012). Through this process, the mother droplet can be torn into several daughter droplets (Avulapati et al. Citation2019; Basu and Miglani Citation2016). As a result, the concentration increases significantly in the small particle sizes but does not decrease in the coarse particle fractions. A number of authors showed that fuel droplets with different volatile components explode during combustion, for example, Botero et al. (Citation2012) and Avulapati et al. (Citation2016).
The cause for the appearance of the small particles in this study cannot be fully elucidated and only assumptions can be made about the possible processes in and out of the furnace. For a complete analysis, further studies on the compounds generated during thermal conversion and the measurement of the particle size distribution in the particle size range <0.02 µm need to be performed.
depicts the total particle number concentration (a) and the number weighted median diameter (b) of the generated oil droplets and ash particles in dependence on the sulfate ash content of the oils. The lines between the data points serve as a guide to the eye.
Figure 4. Total particle number concentrations (a) and number weighted median particle diameters (b) of oil droplets plotted against sulfate ash content for the coarse (OPC) and fine (SMPS) particle fractions. Process parameters: Toil = 15 °C, V̇nozzle = 5 L·min−1, Tfurnace = 1200 °C, Tgas = 910 °C, τ = 2.63 s. Lines connecting data points serve as a guide to the eye.
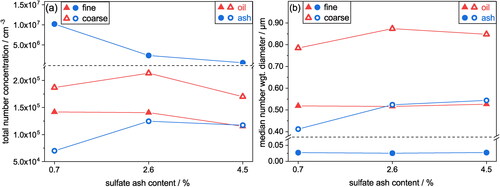
The total number concentration of oil droplets indicates that a qualitative comparable number of oil droplets are nebulized. The concentration of the oil droplets in the coarse fraction is higher than in the fine fraction. The generated ash particles, on the other hand, have a lower concentration than the oil droplets in the coarse fraction, which could be attributed to possible particle losses during the thermal conversion or in the tube walls in front of the measuring devices. With the increase of SAC in the oil, more ash particles are formed in the coarse fraction (see PSD ). The total number concentration of ash particles of the medium- and high-SAC oils in the coarse fraction is comparable. Differences can be seen in the ratio between the concentrations of oil droplets and ash particles of the two oils. There is a factor of 0.56 between the generated oil droplets and the resulting ash particles for the oil with SAC of 2.6% and a factor of 0.71 for the oil with SAC of 4.5%. It follows that from the ratio of oil droplets to ash particles, more ash particles in the coarse fraction are generated with the high ash oil.
A recurring observation of the results is that the concentration of the ash particles in the fine fraction is significantly higher than the measured total number concentration of the oil droplets. The concentration of ash particles decreases with the increase of SAC. This is attributed to the small particles, as seen in the PSD (nucleation mode) in . For each droplet, a high number of small ash particles remain after thermal conversion.
The number weighted median diameter of the oil measurements confirms that nebulization is hardly influenced by the higher SAC in the oil. The median diameter of the coarse fraction is about 0.82 µm for all three oils and 0.52 µm in the fine fraction. The influence of the SAC, on the contrary, can be seen in the ash measurements. The diameter increases with the increase of SAC in the oil from 0.41 µm (0.7%) to 0.53 µm (4.5%), which is due to the larger ash content in the oil that remains as ash particles during thermal conversion. In the submicron size range, the median diameter is approximately constant at 0.03 µm.
The measured oil mass flows, ash mass flows and the theoretical expected ash mass flows are depicted in . The estimation was calculated on the basis that the SAC remains solely in the generated ash particles (ṁash = SAC · ṁoil).
Figure 5. Results of gravimetric measurements resulting in oil mass flow and ash mass flow with various SAC. Process parameters: Toil = 15 °C, Tfurnace = 1200 °C, Tgas = 910 °C, V̇nozzle = 5 L·min−1, τ = 2.63 s. Lines connecting data points serve as a guide to the eye.
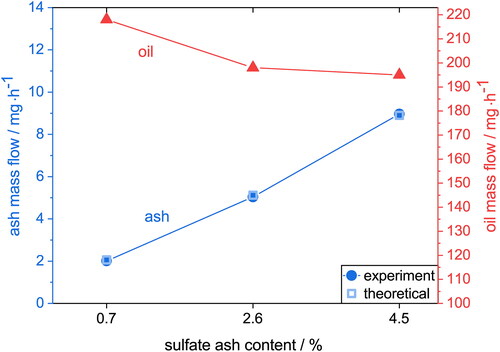
The three oil mass flows vary between 196 and 218 mg·h−1. The low ash oil (0.7%) has the highest mass flow rate and thus deviates slightly from the two oils with higher SAC. The mass flow of ash particles confirms the expected behavior that with an increase in SAC more inorganic components are contained in the oil and thus a larger mass of ash particles is produced (Givens et al. Citation2003). The theoretical estimation of the ash mass flows confirms the experimental data. The highest ash mass flow of 8.9 mg·h−1 is achieved in these experiments (oil temperature 15 °C and nozzle volume flow 5 L·min−1) at a SAC of 4.5%.
Exemplarily SEM images of the generated ash particles from the tested oils with the lowest and highest SAC of 0.7% and 4.5% at two magnifications are shown in . The visible fibers on the images belong to the utilized glass fiber filter. The ash particles are spherical and have a rough surface.
Figure 6. SEM images of generated ash particles with SAC of 0.7% (a, b) and 4.5% (c, d) on a glass fiber filter (loading time: 30 min) with different magnifications. Process parameters: Toil = 15 °C, Tfurnace = 1200 °C, Tgas = 910 °C, V̇nozzle = 5 L·min−1, τ = 2.63 s.
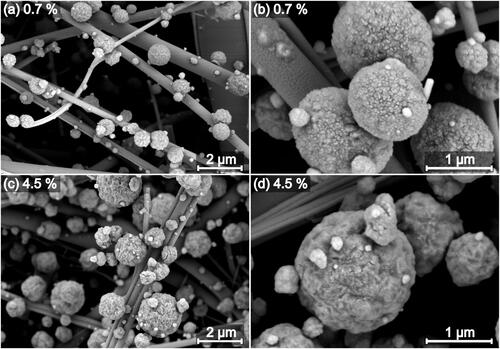
The surface of the ash particles produced with the low ash oil (0.7%) have a surface with few deep roughnesses. It can be seen that the surface is littered with very small particles. As shown in the PSD (), there are many particles which are <50 nm. These particles may have been deposited on the surface of the large ash particles during deposition on the glass fiber filter. In contrast, the surface of the particle of the high ash oil (4.5%) has more burrs and fewer small particles.
SEM images of ash particles from a regenerated DPF show a qualitative similar appearance (Ishizawa et al. Citation2009; A. Liati et al. Citation2012). This comparison must be considered critically, since the SEM images shown here have not experienced any regeneration. Recordings of ash particles from real applications are mostly present as ash agglomerates with agglomerate sizes between 5 and 50 µm (A. Liati et al. Citation2012; A. G. Sappok Citation2013).
In order to analyze the composition of the ash particles and determine the amount of residual carbon, EDX analysis of ash particles were realized. For this purpose, elemental analyses of individual particles on the glass fiber filters were carried out. lists the results of the EDX analyses of the deposited ash particles on the glass fiber filter.
Table 3. Normalized mass concentration of the elements of ash particles with different SAC.
The carbon residues of the generated ash particles of the three engine oils are between 9.6 and 12.6%. The analysis of an empty glass fiber filter indicates that it contains about 5% carbon. Even if the existing carbon of the empty glass fiber filter is subtracted, a certain percentage of carbon is still present in the ash. This could indicate incomplete conversion of the oil droplets, leaving carbon residues in the ash. In order to verify these results, the glass fiber filters loaded with ash particles were heated for 60 min at 550 °C in a muffle furnace to oxidize the remaining carbonaceous components of the ash particles. The loaded filter was weighed before and after the thermal treatment to determine the residual carbon content in the deposited ash. The results revealed that the filter mass was still reduced by approx. 8%, which is in good agreement with the results of the EDX analysis. The measured oxygen is nearly constant at 43%. With higher SAC, the percentage of the chemical element calcium is increased and nearly doubled between the tested oils, which is due to the detergent additive calcium in the oil (see ). This indicates that there could be more calcium sulfate compositions in the ash, e.g., CaSO4 (Givens et al. Citation2003). The small amount of magnesium in the ash particles resulted from the small amount of magnesium used as an additive in the oil. The content of sulfur increases with increasing SAC. This is due to the different contents of sulfur in the used oil. The measured elements Ca, Mg, S, and Na were also detected in analyses of engine produced ash particles (Givens et al. Citation2003; Liati and Dimopoulos Eggenschwiler Citation2010; Zarvalis, Lorentzou, and Konstandopoulos Citation2009). The proportion of Na on the filter medium increases with increasing SAC. Only small amounts of Na are present in the oil used (see ). The decrease can be attributed to the greater loading of the glass fiber filter due to the higher mass flow of ash particles at a higher SAC. As a result, fewer glass fibers are visible which may affect the EDX measurements of ash particles. EDX measurements of an unloaded glass fiber filter measured approximately 9% of natrium in the unloaded filter medium. The results of the EDX-measurements need to be reviewed critical because other substances might contaminate the glass fiber filter and thus falsify the element concentration of the ash particles. The missing percentages of the evaluations are mainly due to the element silicon, which the glass fiber filters are made of. Additional measurements with empty filters have shown that some of them contained large amounts of other substances, e.g., carbon and natrium.
3.2. Influence of oil temperature and nozzle volume flow on ash particle generation
The influence of the oil temperature and the nozzle volume flow on the oil droplets, as well as the ash particles on total number concentration, median diameter, and mass flow, will be discussed in the subsequent section. In this context, just the results of the oil with a SAC of 4.5% are presented. This oil showed in the previous chapter the most promising results for a fast loading of a particulate filter.
presents the total particle number concentration (a) and the number weighted median diameter (b) of the generated oil droplets in dependence on the nozzle volume flow (4, 5, 6 and 7 L·min−1) at three different oil temperatures (15, 20, 30 °C). The plots illustrate the results of the coarse (unfilled), as well as the fine (filled) particle fractions. The results were evaluated separately for the OPC (coarse) and the SMPS (fine). The lines between the data points serve as a guide to the eye.
Figure 7. Total particle number concentrations (a) and number weighted median particle diameters (b) of oil droplets plotted against nozzle volume flow at three different oil temperatures for the coarse (OPC) and fine (SMPS) particle fractions. Lines connecting data points serve as a guide to the eye.
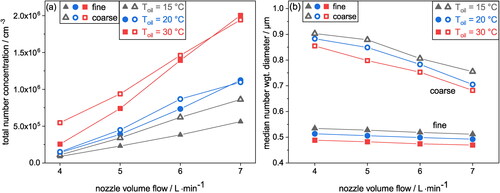
The data of the total number concentrations () indicates that with the increase of the nozzle volume flow as well as with the increase of oil temperature the concentration of the oil droplets increases in the coarse and fine particle fraction. The slope of the concentrations related to the nozzle volume flows increases with the oil temperature. In the fine particle fraction the concentration increases between 4 and 7 L·min−1 at a temperature of 15 °C by a factor of 6.4 and at 30 °C by a factor of 7.8. The concentration of the particles in the fine fraction is slightly lower than the concentration of the coarse fraction. The observed exception to this trend occurs at an oil temperature of 20 °C and 30 °C and the highest nozzle volume flow (7 L·min−1) where the fine particles have a higher concentration. The maximum concentration of 2.0 × 106 cm−3 is achieved at an oil temperature of 30 °C and a nozzle volume flow of 7 L·min−1.
The corresponding median number weighted diameters are presented in . The median diameters decrease with the increase of the nozzle volume flow and with the increase of the oil temperature. By increasing the flow rate to 7 L·min−1, the difference between the temperatures (15 °C and 30 °C) is slightly rising and the median value decreases from 0.76 µm to 0.68 µm. Due to the measuring ranges of the two devices, the median diameters of the fine fraction are smaller. The difference of the median diameters between the three oil temperatures remains approximately between 0.02 and 0.03 µm for all measured nozzle volume flows.
The change in concentration, as well as in the number weighted median values, can be attributed to the decreasing viscosity of the oil with an increase in temperature. Severa et al. (Citation2014) and Hemmat Esfe et al. (Citation2016) found that the decrease in viscosity is significantly greater at temperatures between 0 °C and 35 °C than at higher temperatures (40 – 65 °C). This behavior can be explained by the depreciation of the intermolecular interactions between the molecules. The reduction leads to a decreased viscosity of the oil. (Hemmat Esfe et al. Citation2016). In this case, more oil droplets are generated with increasing oil temperature and a constant volume flow because less kinetic energy is required to entrain droplets in the flow.
The influence of the nozzle volume flow of the generated ash particles in dependence with the oil temperature on the total number concentration and the number weighted median diameter has been investigated and the results are presented in . The data is based on the same process parameters as the oil generation and corresponds to the oil with a SAC of 4.5%.
Figure 8. Total particle number concentrations (a) and number weighted median particle diameters (b) of ash particles plotted against nozzle volume flow at three different oil temperatures for the coarse (OPC) and fine (SMPS) particle fractions. Process parameters of thermal conversion in the furnace: Tfurnace = 1200 °C, Tgas = 910 °C, τ = 2.63 s. Lines connecting data points serve as a guide to the eye.
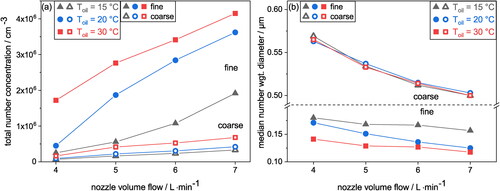
The total particle number concentration () of generated ash particles increases with increasing oil temperature and nozzle volume flow. This behavior was to be expected due to the total number concentration of the oil droplets shown previously (). When the oil temperature and the nozzle volume flow were increased, more particles were introduced into the furnace. This generates more ash particles. The number concentration of the fine particle fraction is higher than the coarse particle fraction. This is due to the small particles, which are generated during or after the thermal conversion. This characteristic was shown in the previous section (chapter 3.1) for the PSD of the ash particles. The comparison of the total number concentration of the oil droplets () and the ash particles () of the fine fraction indicates that the ash particles have a higher concentration than the oil droplets. Consequently, more ash particles are produced than oil droplets were transported into the furnace. Possible explanations are also described in chapter 3.1. The concentration of the ash particles in the coarse fraction decreases compared to the concentration of the generated oil droplets. This decrease in coarse particles may be due to particle losses in the tubes or agglomeration. In conclusion, by increasing the oil temperature and the nozzle volume flow, the total number concentration of ash particles in the coarse and fine particle fraction can be increased.
The number weighted median diameter () of the coarse particles decreases, comparable with the measurements of the oil droplets, with increasing nozzle volume flow and increasing temperature. The number median diameters of the coarse particle fraction at the three oil temperatures are comparable for all nozzle volume flows. The median diameter decreases from 0.57 µm at 4 L·min−1 to 0.50 µm at 7 L·min−1. In the fine particle fraction, the median value decreases with the nozzle volume flow. Small differences due to the oil temperature can be seen in this particle fraction. At a nozzle volume flow of 4 L·min−1, the median value of the fine particle fraction drops from 0.18 µm at 15 °C to 0.14 µm at 30 °C. At the highest flow rate of 7 L·min−1, a factor of 1.3 occurs between the highest and lowest temperatures. According to these data, the oil temperature has only a small influence on the median diameters of the ash particles and the influence on the number concentration is significantly greater.
The mass flows of the oil droplets, as well as the ash particles at the three oil temperatures and different nozzle volume flows, are shown in and b for the oil with SAC of 4.5%. Only the results of nozzle flow rates of 4–6 L·min−1 are presented, since the oil mass flow rate at 7 L·min−1 was too high for an accurate gravimetric analysis. This meant that the loading time had to be shortened, resulting in large fluctuations. For this reason, the results have been omitted here. However, it can be assumed that the values will increase even further if the nozzle volume flow is increased.
Figure 9. Results of gravimetric measurements of oil droplets (a) and ash particles (b) with the variation of oil temperature and nozzle volume flow. Process parameters: Toil = 15 °C, Tfurnace = 1200 °C, Tgas = 910 °C, τ = 2.63 s. Lines connecting data points serve as a guide to the eye.
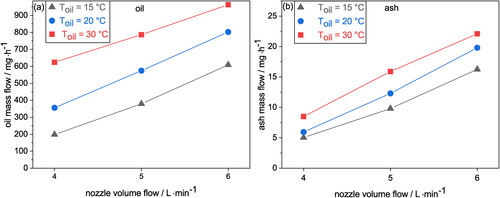
The results of the oil and ash mass flow confirm the evaluated data of the total number concentrations ( and ). The higher the temperature and the higher the nozzle volume flow, the more oil is nebulized (resulting in a higher mass flow rate) and consequently a higher mass flow rate of ash particles can be generated. By increasing the ash mass flow rate, it is possible to load a particulate filter more quickly for experimental studies. For this reason, the oil temperature should be set to 30 °C and the nozzle flow rate to at least 6 L·min−1.
4. Conclusions
The generation of ash particles from engine oils with differences in sulfate ash content and the influence of the process parameters of oil temperature and nozzle volume flow on nebulization were analyzed in this study. The ash particles were generated by nebulizing the engine oil and a subsequent thermal conversion of the oil droplets in a furnace. The particles were characterized by OPC and SMPS. Additionally, oil and ash mass flows were measured.
The sulfate ash content in the engine oil does not affect the PSD of the oil droplets generated. The total number concentrations, number weighted median diameters and mass flows are also comparable. However, the generated ash particles show the influence of the SAC in producing larger ash particles. This behavior is also confirmed by the ash mass flow rates as well as median diameters. Increasing the SAC in the base oil from 0.7% to 4.5% increases the number weighted median diameter by 30%. After thermal conversion, a small amount of residual carbon is still present in the ash particles (ca. 5%).
The experimental variation of the process parameters during nebulization indicates that by increasing the nozzle volume flow as well as by increasing the oil temperature, the total number concentration and the mass flows of oil mist and ash particles increases and the number weighted median diameter decreases.
The investigated method can be used to generate ash particles in a replicable process and the ash mass flow can be simply varied. For a fast loading of a particulate filter, the SAC of the oil should be 4.5%. The process parameters of the oil temperature and nozzle volume flow should be set at 30 °C and 6–7 L·min−1. With these settings, the highest mass flow of ash particles is achieved.
The applied method can generate comparable ash particles to ash particles from engine combustion, but the variation in particle size is limited to a small particle size range. Nanoparticles <0.02 µm are not measured in this study. Additional variations of the SAC as well as the use of oils with different additives (e.g., Mg) could make the generated ash even more comparable. The use of other nebulization methods by e.g., different nozzles could lead to different ash particle sizes and mass flows. The mentioned points could be investigated in more detail in further studies.
In conclusion, the variation of the process parameters as well as the sulfate ash content is a simple way to adjust the particle concentration as well as the mass flow of the ash particles in small areas to achieve a fast layer formation in a particulate filter. This has established a foundation for further investigations to link specific characteristics of the particles to the processes of layer formation and rearrangement (detachment, transport and deposition) of agglomerates in a particulate filter.
Declaration of competing interest
The authors declare that they have no known competing financial interests or personal relationships that could have appeared to influence the work reported in this article.
Additional information
Funding
References
- Avulapati, M. M., L. C. Ganippa, J. Xia, and A. Megaritis. 2016. Puffing and micro-explosion of diesel–biodiesel–ethanol blends. Fuel. 166:59–66. doi:10.1016/j.fuel.2015.10.107.
- Avulapati, M. M., T. Megaritis, J. Xia, and L. Ganippa. 2019. Experimental understanding on the dynamics of micro-explosion and puffing in ternary emulsion droplets. Fuel. 239 (7):1284–92. doi:10.1016/j.fuel.2018.11.112.
- Bardasz, E. D. Mackney, N. Britton, G. Kleinschek, K. Olofsson, I. Murray, and A. P. Walker. 2003. Investigations of the interactions between lubricant-derived species and aftertreatment systems on a state-of-the-art heavy duty diesel engine (SAE Technical Paper Series). Warrendale, PA: SAE International400 Commonwealth Drive. doi:10.4271/2003-01-1963.
- Basu, S., and A. Miglani. 2016. Combustion and heat transfer characteristics of nanofluid fuel droplets: A short review. Int. J. Heat Mass Transf. 96 (10):482–503. doi:10.1016/j.ijheatmasstransfer.2016.01.053.
- Botero, M. L., Y. Huang, D. L. Zhu, A. Molina, and C. K. Law. 2012. Synergistic combustion of droplets of ethanol, diesel and biodiesel mixtures. Fuel. 94:342–7. doi:10.1016/j.fuel.2011.10.049.
- Burtscher, H. 2005. Physical characterization of particulate emissions from diesel engines: A review. J. Aerosol. Sci. 36 (7):896–932. doi:10.1016/j.jaerosci.2004.12.001.
- Dittler, A. 2014. Abgasnachbehandlung mit Partikelfiltersystemen in Nutzfahrzeugen. Habil.-Schr. Wuppertaler Reihe zur Umweltsicherheit. Shaker. Zugl.: Wuppertal, Univ.
- Dorscheidt, F. Sterlepper, S. Görgen, M. Nijs, M. Claßen, J. Yadla, S. K. Maurer, R. Pischinger, S. Krysmon, S, and Abdelkader, A. 2020. Gasoline particulate filter characterization focusing on the filtration efficiency of nano-particulates down to 10 nm (SAE Technical Paper Series). SAE International400 Commonwealth Drive, Warrendale, PA. doi:https://doi.org/10.4271/2020-01-2212.
- Eakle, S. S. Avery, P. Weber, and C. Henry. 2018. Comparison of accelerated ash loading methods for gasoline particulate filters (SAE Technical Paper Series). SAE International400 Commonwealth Drive, Warrendale, PA. doi:10.4271/2018-01-1703.
- Givens, W. A. W. H. Buck, A. Jackson, A. Kaldor, A. Hertzberg, W. Moehrmann, S. Mueller-Lunz, N. Pelz, and G. Wenninger. 2003. Lube formulation effects on transfer of elements to exhaust after-treatment system components (SAE Technical Paper Series). SAE International400 Commonwealth Drive, Warrendale, PA. doi:10.4271/2003-01-3109.
- Heikkilä, J., A. Virtanen, T. Rönkkö, J. Keskinen, P. Aakko-Saksa, and T. Murtonen. 2009. Nanoparticle emissions from a heavy-duty engine running on alternative diesel fuels. Environ. Sci. Technol. 43 (24):9501–6. doi:10.1021/es9013807.
- Hemmat Esfe, M., M. Afrand, S. Gharehkhani, H. Rostamian, D. Toghraie, and M. Dahari. 2016. An experimental study on viscosity of alumina-engine oil: Effects of temperature and nanoparticles concentration. Int. Commun. Heat Mass Transfer 76:202–8. doi:10.1016/j.icheatmasstransfer.2016.05.013.
- Hertzberg, A. 2003. Schnellveraschung von Partikelfiltern. Personal communication to Achim Dittler.
- Hinds, W. C. 2012. Aerosol technology: Properties, behavior, and measurement of airborne particles (2. Aufl.). Hoboken, NJ: Wiley-Interscience. http://gbv.eblib.com/patron/FullRecord.aspx?p=1120423
- Hou, S.-S., F. M. Rizal, T.-H. Lin, T.-Y. Yang, and H.-P. Wan. 2013. Microexplosion and ignition of droplets of fuel oil/bio-oil (derived from lauan wood) blends. Fuel 113:31–42. doi:10.1016/j.fuel.2013.05.066.
- Ishizawa, T., H. Yamane, H. Satoh, K. Sekiguchi, M. Arai, N. Yoshimoto, and T. Inoue. 2009. Investigation into ash loading and its relationship to DPF regeneration method. SAE Int. J. Commer. Veh. 2 (2):164–75. doi:10.4271/2009-01-2882.
- Jiang, J., J. Gong, W. Liu, T. Chen, and C. Zhong. 2016. Analysis on filtration characteristic of wall-flow filter for ash deposition in cake. J. Aerosol Sci. 95:73–83. doi:10.1016/j.jaerosci.2016.01.009.
- Kamp, C. J., P. Folino, Y. Wang, A. Sappok, J. Ernstmeyer, A. Saeid, R. Singh, B. Kharraja, and V. W. Wong. 2015. Ash accumulation and impact on sintered metal fiber diesel particulate filters. SAE Int. J. Fuels Lubr. 8 (2):487–93. doi:10.4271/2015-01-1012.
- Karin, P., L. Cui, P. Rubio, T. Tsuruta, and K. Hanamura. 2009. Microscopic visualization of PM trapping and regeneration in micro-structural pores of a DPF wall. SAE Int. J. Fuels Lubr. 2 (1):661–9. doi:10.4271/2009-01-1476.
- Kittelson, D. B. 1998. Engines and nanoparticles. J. Aerosol Sci. 29 (5–6):575–88. doi:10.1016/S0021-8502(97)10037-4.
- Kurzweil, P. 2020. Chemie. Switzerland: Springer Fachmedien Wiesbaden. doi:10.1007/978-3-658-27503-7.
- Liati, A., and P. Dimopoulos Eggenschwiler. 2010. Characterization of particulate matter deposited in diesel particulate filters: Visual and analytical approach in macro-, micro- and nano-scales. Combust. Flame 157 (9):1658–70. doi:10.1016/j.combustflame.2010.02.015.
- Liati, A., P. Dimopoulos Eggenschwiler, E. Müller Gubler, D. Schreiber, and M. Aguirre. 2012. Investigation of diesel ash particulate matter: A scanning electron microscope and transmission electron microscope study. Atmos. Environ. 49:391–402. doi:10.1016/j.atmosenv.2011.10.035.
- Messing, G. L., S.-C. Zhang, and G. V. Jayanthi. 1993. Ceramic powder synthesis by spray pyrolysis. J Am. Ceramic Soc. 76 (11):2707–26. doi:10.1111/j.1151-2916.1993.tb04007.x.
- Nemoto, S. Y. Kishi, K. Matsuura, M. Miura, S. Togawa, T. Ishikawa, T. Hashimoto, and T. Yamazaki. 2004. Impact of oil-derived ash on continuous regeneration-type diesel particulate filter – JCAPII oil WG report (SAE Technical Paper Series). SAE International400 Commonwealth Drive, Warrendale, PA. doi:10.4271/2004-01-1887.
- Rönkkö, T., L. Pirjola, L. Ntziachristos, J. Heikkilä, P. Karjalainen, R. Hillamo, and J. Keskinen. 2014. Vehicle engines produce exhaust nanoparticles even when not fueled. Environ. Sci. Technol. 48 (3):2043–50. doi:10.1021/es405687m.
- Rönkkö, T., A. Virtanen, J. Kannosto, J. Keskinen, M. Lappi, and L. Pirjola. 2007. Nucleation mode particles with a nonvolatile core in the exhaust of a heavy duty diesel vehicle. Environ. Sci. Technol. 41 (18):6384–9. doi:10.1021/es0705339.
- Sappok, A. G. 2013. Ash accumulation in diesel particulate filters. Mississauga, Canada: DieselNET Technology Guide.
- Sappok, A. G, and V. W. Wong. 2007. Detailed chemical and physical characterization of ash species in diesel exhaust entering aftertreatment systems (SAE Technical Paper Series). SAE International400 Commonwealth Drive, Warrendale, PA. doi:10.4271/2007-01-0318.
- Sappok, A., and V. W. Wong. 2010. Ash effects on diesel particulate filter pressure drop sensitivity to soot and implications for regeneration frequency and DPF control. SAE Int. J. Fuels Lubr. 3 (1):380–96. doi:10.4271/2010-01-0811.
- Schwanzer, P., M. Schillinger, J. Mieslinger, S. Walter, G. Hagen, S. Märkl, G. Haft, M. Dietrich, R. Moos, M. Gaderer, et al. 2021. A synthetic ash-loading method for gasoline particulate filters with active oil injection. SAE Int. J. Engine. 14 (4):493–505. doi:10.4271/03-14-04-0029.
- Seher, S. I., M. N. Ess, H. Bladt, R. Niessner, G. Eigenberger, and U. Nieken. 2016. A comparison of diesel soot oxidation rates measured with two different isothermal set-ups. J. Aerosol Sci. 91:94–100. doi:10.1016/j.jaerosci.2015.10.003.
- Serrano, J. R. C. Guardiola, P. Piqueras, and E. Angiolini. 2014. Analysis of the aftertreatment sizing for pre-turbo DPF and DOC exhaust line configurations (SAE Technical Paper Series). SAE International400 Commonwealth Drive, Warrendale, PA. doi:10.4271/2014-01-1498.
- Severa, L., M. Havlíček, and V. Kumbár. 2014. Temperature dependent kinematic viscosity of different types of engine oils. Acta Univ. Agric. Silvic. Mendelianae Brun. 57 (4):95–102. doi:10.11118/actaun200957040095.
- Shang, W., S. Yang, T. Xuan, Z. He, and J. Cao. 2020. Experimental studies on combustion and microexplosion characteristics of N-alkane droplets. Energy Fuel. 34 (12):16613–23. doi:10.1021/acs.energyfuels.0c02904.
- Sonntag, F., and P. Eilts. 2015. Schnelle Veraschung von Partikelfiltern. MTZ Motortech. Z. 76 (12):76–83. doi:10.1007/s35146-015-0150-5.
- Zarvalis, D. S. Lorentzou, and A. G. Konstandopoulos. 2009. A Methodology for the fast evaluation of the effect of ash aging on the diesel particulate filter performance (SAE Technical Paper Series). SAE International400 Commonwealth Drive, Warrendale, PA. doi:10.4271/2009-01-0630.
- Zhu, H. W. Li, H. Tao, J. Li, and X. Sui. 2014. Effect of sulfated ash in lubricant on the performance and durability of diesel particulate filter (DPF) (SAE Technical Paper Series). SAE International400 Commonwealth Drive, Warrendale, PA. doi:10.4271/2014-01-2796.