
 ?Mathematical formulae have been encoded as MathML and are displayed in this HTML version using MathJax in order to improve their display. Uncheck the box to turn MathJax off. This feature requires Javascript. Click on a formula to zoom.
Abstract
Different populations of aerosol are constantly mixed throughout the atmosphere. Large-scale models often assume no particle–particle mixing or fast mixing among aerosol populations, so that they stay externally mixed or instantaneously form internal mixtures. We apply the kinetic multilayer model of gas–particle interactions (KM-GAP) to simulate the evaporation of semi-volatile species from one particle population and partitioning into another population with various phase states and nonideal mixing conditions. We find that the particle–particle mixing timescale (τmix) is prolonged when the semi-volatile species transport to a population in which it is miscible, as more mass must be transported. Extremes of volatility prolong the τmix, as low-volatility species evaporate slowly, while high-volatility species condense slowly. When the bulk diffusivities of the two populations are greater than 10−15 cm2 s−1, semi-volatile species mix rapidly; otherwise, the τmix can be prolonged beyond 1 h. We apply KM-GAP to particle–particle mixing experiments of H-toluene SOA into D-toluene SOA and limonene SOA, showing that τmix is prolonged when toluene SOA is highly viscous, while initial partitioning of gas phase semi-volatile species from toluene SOA into limonene SOA is rapid because of the low viscosity of limonene SOA. Simulations of mixing toluene SOA and β-caryophyllene SOA indicate that the apparent discrepancy of limited mixing under conditions where both are predicted to have low viscosity are explained by limited miscibility of the semi-volatile components. Our study demonstrates that particle–particle mixing timescales are affected by a complex interplay among volatility, diffusion limitations, and non-ideal miscibility.
Editor:
Introduction
Organic aerosols constitute a major fraction of aerosol mass in the atmosphere, affecting climate, air quality, and public health (Jimenez et al. Citation2009; Pöschl and Shiraiwa Citation2015). Organic aerosols contain a huge number of different species from a variety of primary and secondary sources (Goldstein and Galbally Citation2007; Zhang et al. Citation2007; Prather, Hatch, and Grassian Citation2008). Secondary organic aerosol (SOA) is formed via oxidation of volatile organic compounds to form semi-volatile and low-volatility products and subsequent condensation of these oxidation products onto preexisting particles. SOA is a complex mixture of species with varying volatilities and degrees of oxidation. The physicochemical properties of SOA depend on chemical composition as determined by the precursor and the formation conditions, as well as chemical evolution and mixing state with different aerosol populations in the atmosphere.
Measurements have shown that SOA can exist in a highly viscous semisolid or glassy state under low relative humidity and temperature (Liu et al. Citation2017; Reid et al. Citation2018; Kasparoglu et al. Citation2021; Song et al. Citation2021, Citation2022; Jeong et al. Citation2022; Kaur Kohli et al. Citation2023; Sheldon et al. Citation2023). Modeling studies have also shown that SOA should be highly viscous under dry and/or cold conditions in the troposphere, influencing multiphase chemical processes and cloud activation (Mu et al. Citation2018; Shiraiwa et al. Citation2017; Shrivastava et al. Citation2017; Schmedding et al. Citation2020; Rasool et al. Citation2021). This high particle viscosity corresponds to small bulk diffusion coefficients according to the Stokes–Einstein relation, inducing diffusion limitations within the particle (Ullmann et al. Citation2019; Shiraiwa et al. Citation2011, Citation2013). While SOA is often modeled with instantaneous equilibrium with its surroundings, bulk diffusion limitations can induce long equilibration timescales for partitioning into viscous particles (Shiraiwa and Seinfeld Citation2012; Booth et al. Citation2014; Schervish and Shiraiwa Citation2023). The phase state of SOA also regulates the evolution of size distributions, growth rates, heterogeneous chemistry, ice nucleation, and long-range transport of pollutants (Wang et al. Citation2012; Berkemeier et al. Citation2014; Zhang et al. Citation2018; Zaveri et al. Citation2020; Bertozzi et al. Citation2021; Gkatzelis et al. Citation2021; He et al. Citation2021; Octaviani et al. Citation2021; Lei et al. Citation2022; Shen et al. Citation2022; Shrivastava et al. Citation2022; Song et al. Citation2022; Rasool et al. Citation2023). For example, it has been shown that viscous organic coatings can facilitate the long-range transport of toxic polycyclic aromatic hydrocarbons (Shrivastava et al. Citation2017; Mu et al. Citation2018).
Atmospheric aerosols consist of a complex mixture of organics, inorganics, and water. Mounting evidence indicates that aerosol particles can phase separate into an aqueous inorganic core and a hydrophobic organic shell, indicating a low degree of miscibility between these two phases (Freedman Citation2020; Huang et al. Citation2021; Li et al. Citation2021). The organic aerosol may also phase separate into a high O:C, hydrophilic core and a low O:C, hydrophobic shell even in the absence of inorganics (Song et al. Citation2012, Citation2018; Freedman Citation2017; Huang et al. Citation2021; Mahrt et al. Citation2022). In contrast, different species may be favorably miscible, leading to an enhancement in mixing compared to ideality (Kim, Sartelet, and Couvidat Citation2019; Rusumdar et al. Citation2020; Roston Citation2021). According to calculations, these non-ideal interactions are represented with an activity coefficient, which can be orders of magnitude away from 1 (Zuend et al. Citation2008, Citation2011; Hyttinen et al. Citation2020).
Different aerosol populations are constantly being mixed throughout the atmosphere, e.g. indoor-to-outdoor mixing, concentrated pollution plumes mixing with ambient aerosol, or transport and mixing of ambient aerosols from different sources (Riemer et al. Citation2019; Cummings et al. Citation2021; Sedlacek et al. Citation2022). The introduction of two different aerosol populations to each other will affect each population’s equilibrium as semi-volatile components of each population will evaporate and mix with the other population. The timescale for each population to achieve a new equilibrium will depend on the properties of each aerosol population as well as those of the semi-volatile components present (Li and Shiraiwa Citation2019; Schervish and Shiraiwa Citation2023). Experiments aimed at probing these mixing timescales have shown that mixing between different SOA components can be rapid at high RH but can be hours at low RH (Robinson, Saleh, and Donahue Citation2013; Saleh, Donahue, and Robinson Citation2013; Liu et al. Citation2016; Ye et al. Citation2016, Citation2018; Preston and Zuend Citation2022). In contrast, Habib and Donahue (Citation2022) observed little kinetic limitations for mixing erythritol and various sugars even at low RH and cold temperatures. Additionally, while Ye et al. (Citation2016, Citation2018) observed rapid mixing of toluene SOA with deuterated toluene SOA, isoprene SOA, and limonene SOA at high RH, limited mixing was observed between toluene SOA and β-caryophyllene SOA at high RH. These apparent discrepancies suggest complex effects of different volatility distributions of different components, diffusion limitations due to higher particle viscosity at low RH, and possibly miscibility limitations (Wilson et al. Citation2015). Marcolli et al. (Citation2004) investigated the mixing of two aerosol populations and concluded that equilibrium is rapid for a semi-volatile species present in different amounts in the two populations but only considered diffusion limitations in the gas phase and did not consider bulk diffusion limitations or effects of non-ideality (Marcolli et al. Citation2004).
Large-scale models often represent no particle–particle mixing or fast mixing between different aerosol populations relative to other atmospheric processes to rapidly form an internal mixture, where aerosols of a given size will contain the same composition because of computational limitations. While the latter assumption is likely valid when particle–particle mixing timescales are less than a typical model timestep between 20 min and 1 h, previous work has shown that the equilibration timescales can be hours or even days for viscous particles (Li and Shiraiwa Citation2019; Schervish and Shiraiwa Citation2023). Therefore, understanding under what conditions and what properties of aerosols lead to long mixing timescales provides crucial insight for an improved representation of aerosol dynamics in large-scale models (Mai et al. Citation2015; O’Meara, Topping, and McFiggans Citation2016). Here, we investigate the mixing of two particle populations with varying viscosity and probe their mixing timescale. We will simulate a semi-volatile species initially in one population with varying volatility and varying miscibility in the other population.
Methods
The kinetic multilayer model of gas–particle interactions in aerosols and clouds (KM-GAP) is used to simulate the mixing of two different particle populations. The details of KM-GAP, including rate equations and kinetic parameters, can be found in previous publications (Shiraiwa et al. Citation2012, Citation2013), so here we will give a brief description and the specific implementation in this study. KM-GAP explicitly treats the processes of gas-phase diffusion, adsorption and desorption, surface-bulk exchange, and bulk diffusion within the particle. KM-GAP consists of a gas phase, a near-surface gas phase, and, historically, one particle population with a sorption layer, a near-surface bulk layer, and a number of bulk layers. KM-GAP does not require simplifying assumptions about steady-state conditions and homogeneous radial mixing, which are often applied in other aerosol models. Mass transport processes are treated as fluxes, and rates of chemical reactions are treated in differential equations to describe the mass or number balance of each molecule in each model layer of gas and particle phases. The size change of particles and the temporal evolution and spatial profile of the concentration of each species can be modeled by solving ordinary differential equations in Matlab software.
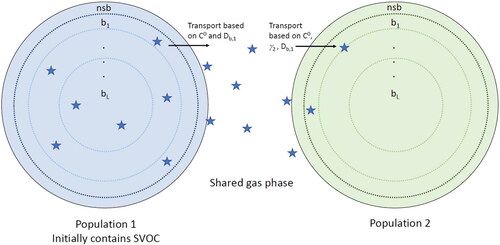
In this implementation, we simulate two particle populations, each with these layers and one shared gas phase. As shown in , we simulate two particle populations that are initially externally mixed and introduced to each other at time t = 0. The two populations are made up of different nonvolatile organic species, with one population (here referred to as population 1) containing a semi-volatile species. The semi-volatile species, present initially only in population 1, mixes ideally with the nonvolatile component of population 1 with an activity coefficient (γ1) of 1. It has a diffusivity in population 1 of Db1 = 10−8 cm2 s−1. The semi-volatile species has a total concentration of 4 µg m−3 and is initially partitioned to the gas phase based on its volatility so that the semi-volatile species is in equilibrium between the gas phase and the particle phase of population 1. We assume a surface accommodation coefficient of 1 for the semi-volatile species for each particle population (Julin et al. Citation2014; Domaros et al. Citation2020). In this work, we vary the pure-compound saturation mass concentration (C0) or volatility of the semi-volatile species in the range C0 =10−4–104 µg m−3, which corresponds to the vapor pressure of ∼10−9–10−1 Pa. This range encompasses the volatility of many atmospherically relevant organic species, which are distributed into volatility bins separated by powers of 10, including LVOCs (C0 = 10−4–0.1 µg m−3), SVOCs (C0 = 1–100 µg m−3), and IVOCs (C0 = 103–106 µg m−3). Lower volatility species can likely be considered essentially nonvolatile on atmospherically relevant timescales, and higher volatility species are unlikely to exist in large quantities in the particle phase (Donahue et al. Citation2011).
Figure 1. Schematic of the two populations implementation in KM-GAP. Both populations consist of a near-surface bulk layer (nsb) and the number of bulk layers (b1-L; L = 10 in this study). Additionally, each particle has a sorption layer containing adsorbed and desorbing species and a near-surface gas phase to account for potential gas phase diffusion, which is not pictured. There is one shared gas phase between the two populations. Each population consists of different nonvolatile species, while population 1 initially contains semi-volatile species in equilibrium with the gas phase.
Both populations are monodisperse with initial diameters of 200 nm, and a total particle number concentration of 104 cm−3. This size is chosen as it is roughly the mean diameter of ambient SOA particles in the volume size distributions (Martin et al. Citation2010; Pöschl et al. Citation2010; Riipinen et al. Citation2011). Both nonvolatile species, making up the bulk of each population, and the semi-volatile species have a molecular weight of 200 g mol−1. Therefore, initially, there is exactly the same amount of mass (∼40 µg m−3) and number of molecules in each population.
To investigate how particle–particle mixing timescales are affected by different properties of the aerosol and semi-volatile species, the volatility of the semi-volatile species, its miscibility in population 2, and the viscosity of population 2 are all varied. The latter two properties are adjusted via the activity coefficient (γ2) and the bulk diffusivity (Db2) of the semi-volatile species in population 2, respectively. γ2 is varied between 10−3 and 103. While the miscibility of atmospherically relevant organic species leads to activity coefficients often within an order of magnitude of unity, activity coefficients can deviate from 1 by orders of magnitude, for example, for partitioning of highly hydrophilic compounds such as glyoxal and nonpolar compounds like alkanes in the aqueous phase (Erdakos et al. Citation2006; Zuend et al. Citation2008, Citation2011; Shiraiwa et al. Citation2013; Hyttinen et al. Citation2020; Wallace et al. Citation2021; Hilditch et al. Citation2023). Hilditch et al. (Citation2023) measured activity coefficients for dicarboxylic acids in organic matrix droplets and found activity coefficients between 0.1 and 10. For polycyclic aromatic hydrocarbon benzo(a)pyrene, AIOMFAC predicts activity coefficients greater than 103 at high water activity (Zhou et al. Citation2019). For the viscosity of population 2, we simulate a liquid particle (Db2 = 10−8 cm2 s−1), a semi-solid particle (Db2 = 10−15 cm2 s−1), and an ultraviscous semi-solid particle (Db2 = 10−18 cm2 s−1). These diffusivities are chosen to represent the range of viscosities and diffusivities seen in atmospherically relevant organic or inorganic aerosol (Kiland et al. Citation2019).
In these simulations, species with high activity coefficients condense into a particle population (population 2) in which they are not miscible, and we assume that they still form one phase in this work. In reality, these species may form their own separate phase within population 2. For the formation of core-shell morphology with the condensing species making up the shell, the condensing species would not need to diffuse to the particle bulk but just need to be accommodated to the particle surface. In this case, the equilibration timescale would be controlled by gas-phase diffusion and surface accommodation. The situation where a condensing species that is immiscible in the shell but mixes ideally with a core phase has been investigated in detail in Schervish and Shiraiwa (Citation2023) with various shell viscosities.
It is important to define timescales carefully. Depending on the quantity of interest, the relevant timescale can differ dramatically. For example, if the quantity of interest is the timescale for the total organic aerosol mass of a single internally mixed population to relax to an equilibrium value with respect to semi-volatile gas-phase constituents, the timescale is mostly determined by the aerosol condensation sink (Saleh, Donahue, and Robinson Citation2013). However, the timescale for individual molecules to move from one population to another can be very different (as evaporation timescales can be very long even, without diffusion limitations) (Donahue, Chuang, and Schervish Citation2019). That is the timescale we consider here; the particle–particle mixing timescale (τmix) discussed in this work is the e-folding timescale for the concentration of the semi-volatile species to be within 1/e of its equilibrium value relative to its initial value. While each population should reach full equilibrium with the gas phase at the same time, the e-folding timescale can be different for each population. As population 1 is initially in equilibrium with the gas phase, less material needs to evaporate from population 1 compared to the amount that needs to condense to population 2. Therefore, when the bulk diffusivity of semi-volatile species in population 1 is greater than or equal to that in population 2, the equilibration timescale in population 2 will be longer. Hence, the equilibration timescale between population 2 and the gas phase represents the timescale for the whole system to achieve equilibrium and will be referred to as the particle–particle mixing timescale, τmix.
As noted in Schervish and Shiraiwa (Citation2023), equilibrium between the particle phase and the gas phase can be achieved long before the particle becomes homogeneous with no concentration gradients in the particle bulk. This occurs when the particle bulk is viscous, and mass can build up in the outer layers of the particle. While the whole system achieves full equilibrium at a single time, this buildup allows the particle to be within 1/e of its equilibrium value relative to its initial value (the condition for τmix) long before internal concentration gradients have dissipated. In this work, the mix represents the timescale for the two populations to achieve equilibrium with the gas phase, not necessarily for internal particle-phase concentration gradients to dissipate. The chosen τmix is most representative of gas–particle equilibrium in the context of large-scale aerosol modeling and laboratory-probed timescales for the exchange of semi-volatile species between two populations, as both models and experiments often do not resolve or measure concentration gradients within a particle.
Results and discussion
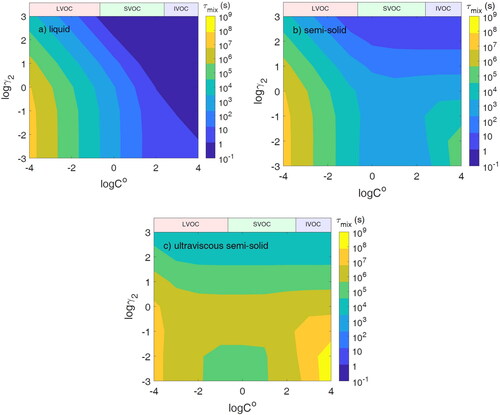
Liquid population 2
We calculate τmix when population 2 is liquid with Db2 = 10−8 cm2 s−1. The pure-compound saturation mass concentration and activity coefficient of semi-volatile species in population 2 are varied from C0 = 10−4–104 µg m−3 and γ2 = 10−3–103. shows an increase in τmix with decreasing C0 for all cases of γ2. This occurs for two reasons: (1) as C0 decreases, more material must be transported to population 2 for equilibrium to be achieved, and (2) at lower C0, evaporation from population 1 becomes slower. Li and Shiraiwa (Citation2019) showed that in an open system, evaporation timescales for low volatility species (C0 < 1 µg m−3) are consistently longer than 1 h, even in liquid particles. While the simulation condition does not represent a truly open system, population 2 acting as an absorbing medium for the semi-volatile species means that much more needs to evaporate than if population 1 was alone in a closed system, especially when γ2 is low.
Figure 2. Particle–particle mixing timescale (τmix) of two populations where population 1 is liquid (Db1 = 10−8 cm2 s−1) and population 2 is (a) liquid (Db2 = 10−8 cm2 s−1), (b) semi-solid (Db2 = 10−15 cm2 s−1), and (c) ultraviscous semi-solid (Db2 = 10−18 cm2 s−1).
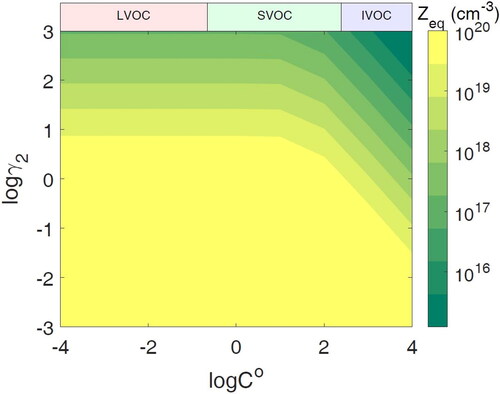
The equilibrium concentration of semi-volatile species in population 2 decreases with increasing γ2, leading to a decrease of τmix because less mass needs to be transported to population 2. When γ2 1 and C0 < 103 µg m−3, τmix is roughly independent of γ2 because the equilibrium concentration in population 2 is roughly independent of γ2. shows the equilibrium concentration in population 2, which is a function of both C0 as well as γ2, but independent of the viscosity of population 2. The equilibrium concentration increases with decreasing C0 and decreasing γ2. When γ2 = 0.1, there will be approximately an order of magnitude more semi-volatile species in population 2 than in population 1 at equilibrium. When C0 = 10 µg m−3 and γ2 = 0.1, approximately 90% of the available semi-volatile species in the system will reside in population 2 at equilibrium. While a further decrease of γ2 will still lead to an increase in the equilibrium concentration in population 2, the increase is small because of the limited amount of semi-volatile species in the system.
Figure 3. The final equilibrium number concentration of the semi-volatile species in population 2 with different volatilities (C0) and activity coefficients of semi-volatile species in population 2 (γ2).
Overall, when both populations are liquid, equilibrium will be achieved in less than an hour for all cases of miscibility for the semi-volatile species with C0 > 0.1 µg m−3. Specifically, within the SVOC range, τmix is less than or equal to approximately 30 min for all cases of γ2, and thus, an equilibrium assumption is appropriate for SVOC mixing between liquid populations. For LVOCs, τmix may range from a couple of hours for C0 = 0.1 µg m−3 to several months for C0 = 10−4 µg m−3 and γ2 < 1.
Semi-solid population 2
When population 2 is semi-solid with Db2 = 10−15 cm2 s−1, τmix is higher than the liquid case. There is very little difference in the trends of τmix for LVOCs and SVOCs compared to the liquid case. With only moderate diffusion limitations in population 2, the mixing for the LVOCs is driven mainly by slow evaporation from population 1 and the equilibrium concentration in population 2 ().
The remarkable difference from the liquid case is in τmix for IVOCs, where τmix is controlled by slow condensation and the equilibrium concentration in population 2, as seen in . The uptake of a species into the particle bulk is controlled by competition between bulk diffusion and desorption. As species remain near the surface for longer when bulk diffusion is slow, desorption and re-evaporation are more significant. Therefore, when there is a diffusion limitation in population 2, τmix increases with decreasing γ2 in the IVOC region compared to the liquid case. The increase is more pronounced with low γ2 because of the higher equilibrium concentration of the species in population 2. Equilibration will take longer, as in addition to the other effects, IVOCs need to move through a more viscous particle bulk in the presence of bulk diffusion limitations.
It is notable that τmix is still less than an hour for SVOCs for all cases of miscibility. In the IVOC range, mixing is rapid if the semi-volatile species is immiscible with population 2 with high γ2, but τmix increases with decreasing γ2 up to ∼5 days when γ2 = 10−3 because of the increase in the equilibrium concentration in population 2 with decreasing γ2; even when γ2 = 1, τmix is approximately 1.3 h with C0 = 104 µg m−3. At lower C0 (LVOCs and ELVOCs), τmix is similar to those of the liquid population 2 case and again can reach several months, as τmix is controlled by very slow evaporation from population 1.
Ultraviscous semisolid population 2
When population 2 adopts an ultraviscous semi-solid state with Db2 = 10−18 cm2 s−1, particle–particle mixing is slower in all cases for C0 and γ2. Slower diffusion leads to a very long τmix for IVOCs due to slow condensation and for low γ2 due to the higher equilibrium concentration. An interesting feature is observed for C0 between 10−2 and 10 µg m−3 and γ2 < 0.1 in while we see the expected trend of decreasing τmix when the total equilibrium concentration decreases with increasing γ2 for γ2 > 0.1, τmix slightly decreases for low γ2 < 0.1. This occurs due to the accumulation of semi-volatile species in the near-surface bulk in the presence of strong kinetic limitations of bulk diffusion, achieving its’ total equilibrium concentration rapidly. More mass of the semi-volatile species can build up for lower γ2, and thus, lower γ2 leads to slightly lower τmix in cases where the final equilibrium concentrations are similar. A similar build-up effect was observed in Schervish and Shiraiwa (Citation2023).
This effect does not persist to the IVOC range as eventually it is overtaken by the effect of the difference in the amount of mass needed to be transported, which is larger for the IVOC range as when γ2 < 1, the equilibrium concentration in population 2 increases substantially with decreasing γ2 (). The equilibrium concentration in population 2 is similar for γ2 = 10−1 up to C0 = 103 µg m−3 and γ2 < 10−2 up to C0 = 104 µg m−3. These C0 values correspond to when this reversal of the expected trend based on equilibrium concentration ends in . This effect is also not observed in the LVOC range, as slow evaporation from population 1 limits the mixing timescale in this range. The buildup effect in the region for C0 between 10−2 and 10 µg m−3 and γ2 < 0.1 leads to these miscible species having a τmix that is at most 1/3 lower than that when γ2 = 1. While not an insignificant effect, the τmix for these favorably miscible species still exceeds 5 days; thus, this effect does not lead these species to mix rapidly. When population 2 is ultraviscous, τmix is always longer than 1 h under investigated conditions of C0 and γ2, indicating that if two aerosol populations are mixing and even just one is ultraviscous semisolid, glassy, or amorphous solid, then the assumption of rapid equilibrium is unlikely to hold.
Viscosity changes
shows the τmix of semi-volatile species (C0 = 10 µg m−3) with various Db2 and γ2 in population 2. Population 1 is kept as liquid with Db1 = 10−8 cm2 s−1. As expected, τmix increases with a decrease in Db2 because of the kinetic limitations of bulk diffusion. Overall, τmix is shorter for larger γ2, as less material needs to be transported. In the presence of diffusion limitations with Db2 < ∼10−14 cm2 s−1, τmix can become slightly shorter with decreasing γ2 when γ2 < 1 due to the effect of accumulation in near-surface bulk, as explained earlier.
Figure 4. (a) Particle–particle mixing timescale (τmix) with various diffusivities and activity coefficients of semi-volatile species (C0 = 10 µg m−3) in population 2 (γ2). (b) τmix when the bulk diffusivity (Db) of a semi-volatile species with C0 = 10 µg m−3 is varied in both populations. In these simulations, the semi-volatile species is ideally miscible in both populations.
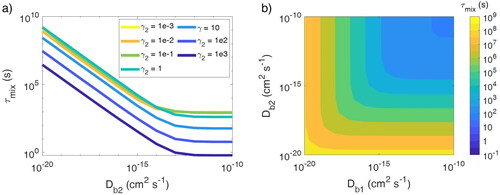
All of the above simulation results address only changes in the viscosity of population 2 by keeping population 1 liquid. To investigate the effect of the phase state of population 1, we conducted simulations by varying bulk diffusivity in both populations while assuming that the semi-volatile species (C0 = 10 µg m−3, still initially present in population 1 and in equilibrium with the gas phase) mixes ideally with both populations (γ2 = γ1 = 1). shows τmix when Db in both populations is varied in the range of 10−10–10−20 cm2 s−1. Note that the equilibration timescale of a population with smaller Db is systematically longer than a population with higher Db, while their difference remains within a factor of 2. Hence, we continue to use the equilibration timescale of population 2 to represent the particle–particle mixing timescale (τmix), but it is worth noting that the system would take up to twice as long to reach full equilibrium if population 1 is more viscous than population 2. Overall, the τmix is very similar if the Db of populations 1 and 2 are swapped. Particle–particle mixing is driven by evaporation from population 1 and condensation to population 2. For the same Db, the timescales of evaporation and condensation should be similar, given that condensation is an inverse process of evaporation, as also shown by a previous study (Shiraiwa et al. Citation2013). Hence, a symmetric distribution of τmix is reasonable as the overall particle–particle mixing timescale is limited by a slower process with lower Db.
A typical timestep of many large-scale aerosol models is 20 min to 1 h (Philip, Martin, and Keller Citation2016). τmix is less than 1 h when both particle populations have Db > 10−15 cm2 s−1, while τmix can be several hours to days when both particle populations have lower Db. Hence, the quick establishment of internal mixing of semi-volatile species would be a valid assumption for low-viscosity particles, but this assumption would be invalid for highly viscous particles. In this case, semi-volatile mixing should be treated kinetically, or an assumption of external mixing would be more appropriate if particles adopt ultraviscous (Db < 10−17 cm2 s−1) or glassy phase states.
Effect of organic aerosol mass concentration
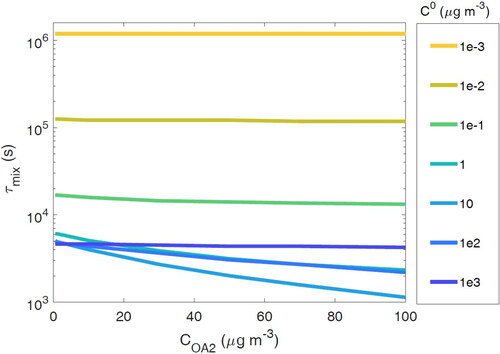
The total organic aerosol mass loading has been shown to affect equilibration timescales for condensation and evaporation, with low mass loadings consistently leading to longer equilibration timescales (Shiraiwa and Seinfeld Citation2012; Saleh, Donahue, and Robinson Citation2013; Li and Shiraiwa Citation2019). While typical chamber experiments are conducted with total organic aerosol concentrations (COA) in the range of 10–100 µg m−3, ambient organic aerosol mass concentrations in less polluted urban areas are often <10 µg m−3 (Hodzic et al. Citation2020). Therefore, it is valuable to consider lower COA concentrations. In the above simulations, both populations have COA1 = COA2 = 40 µg m−3. Here, we maintain all the same properties for the species making up each population as well as the 200 nm particle diameter for each population but change the total particle number concentration to achieve COA2 in the range of 0.1–100 µg m−3. With this setup, we thus do not capture any potential effect of particle size changes that may occur when particles are formed in the lab or atmosphere to generate different total organic aerosol concentrations but are able to narrow in on the effect of changing only the total aerosol concentration. COA1 is fixed at 40 µg m−3 as in the previous results, so the total amount of semi-volatile species is the same.
shows the τmix for a semi-volatile species with C0 from 10−3 to 103 µg m−3 when COA2 is varied from 0.1 to 100 µg m−3. τmix for SVOCs decreases with increasing COA2 because the condensation sink is larger with a higher surface area at higher COA2 (Donahue, Chuang, and Schervish Citation2019). This decrease is relatively small (less than a factor of 5) within this range of COA2. τmix for LVOCs are much less affected by the change in mass loading because the increased condensation sink is less effective at decreasing the equilibration timescale for species that condense rapidly, even at low organic aerosol mass loadings. τmix for IVOCs is also less affected by COA2, as higher volatility compounds mostly reside in the gas phase and their partitioning is less affected by the absorbing mass. These results indicate that the species volatility is a more critical parameter for determining τmix. While higher total organic aerosol concentration can shorten the equilibration timescale for SVOCs, the effect of COA is minimal for IVOCs and LVOCs.
Figure 5. Particle–particle mixing timescale (τmix) when mass loading of population 2 (COA2) is varied in the range of 0.1–100 µg m−3, while mass loading of population 2 (COA1) is held constant at 40 µg m−3.
Comparison to laboratory mixing experiments
With this setup of KM-GAP, we investigate experimental results on the particle–particle mixing of two aerosol populations. We simulate the results from Ye et al. (Citation2016, Citation2018), where two SOA populations were generated separately, allowed to achieve equilibrium, and subsequently mixed. Once mixed, any semi-volatile components of the two populations could evaporate and mix into the other population. In the experiments investigated here, only H-toluene SOA and deuterated toluene SOA contain a significant semi-volatile fraction. The evaporated semi-volatile species from toluene SOA partitions into a different toluene SOA population, limonene SOA, or -caryophyllene SOA, representing population 2. In Ye et al. (Citation2016, Citation2018), SOA particles had mobility diameters between 200 and 700 nm. In the model simulations, the particle diameter was assumed to be 400 nm, with particle number concentrations chosen to achieve the total organic aerosol concentrations of each population in the experimental work.
H-toluene SOA + D-toluene SOA
As H-toluene SOA and D-toluene SOA should mix ideally, these experiments can be used to derive the fraction of SVOC in toluene SOA. To achieve a mass fraction of ∼0.3 of population 1 in population 2 at equilibrium, we set the initial total mass of SVOC in the system to be ∼30% of the organic aerosol concentration of population 1. It is assumed that both H-toluene SOA and D-toluene SOA contain two semi-volatile species with C0 of 1 and 10 µg m−3. These species are assumed to be present in equal quantities and are initially present in equilibrium with the gas phase. As evaporation from population 2 will affect the experimentally observed property of the mass fraction of population 1 in population 2, we consider this process in simulating H-toluene SOA and D-toluene SOA mixing.
The viscosity of toluene SOA has been measured across wide temperature and RH ranges because of its use as a proxy for anthropogenic SOA. Song et al. (Citation2016) measured toluene SOA viscosity to be >108 Pa s for RH < 20%, and it decreased to 7.8 × 10³ Pa s at ∼50% RH (Song et al. Citation2016), which is consistent with particle bounce measurements conducted by Bateman, Bertram, and Martin (Citation2015) and Li et al. (Citation2015). Using the Stokes–Einstein equation, we estimated the bulk diffusivity to be 3 × 10⁻¹⁷ cm2 s−1 at 10% RH, 1 × 10⁻¹⁵ cm2 s−1 at 20% RH, 1 × 10⁻¹³ cm2 s−1 at 40% RH, and 2 × 10⁻⁸ cm2 s−1 at 90% RH, respectively, which are used as input parameters in our model simulations.
shows the observed mass fraction of H-toluene SOA (population 1) in D-toluene SOA (population 2) by Ye et al. (Citation2016) and the results of the model simulations, showing a very good agreement between measurements and simulations. Ye et al. (Citation2016) conducted experiments under four different relative humidity (RH) conditions. All scenarios were initiated with ∼10% RH. In the first experiment, the RH was maintained at ∼10% throughout the experiment, and there was little to no mixing observed between the two populations. In the second experiment, the RH was increased to 20% at t = 1 h, leading to a small enhancement in mixing. In this experiment, the mass fraction of SVOC from population 1 in population 2 reached ∼0.19 after 4 h. Full equilibrium was not achieved in 4 h under 10% and 20% RH, which is consistent with the highly viscous semi-solid phase state as measured by Song et al. (Citation2016). In this simulation, as well as for all the following simulations, we assumed that the change in bulk diffusivity is instantaneous upon RH increase in the experiment, as previous studies have shown that water diffusion is rapid in the order of seconds or minutes under room temperature depending on relative humidity and particle size (Shiraiwa et al. Citation2013; Price et al. Citation2015). Realistically, there may still be a delay in the particle viscosity change as water diffuses through each population; hence, the simulation results show more abrupt changes in mass fraction compared to the observations (). In experiment 3, the RH was increased to ∼40% after 2 h, leading to a mass fraction of 0.3 after 4 h. In the final experiment, the RH was increased over the course of the experiment to 90% RH at 1.5 h. The fastest uptake was observed in this experiment, with a mass fraction of 0.3 being achieved in ∼2 h (). The overall agreement between the experimental observations and the simulation results indicates that the limited mixing of toluene SOA can be attributed to its high viscosity at low RH and the increased mixing at higher RH can be attributed to the lower viscosity of toluene SOA as RH increases.
Figure 6. Simulations of toluene SOA mixing experiments and the data from Ye et al. (Citation2016, Citation2018). Plotted is the mass fraction of SVOCs evaporated from population 1 in population 2. (a) Mass fraction of toluene SOA (population 1) in D-toluene SOA (population 2). RH legend indicates the RH at the end of the experiment. For each experiment, the RH begins at 10%. For RH 20%, the RH is increased at 1 h; for RH 40%, it is increased at 2 h; and for RH 90%, the experimental RH was increased continually, reaching 90% at 1 h, while in the model this is achieved by a stepwise increase in RH. (b) Mass fraction of toluene SOA (population 1) in limonene SOA (population 2) initially at 10% RH with an increase to 30% at 2 h. (c) Mass fraction of toluene SOA (population 1) in -caryophyllene SOA (population 2) initially at 10% RH with an increase to 30% at 2 h.
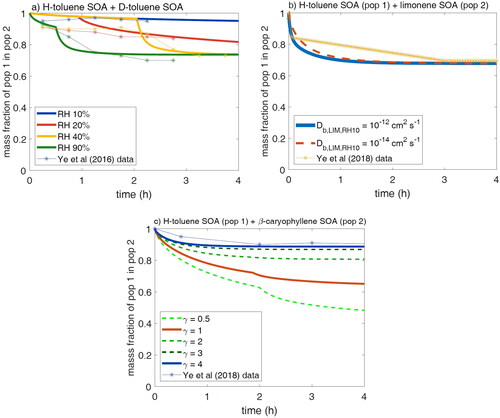
Toluene SOA + limonene SOA
Ye et al. (Citation2018) investigated the mixing of populations of D-toluene SOA and limonene SOA (Ye et al. Citation2018). As shown in , they observed an initial rapid increase in the mass fraction of toluene SOA present in the limonene SOA followed by a slow increase over the next 2 h at RH < 10%. The RH was then increased to ∼30% after 2 h. The mass fraction of toluene SOA in limonene SOA continued to increase slowly, leveling out at 0.3 after 3 h. They hypothesized that these two SOA populations mix ideally as this is the same mass fraction achieved from mixing toluene SOA with deuterated toluene SOA in Ye et al. (Citation2016) as discussed earlier.
Ullmann et al. (Citation2019) measured bulk diffusion coefficients in limonene SOA using a fluorescent technique to be 5.5 × 10⁻⁹ at 90% RH and 7.1 × 10⁻¹³ cm2 s−1 at 33% RH (Ullmann et al. Citation2019). Petters et al. (Citation2019) derived a viscosity of dry limonene SOA to be ∼106 Pa s, corresponding to Db of ∼10−14 cm2 s−1 for a 0.4 nm diffusing molecule based on the Stokes–Einstein equation. Hinks et al. (Citation2016) measured a viscosity approximately two orders of magnitude lower for dry limonene SOA, corresponding to a Db of ∼10−12 cm2 s−1 (Hinks et al. Citation2016). As these values are two orders of magnitude apart, we conducted simulations using both 10−14 and 10−12 cm2 s−1. We assumed that limonene SOA is entirely nonvolatile, as Ye et al. (Citation2018) observed very little uptake of limonene SOA into toluene SOA. The diffusivity of the toluene SOA is set to be Db,TOL,RH10 = 3 × 10⁻¹⁷ cm2 s−1 and Db,TOL,RH30 = 10−13 cm2 s−1 as discussed earlier.
A mass fraction of ∼0.3 is achieved in ∼2 h, as observed in Ye et al. (Citation2016) for both Db cases, but we are only able to reproduce the initial rapid uptake of toluene SOA with the Db of 10−12 cm2 s−1 (). The initial rapid uptake of toluene SOA compounds into limonene SOA is from the vapors present in equilibrium with toluene SOA in the main chamber where the toluene SOA was generated. Therefore, this initial uptake only depends on the Db of the limonene SOA and indicates that there are likely little diffusion limitations in limonene SOA, even at low RH. Uptake slows down after these vapors are depleted, and gradual uptake continues over the next 1–2 h. While the simulation reproduces the initial rapid uptake of toluene SOA into limonene SOA in the first 5 min, the observations show slower uptake than the model predicts at later times. This may be due to an overestimation of the gas-phase concentration of toluene semi-volatile oxidation products, leading to a larger effect of the initial vapor uptake on the total uptake. This discrepancy may also be caused by the model simplification by treating only two volatility bins with an assumption of an equal fraction of each semi-volatile species. The uptake of the lower volatility species is slower because a larger fraction of its total concentration starts in the viscous toluene SOA. Therefore, a larger fraction of lower volatility species would slow down the overall uptake, potentially leading to better agreement at later times. Additionally, we have assumed both populations are monodispersed as no information on specific size distributions is available. As diffusion limitations would lead to equilibrium being achieved slower in larger particles, faster uptake of toluene SOA vapors into smaller particles and slower uptake into larger particles of the limonene SOA would be expected. Overall, these simulations indicate that the enhanced mixing of toluene SOA and limonene SOA, relative to the H-toluene SOA and D-toluene SOA mixing at low RH, is due to the lower viscosity of the limonene SOA. The rapid initial uptake is due to vapors present in equilibrium with the toluene SOA, which slows down once these vapors are depleted.
Toluene SOA + -caryophyllene SOA
Ye et al. (Citation2018) also investigated particle–particle mixing of toluene SOA and β-caryophyllene SOA. As shown in blue markers in , they observed only ∼10% of the toluene SOA is taken up by the β-caryophyllene SOA after 4 h of contact with an increase in RH from 7 to 50%. This extent of mixing is lower than the ∼30% uptake observed for mixing with D-toluene SOA and limonene SOA as above, implying that non-ideality plays a role in suppressing mixing. A recent investigation has indeed observed that mixtures of β-caryophyllene SOA and toluene SOA formed two separate phases, indicating a lack of miscibility between these two populations (Mahrt et al. Citation2022).
Maclean et al. (Citation2021) determined that Db of organic molecules in β-caryophyllene SOA to be ∼4.1 × 10⁻¹² cm2 s−1 at 48% RH and ∼1.8 × 10⁻¹⁴ cm2 s−1 at 0% RH based on viscosity measurements and subsequent application of the fractional Stokes–Einstein equation, which is consistent with another measurement using a fluorescent molecule by Evoy et al. (Citation2021). These lead to characteristic bulk diffusion timescales of 1 h for particles smaller than 400 nm, even at 0% RH (Seinfeld and Pandis Citation2016). Hence, bulk diffusion limitations would be expected to be weak in the β-caryophyllene SOA at 50% RH (Grayson et al. Citation2016).
In , we simulate the mixing of toluene SOA and β-caryophyllene SOA using Db of β-caryophyllene SOA to be 10−14 cm2 s−1 for the first 2 h of the experiment at 7% RH and increase Db to 10−12 cm2 s−1 at 1.5 h when the RH is increased to ∼20% (Maclean et al. Citation2021). We consider non-ideality by applying the activity coefficient of SVOCs in β-caryophyllene SOA (γ) of 0.5, 1, 2, 3, and 4. We are able to reproduce the measurements with γ = 4. If we assume ideal mixing with γ = 1, a mass fraction of toluene SOA in β-caryophyllene SOA exceeds 0.1 within 2 h and reaches ∼0.3 within 4 h. To reproduce the measurements with ideal mixing by maintaining a mass fraction of 0.1 for over 4 h, it would require a very low Db of 10−16 cm2 s−1 for the entire experiment, which is unrealistically too low based on measurements. Therefore, our results suggest that the low uptake of toluene SOA compounds into β-caryophyllene SOA is due to miscibility limitations with a high activity coefficient without significant bulk diffusion limitations as speculated in Ye et al. (Citation2018).
Summary and implications
In this work, we investigate the particle–particle mixing timescale of a semi-volatile species in equilibrium with an aerosol population (population 1) when another population of aerosol (population 2) is introduced to that system. We find that particle–particle mixing can be prolonged when even one population is highly viscous and at extremes of volatility due to the slow evaporation of low-volatility species from population 1 and slow condensation of high-volatility species to population 2. Additionally, the mixing timescale is prolonged as the miscibility between the semi-volatile species and population 2 is increased with low activity coefficients. A notable exception to this is when population 2 is ultraviscous, and the semi-volatile species is favorably miscible in population 2 (γ2 < 1). In this case, the semi-volatile species can build up near the particle surface, allowing the equilibrium concentration in population 2 to be achieved faster.
Our model simulations suggest that mixing of SVOCs from a liquid population to a liquid or semi-solid population would proceed within 1 h for any miscibility investigated in this study. We also find that total organic aerosol concentration, which is known to affect equilibration timescales, does not have a large effect on the particle–particle mixing timescale. Thus, a typical assumption of equilibrium partitioning of SVOCs in aerosol models is likely to hold within 1-h timestep when the mixing populations have Db < 10−15 cm2 s−1. Note that under some conditions including low C0 and low γ2, equilibrium can be prolonged from hours to months and in this case, particle–particle mixing would need to be treated kinetically.
We have applied this model to reconcile apparent discrepancies between experimental measurements of SOA viscosity and direct measurements of particle–particle mixing. We show that mixing between H-toluene SOA and D-toluene SOA is prolonged at low RH because of slow bulk diffusivity, but mixing is achieved faster at moderate and high RH with little kinetic limitations. Additionally, the initial rapid mixing of toluene SOA into limonene SOA at low RH can be explained by gas–particle partitioning, while continuous slow mixing can be explained by slow evaporation from toluene SOA because of diffusion limitations. For mixing toluene SOA and -caryophyllene SOA, limited mixing is explained by limited miscibility between these two populations in the absence of kinetic limitations. Through these simulations, we show that these direct experimental observations of particle–particle mixing are consistent with measurements of SOA viscosity. The apparent discrepancy of rapid mixing between toluene SOA and limonene SOA but slow mixing between H-toluene and D-toluene SOA at low RH can be explained by the lower viscosity and little bulk diffusion limitations in limonene SOA. The apparent discrepancy of slow mixing between toluene and
-caryophyllene SOA but rapid mixing between H-toluene and D-toluene SOA at high RH can be explained by a high activity coefficient of toluene SOA in
-caryophyllene SOA.
Mixing of different types of organic aerosol from different sources occurs frequently in the atmosphere. For example, biomass burning and wildfires can generate large amounts of organic aerosol (BBOA), diluted by mixing with background aerosols with different chemical compositions and phase states (Liu et al. Citation2017). Measurements of BBOA viscosity indicate that the viscosity can vary over orders of magnitude with water content. Models that have assumed completely internal mixtures between biomass burning and non-biomass burning components of aerosol have dramatically overestimated the warming effect of black carbon from biomass burning, and assuming external mixtures brings model predictions of single-scattering albedo into better agreement with observations (Cappa et al. Citation2012; Brown et al. Citation2021; Jahl et al. Citation2021). Thus, to accurately represent the climatic effect of biomass burning aerosol, it is critical to understand the extent to which it mixes with background aerosol. Outdoor-to-indoor aerosol mixing can also have implications for the evolution of particle size distributions and multiphase processes occurring between species exchanged between the two populations. Indoor and outdoor aerosols are formed and evolved under very different environmental conditions and can, therefore, exist in different phase states when they come into contact with each other. Therefore, it is also critical to evaluate the timescales for mixing indoor and outdoor aerosol populations, which we intend to investigate in future studies.
Acknowledgments
The authors would like to acknowledge Dr. Qing Ye for helpful discussions and comments on the manuscript.
Disclosure statement
No potential conflict of interest was reported by the author(s).
Additional information
Funding
References
- Bateman, A. P., A. K. Bertram, and S. T. Martin. 2015. Hygroscopic influence on the semisolid-to-liquid transition of secondary organic materials. J. Phys. Chem. A 119 (19):4386–4395. doi: 10.1021/jp508521c.
- Berkemeier, T., M. Shiraiwa, U. Pöschl, and T. Koop. 2014. Competition between water uptake and ice nucleation by glassy organic aerosol particles. Atmos. Chem. Phys. 14 (22):12513–12531. doi: 10.5194/acp-14-12513-2014.
- Bertozzi, B., R. Wagner, J. Song, K. Höhler, J. Pfeifer, H. Saathoff, T. Leisner, and O. Möhler. 2021. Ice nucleation ability of ammonium sulfate aerosol particles internally mixed with secondary organics. Atmos. Chem. Phys. 21 (13):10779–10798. doi: 10.5194/acp-21-10779-2021.
- Booth, A. M., B. Murphy, I. Riipinen, C. J. Percival, and D. O. Topping. 2014. Connecting bulk viscosity measurements to kinetic limitations on attaining equilibrium for a model aerosol composition. Environ. Sci. Technol. 48 (16):9298–9305. doi: 10.1021/es501705c.
- Brown, H., X. Liu, R. Pokhrel, S. Murphy, Z. Lu, R. Saleh, T. Mielonen, H. Kokkola, T. Bergman, G. Myhre, et al. 2021. Biomass burning aerosols in most climate models are too absorbing. Nat. Commun. 12 (1):277. doi: 10.1038/s41467-020-20482-9.
- Cappa, C. D., T. B. Onasch, P. Massoli, D. R. Worsnop, T. S. Bates, E. S. Cross, P. Davidovits, J. Hakala, K. L. Hayden, B. T. Jobson, et al. 2012. Radiative absorption enhancements due to the mixing state of atmospheric black carbon. Science 337 (6098):1078–1081. doi: 10.1126/science.1223447.
- Cummings, B. E., A. M. Avery, P. F. DeCarlo, and M. S. Waring. 2021. Improving predictions of indoor aerosol concentrations of outdoor origin by considering the phase change of semivolatile material driven by temperature and mass-loading gradients. Environ. Sci. Technol. 55 (13):9000–9011. doi: 10.1021/acs.est.1c00417.
- Domaros, M., P. S. J. von Lakey, M. Shiraiwa, and D. J. Tobias. 2020. Multiscale modeling of human skin oil-induced indoor air chemistry: Combining kinetic models and molecular dynamics. J. Phys. Chem. B 124 (18):3836–3843. doi: 10.1021/acs.jpcb.0c02818.
- Donahue, N. M., W. Chuang, and M. Schervish. 2019. Gas-phase organic oxidation chemistry and atmospheric particles. In Advances in atmospheric chemistry, Vol. 2, 199–317. New Jersey: World Scientific. doi: 10.1142/9789813271838_0004.
- Donahue, N. M., S. A. Epstein, S. N. Pandis, and A. L. Robinson. 2011. A two-dimensional volatility basis set: 1. Organic-aerosol mixing thermodynamics. Atmos. Chem. Phys. 11 (7):3303–3318. doi: 10.5194/acp-11-3303-2011.
- Erdakos, G. B., W. E. Asher, J. H. Seinfeld, and J. F. Pankow. 2006. Prediction of activity coefficients in liquid aerosol particles containing organic compounds, dissolved inorganic salts, and water—Part 1: Organic compounds and water by consideration of short- and long-range effects using X-UNIFAC.1. Atmos. Environ. 40 (33):6410–6421. doi: 10.1016/j.atmosenv.2006.04.030.
- Evoy, E., K. J. Kiland, Y. Huang, E. G. Schnitzler, A. M. Maclean, S. Kamal, J. P. D. Abbatt, and A. K. Bertram. 2021. Diffusion coefficients and mixing times of organic molecules in β-caryophyllene secondary organic aerosol (SOA) and biomass burning organic aerosol (BBOA). ACS Earth Space Chem. 5 (11):3268–3278. doi: 10.1021/acsearthspacechem.1c00317.
- Freedman, M. A. 2017. Phase separation in organic aerosol. Chem. Soc. Rev. 46 (24):7694–7705. doi: 10.1039/C6CS00783J.
- Freedman, M. A. 2020. Liquid–liquid phase separation in supermicrometer and submicrometer aerosol particles. Acc. Chem. Res. 53 (6):1102–1110. doi: 10.1021/acs.accounts.0c00093.
- Gkatzelis, G. I., D. K. Papanastasiou, V. A. Karydis, T. Hohaus, Y. Liu, S. H. Schmitt, P. Schlag, H. Fuchs, A. Novelli, Q. Chen, et al. 2021. Uptake of water-soluble gas-phase oxidation products drives organic particulate pollution in Beijing. Geophys. Res. Lett. 48 (8):e2020GL091351. doi: 10.1029/2020GL091351.
- Goldstein, A. H., and I. E. Galbally. 2007. Known and unknown organic constituents in the earth’ s atmosphere. Environ. Sci. Technol. 41 (5):1514–1521. doi: 10.1021/es072476p.
- Grayson, J. W., Y. Zhang, A. Mutzel, L. Renbaum-Wolff, O. Böge, S. Kamal, H. Herrmann, S. T. Martin, and A. K. Bertram. 2016. Effect of varying experimental conditions on the viscosity of α-pinene derived secondary organic material. Atmos. Chem. Phys. 16 (10):6027–6040. doi: 10.5194/acp-16-6027-2016.
- Habib, L., and N. Donahue. 2022. Single particle measurements of mixing between mimics for biomass burning and aged secondary organic aerosols. Environ. Sci: Atmos. 2 (4):727–737. doi: 10.1039/D2EA00017B.
- He, Y., A. Akherati, T. Nah, N. L. Ng, L. A. Garofalo, D. K. Farmer, M. Shiraiwa, R. A. Zaveri, C. D. Cappa, J. R. Pierce, et al. 2021. Particle size distribution dynamics can help constrain the phase state of secondary organic aerosol. Environ. Sci. Technol. 55 (3):1466–1476. doi: 10.1021/acs.est.0c05796.
- Hilditch, T. G., D. A. Hardy, N. J. Stevens, P. B. Glover, and J. P. Reid. 2023. Single-particle measurements and estimations of activity coefficients for semi-volatile organic compounds in organic aerosol of known chemical speciation. Environ. Sci: Atmos. 3 (5):931–941. doi: 10.1039/D2EA00180B.
- Hinks, M. L., M. V. Brady, H. Lignell, M. Song, J. W. Grayson, A. K. Bertram, P. Lin, A. Laskin, J. Laskin, and S. A. Nizkorodov. 2016. Effect of viscosity on photodegradation rates in complex secondary organic aerosol materials. Phys. Chem. Chem. Phys. 18 (13):8785–8793. doi: 10.1039/C5CP05226B.
- Hodzic, A., P. Campuzano-Jost, H. Bian, M. Chin, P. R. Colarco, D. A. Day, K. D. Froyd, B. Heinold, D. S. Jo, J. M. Katich, et al. 2020. Characterization of organic aerosol across the global remote troposphere: A comparison of atom measurements and global chemistry models. Atmos. Chem. Phys. 20 (8):4607–4635. doi: 10.5194/acp-20-4607-2020.
- Huang, Y., F. Mahrt, S. Xu, M. Shiraiwa, A. Zuend, and A. K. Bertram. 2021. Coexistence of three liquid phases in individual atmospheric aerosol particles. Proc. Natl. Acad. Sci. USA. 118 (16):e2102512118. doi: 10.1073/pnas.2102512118.
- Hyttinen, N., R. Heshmatnezhad, J. Elm, T. Kurtén, and N. L. Prisle. 2020. Technical note: Estimating aqueous solubilities and activity coefficients of mono- and α,ω-dicarboxylic acids using COSMOTherm. Atmos. Chem. Phys. 20 (21):13131–13143. doi: 10.5194/acp-20-13131-2020.
- Jahl, L. G., T. A. Brubaker, M. J. Polen, L. G. Jahn, K. P. Cain, B. B. Bowers, W. D. Fahy, S. Graves, and R. C. Sullivan. 2021. Atmospheric aging enhances the ice nucleation ability of biomass-burning aerosol. Sci. Adv. 7 (9):eabd3440. doi: 10.1126/sciadv.abd3440.
- Jeong, R., J. Lilek, A. Zuend, R. Xu, M. N. Chan, D. Kim, H. G. Moon, and M. Song. 2022. Viscosity and physical state of sucrose mixed with ammonium sulfate droplets. Atmos. Chem. Phys. 22 (13):8805–8817. doi: 10.5194/acp-22-8805-2022.
- Jimenez, J. L., M. R. Canagaratna, N. M. Donahue, A. S. H. Prevot, Q. Zhang, J. H. Kroll, P. F. DeCarlo, J. D. Allan, H. Coe, N. L. Ng, et al. 2009. Evolution of organic aerosols in the atmosphere. Science 326 (5959):1525–1529. doi: 10.1126/science.1180353.
- Julin, J., P. M. Winkler, N. M. Donahue, P. E. Wagner, and I. Riipinen. 2014. Near-unity mass accommodation coefficient of organic molecules of varying structure. Environ. Sci. Technol. 48 (20):12083–12089. doi: 10.1021/es501816h.
- Kasparoglu, S., Y. Li, M. Shiraiwa, and M. D. Petters. 2021. Toward closure between predicted and observed particle viscosity over a wide range of temperatures and relative humidity. Atmos. Chem. Phys. 21 (2):1127–1141. doi: 10.5194/acp-21-1127-2021.
- Kaur Kohli, R., S. Salas, B. Shokoor, C. L. Price, and J. F. Davies. 2023. Chemically resolved evaporation dynamics of dicarboxylic acid mixtures in solid particles. Anal. Chem. 95 (31):11831–11838. doi: 10.1021/acs.analchem.3c02475.
- Kiland, K. J., A. M. Maclean, S. Kamal, and A. K. Bertram. 2019. Diffusion of organic molecules as a function of temperature in a sucrose matrix (a proxy for secondary organic aerosol). J. Phys. Chem. Lett. 10 (19):5902–5908. doi: 10.1021/acs.jpclett.9b02182.
- Kim, Y., K. Sartelet, and F. Couvidat. 2019. Modeling the effect of non-ideality, dynamic mass transfer and viscosity on SOA formation in a 3-D air quality model. Atmos. Chem. Phys. 19 (2):1241–1261. doi: 10.5194/acp-19-1241-2019.
- Lei, Z., N. E. Olson, Y. Zhang, Y. Chen, A. T. Lambe, J. Zhang, N. J. White, J. M. Atkin, M. M. Banaszak Holl, Z. Zhang, et al. 2022. Morphology and viscosity changes after reactive uptake of isoprene epoxydiols in submicrometer phase separated particles with secondary organic aerosol formed from different volatile organic compounds. ACS Earth Space Chem. 6 (4):871–882. doi: 10.1021/acsearthspacechem.1c00156.
- Li, W., L. Liu, J. Zhang, L. Xu, Y. Wang, Y. Sun, and Z. Shi. 2021. Microscopic evidence for phase separation of organic species and inorganic salts in fine ambient aerosol particles. Environ. Sci. Technol. 55 (4):2234–2242. doi: 10.1021/acs.est.0c02333.
- Li, Y., and M. Shiraiwa. 2019. Timescales of secondary organic aerosols to reach equilibrium at various temperatures and relative humidities. Atmos. Chem. Phys. 19 (9):5959–5971. doi: 10.5194/acp-19-5959-2019.
- Li, Y. J., P. Liu, Z. Gong, Y. Wang, A. P. Bateman, C. Bergoend, A. K. Bertram, and S. T. Martin. 2015. Chemical reactivity and liquid/nonliquid states of secondary organic material. Environ. Sci. Technol. 49 (22):13264–13274. doi: 10.1021/acs.est.5b03392.
- Liu, P., Y. J. Li, Y. Wang, M. K. Gilles, R. A. Zaveri, A. K. Bertram, and S. T. Martin. 2016. Lability of secondary organic particulate matter. Proc. Natl. Acad. Sci. USA 113 (45):12643–12648. doi: 10.1073/pnas.1603138113.
- Liu, X., L. G. Huey, R. J. Yokelson, V. Selimovic, I. J. Simpson, M. Müller, J. L. Jimenez, P. Campuzano‐Jost, A. J. Beyersdorf, D. R. Blake, et al. 2017. Airborne measurements of Western U.S. wildfire emissions: comparison with prescribed burning and air quality implications. JGR. Atmospheres 122 (11):6108–6129. doi: 10.1002/2016JD026315.
- Liu, Y., Z. Wu, Y. Wang, Y. Xiao, F. Gu, J. Zheng, T. Tan, D. Shang, Y. Wu, L. Zeng, et al. 2017. Submicrometer particles are in the liquid state during heavy haze episodes in the urban atmosphere of Beijing, China. Environ. Sci. Technol. Lett. 4 (10):427–432. doi: 10.1021/acs.estlett.7b00352.
- Maclean, A. M., N. R. Smith, Y. Li, Y. Huang, A. P. S. Hettiyadura, G. V. Crescenzo, M. Shiraiwa, A. Laskin, S. A. Nizkorodov, and A. K. Bertram. 2021. Humidity-dependent viscosity of secondary organic aerosol from ozonolysis of β-caryophyllene: measurements, predictions, and implications. ACS Earth Space Chem. 5 (2):305–318. doi: 10.1021/acsearthspacechem.0c00296.
- Mahrt, F., L. Peng, J. Zaks, Y. Huang, P. E. Ohno, N. R. Smith, F. K. A. Gregson, Y. Qin, C. L. Faiola, S. T. Martin, et al. 2022. Not all types of secondary organic aerosol mix: two phases observed when mixing different secondary organic aerosol types. Atmos. Chem. Phys. 22 (20):13783–13796. doi: 10.5194/acp-22-13783-2022.
- Mai, H., M. Shiraiwa, R. C. Flagan, and J. H. Seinfeld. 2015. Under what conditions can equilibrium gas–particle partitioning be expected to hold in the atmosphere? Environ. Sci. Technol. 49 (19):11485–11491. doi: 10.1021/acs.est.5b02587.
- Marcolli, C., B. P. Luo, T. Peter, and F. G. Wienhold. 2004. Internal mixing of the organic aerosol by gas phase diffusion of semivolatile organic compounds. Atmos. Chem. Phys. 4 (11/12):2593–2599. doi: 10.5194/acp-4-2593-2004.
- Martin, S. T., M. O. Andreae, D. Althausen, P. Artaxo, H. Baars, S. Borrmann, Q. Chen, D. K. Farmer, A. Guenther, S. S. Gunthe, et al. 2010. An overview of the Amazonian aerosol characterization experiment 2008 (AMAZE-08). Atmos. Chem. Phys. 10 (23):11415–11438. doi: 10.5194/acp-10-11415-2010.
- Mu, Q., M. Shiraiwa, M. Octaviani, N. Ma, A. Ding, H. Su, G. Lammel, U. Pöschl, and Y. Cheng. 2018. Temperature effect on phase state and reactivity controls atmospheric multiphase chemistry and transport of PAHs. Sci. Adv. 4 (3):eaap7314. doi: 10.1126/sciadv.aap7314.
- Octaviani, M., M. Shrivastava, R. A. Zaveri, A. Zelenyuk, Y. Zhang, Q. Z. Rasool, D. M. Bell, M. Riva, M. Glasius, and J. D. Surratt. 2021. Modeling the size distribution and chemical composition of secondary organic aerosols during the reactive uptake of isoprene-derived epoxydiols under low-humidity condition. ACS Earth Space Chem. 5 (11):3247–3257. doi: 10.1021/acsearthspacechem.1c00303.
- O'Meara, S., D. O. Topping, and G. McFiggans. 2016. The rate of equilibration of viscous aerosol particles. Atmos. Chem. Phys. 16 (8):5299–5313. doi: 10.5194/acp-16-5299-2016.
- Petters, S. S., S. M. Kreidenweis, A. P. Grieshop, P. J. Ziemann, and M. D. Petters. 2019. Temperature- and humidity-dependent phase states of secondary organic aerosols. Geophys. Res. Lett. 46 (2):1005–1013. doi: 10.1029/2018GL080563.
- Philip, S., R. V. Martin, and C. A. Keller. 2016. Sensitivity of chemistry-transport model simulations to the duration of chemical and transport operators: A case study with GEOS-Chem V10-01. Geosci. Model Dev. 9 (5):1683–1695. doi: 10.5194/gmd-9-1683-2016.
- Pöschl, U., S. T. Martin, B. Sinha, Q. Chen, S. S. Gunthe, J. A. Huffman, S. Borrmann, D. K. Farmer, R. M. Garland, G. Helas, et al. 2010. Rainforest aerosols as biogenic nuclei of clouds and precipitation in the Amazon. Science 329 (5998):1513–1516. doi: 10.1126/science.1191056.
- Pöschl, U., and M. Shiraiwa. 2015. Multiphase chemistry at the atmosphere–biosphere interface influencing climate and public health in the anthropocene. Chem. Rev. 115 (10):4440–4475. doi: 10.1021/cr500487s.
- Prather, K. A., C. D. Hatch, and V. H. Grassian. 2008. Analysis of atmospheric aerosols. Annu Rev Anal Chem (Palo Alto Calif) 1 (1):485–514. doi: 10.1146/annurev.anchem.1.031207.113030.
- Preston, T. C., and A. Zuend. 2022. Equilibration times in viscous and viscoelastic aerosol particles. Environ. Sci: Atmos. 2 (6):1376–1388. doi: 10.1039/D2EA00065B.
- Price, H. C., J. Mattsson, Y. Zhang, A. K. Bertram, J. F. Davies, J. W. Grayson, S. T. Martin, D. O'Sullivan, J. P. Reid, A. M. J. Rickards, et al. 2015. Water diffusion in atmospherically relevant α-pinene secondary organic material. Chem. Sci. 6 (8):4876–4883. doi: 10.1039/C5SC00685F.
- Rasool, Q. Z., M. Shrivastava, Y. Liu, B. Gaudet, and B. Zhao. 2023. Modeling the impact of the organic aerosol phase state on multiphase oh reactive uptake kinetics and the resultant heterogeneous oxidation timescale of organic aerosol in the Amazon rainforest. ACS Earth Space Chem. 7 (5):1009–1024. doi: 10.1021/acsearthspacechem.2c00366.
- Rasool, Q. Z., M. Shrivastava, M. Octaviani, B. Zhao, B. Gaudet, and Y. Liu. 2021. Modeling volatility-based aerosol phase state predictions in the Amazon rainforest. ACS Earth Space Chem. 5 (10):2910–2924. doi: 10.1021/acsearthspacechem.1c00255.
- Reid, J. P., A. K. Bertram, D. O. Topping, A. Laskin, S. T. Martin, M. D. Petters, F. D. Pope, and G. Rovelli. 2018. The viscosity of atmospherically relevant organic particles. Nat. Commun. 9 (1):956. doi: 10.1038/s41467-018-03027-z.
- Riemer, N., A. P. Ault, M. West, R. L. Craig, and J. H. Curtis. 2019. Aerosol mixing state: Measurements, modeling, and impacts. Rev. Geophys. 57 (2):187–249. doi: 10.1029/2018RG000615.
- Riipinen, I., J. R. Pierce, T. Yli-Juuti, T. Nieminen, S. Häkkinen, M. Ehn, H. Junninen, K. Lehtipalo, T. Petäjä, J. Slowik, et al. 2011. Organic condensation: A vital link connecting aerosol formation to cloud condensation nuclei (ccn) concentrations. Atmos. Chem. Phys. 11 (8):3865–3878. doi: 10.5194/acp-11-3865-2011.
- Robinson, E. S., R. Saleh, and N. M. Donahue. 2013. Organic aerosol mixing observed by single-particle mass spectrometry. J. Phys. Chem. A 117 (51):13935–13945. doi: 10.1021/jp405789t.
- Roston, D. 2021. Molecular dynamics simulations demonstrate that non-ideal mixing dominates subsaturation organic aerosol hygroscopicity. Phys. Chem. Chem. Phys. 23 (15):9218–9227. doi: 10.1039/D1CP00245G.
- Rusumdar, A. J., A. Tilgner, R. Wolke, and H. Herrmann. 2020. Treatment of non-ideality in the SPACCIM multiphase model – Part 2: Impacts on the multiphase chemical processing in deliquesced aerosol particles. Atmos. Chem. Phys. 20 (17):10351–10377. doi: 10.5194/acp-20-10351-2020.
- Saleh, R., N. M. Donahue, and A. L. Robinson. 2013. Time scales for gas-particle partitioning equilibration of secondary organic aerosol formed from alpha-pinene ozonolysis. Environ. Sci. Technol. 47 (11):5588–5594. doi: 10.1021/es400078d.
- Schervish, M., and M. Shiraiwa. 2023. Impact of phase state and non-ideal mixing on equilibration timescales of secondary organic aerosol partitioning. Atmos. Chem. Phys. 23 (1):221–233. doi: 10.5194/acp-23-221-2023.
- Schmedding, R., Q. Z. Rasool, Y. Zhang, H. O. T. Pye, H. Zhang, Y. Chen, J. D. Surratt, F. D. Lopez-Hilfiker, J. A. Thornton, A. H. Goldstein, et al. 2020. Predicting secondary organic aerosol phase state and viscosity and its effect on multiphase chemistry in a regional-scale air quality model. Atmos. Chem. Phys. 20 (12):8201–8225. doi: 10.5194/acp-20-8201-2020.
- Sedlacek, A. J. I., E. R. Lewis, T. B. Onasch, P. Zuidema, J. Redemann, D. Jaffe, and L. I. Kleinman. 2022. Using the black carbon particle mixing state to characterize the lifecycle of biomass burning aerosols. Environ. Sci. Technol. 56 (20):14315–14325. doi: 10.1021/acs.est.2c03851.
- Seinfeld, J. H., and S. N. Pandis. 2016. Atmospheric chemistry and physics: from air pollution to climate change. 3rd ed. New York: Wiley. https://www.wiley.com/en-us/Atmospheric+Chemistry+and+Physics:+From+Air+Pollution+to+Climate+Change,+3rd+Edition-p-9781118947401.
- Shen, C., W. Zhang, J. Choczynski, J. F. Davies, and H. Zhang. 2022. Phase state and relative humidity regulate the heterogeneous oxidation kinetics and pathways of organic-inorganic mixed aerosols. Environ. Sci. Technol. 56 (22):15398–15407. doi: 10.1021/acs.est.2c04670.
- Shiraiwa, M., M. Ammann, T. Koop, and U. Pöschl. 2011. Gas uptake and chemical aging of semisolid organic aerosol particles. Proc. Natl. Acad. Sci. USA 108 (27):11003–11008. doi: 10.1073/pnas.1103045108.
- Shiraiwa, M., Y. Li, A. P. Tsimpidi, V. A. Karydis, T. Berkemeier, S. N. Pandis, J. Lelieveld, T. Koop, and U. Pöschl. 2017. Global distribution of particle phase state in atmospheric secondary organic aerosols. Nat. Commun. 8 (1):15002. doi: 10.1038/ncomms15002.
- Shiraiwa, M., C. Pfrang, T. Koop, and U. Pöschl. 2012. Kinetic multi-layer model of gas-particle interactions in aerosols and clouds (KM-GAP): Linking condensation, evaporation and chemical reactions of organics, oxidants and water. Atmos. Chem. Phys. 12 (5):2777–2794. doi: 10.5194/acp-12-2777-2012.
- Shiraiwa, M., and J. H. Seinfeld. 2012. Equilibration timescale of atmospheric secondary organic aerosol partitioning. Geophys. Res. Lett. 39 (24):L24801. doi: 10.1029/2012GL054008.
- Shiraiwa, M., A. Zuend, A. K. Bertram, and J. H. Seinfeld. 2013. Gas–particle partitioning of atmospheric aerosols: Interplay of physical state, non-ideal mixing and morphology. Phys. Chem. Chem. Phys. 15 (27):11441–11453. doi: 10.1039/C3CP51595H.
- Shrivastava, M., C. D. Cappa, J. Fan, A. H. Goldstein, A. B. Guenther, J. L. Jimenez, C. Kuang, A. Laskin, S. T. Martin, N. L. Ng, et al. 2017. Recent advances in understanding secondary organic aerosol: Implications for global climate forcing. Rev. Geophys. 55 (2):509–559. doi: 10.1002/2016RG000540.
- Shrivastava, M., S. Lou, A. Zelenyuk, R. C. Easter, R. A. Corley, B. D. Thrall, P. J. Rasch, J. D. Fast, S. L. Massey Simonich, H. Shen, et al. 2017. Global long-range transport and lung cancer risk from polycyclic aromatic hydrocarbons shielded by coatings of organic aerosol. Proc. Natl. Acad. Sci. USA 114 (6):1246–1251. doi: 10.1073/pnas.1618475114.
- Shrivastava, M., Q. Z. Rasool, B. Zhao, M. Octaviani, R. A. Zaveri, A. Zelenyuk, B. Gaudet, Y. Liu, J. E. Shilling, J. Schneider, et al. 2022. Tight coupling of surface and in-plant biochemistry and convection governs key fine particulate components over the amazon rainforest. ACS Earth Space Chem. 6 (2):380–390. doi: 10.1021/acsearthspacechem.1c00356.
- Song, M., S. Ham, R. J. Andrews, Y. You, and A. K. Bertram. 2018. Liquid–liquid phase separation in organic particles containing one and two organic species: importance of the average O:C. Atmos. Chem. Phys. 18 (16):12075–12084. doi: 10.5194/acp-18-12075-2018.
- Song, M., R. Jeong, D. Kim, Y. Qiu, X. Meng, Z. Wu, A. Zuend, Y. Ha, C. Kim, H. Kim, et al. 2022. Comparison of phase states of PM2.5 over megacities, Seoul and Beijing, and their implications on particle size distribution. Environ. Sci. Technol. 56 (24):17581–17590. doi: 10.1021/acs.est.2c06377.
- Song, M., P. F. Liu, S. J. Hanna, R. A. Zaveri, K. Potter, Y. You, S. T. Martin, and A. K. Bertram. 2016. Relative humidity-dependent viscosity of secondary organic material from toluene photo-oxidation and possible implications for organic particulate matter over megacities. Atmos. Chem. Phys. 16 (14):8817–8830. doi: 10.5194/acp-16-8817-2016.
- Song, M., C. Marcolli, U. K. Krieger, A. Zuend, and T. Peter. 2012. Liquid-liquid phase separation in aerosol particles: Dependence on O:C, organic functionalities, and compositional complexity. Geophys. Res. Lett. 39 (19):n/a–/a. doi: 10.1029/2012GL052807.
- Song, Y.-C., J. Lilek, J. B. Lee, M. N. Chan, Z. Wu, A. Zuend, and M. Song. 2021. Viscosity and phase state of aerosol particles consisting of sucrose mixed with inorganic salts. Atmos. Chem. Phys. 21 (13):10215–10228. doi: 10.5194/acp-21-10215-2021.
- Sheldon, S., C. J. M. Choczynski, K. Morton, T. Palacios Diaz, R. D. Davis, and J. F. Davies. 2023. Exploring the hygroscopicity, water diffusivity, and viscosity of organic–inorganic aerosols—A case study on internally-mixed citric acid and ammonium sulfate particles. Environ. Sci: Atmos. 3 (1):24–34. doi: 10.1039/D2EA00116K.
- Ullmann, D. A., M. L. Hinks, A. M. Maclean, C. L. Butenhoff, J. W. Grayson, K. Barsanti, J. L. Jimenez, S. A. Nizkorodov, S. Kamal, and A. K. Bertram. 2019. Viscosities, diffusion coefficients, and mixing times of intrinsic fluorescent organic molecules in brown limonene secondary organic aerosol and tests of the Stokes–Einstein equation. Atmos. Chem. Phys. 19 (3):1491–1503. doi: 10.5194/acp-19-1491-2019.
- Wallace, B. J., C. L. Price, J. F. Davies, and T. C. Preston. 2021. Multicomponent diffusion in atmospheric aerosol particles. Environ. Sci: Atmos. 1 (1):45–55. doi: 10.1039/D0EA00008F.
- Wang, B., A. T. Lambe, P. Massoli, T. B. Onasch, P. Davidovits, D. R. Worsnop, and D. A. Knopf. 2012. The deposition ice nucleation and immersion freezing potential of amorphous secondary organic aerosol: Pathways for ice and mixed-phase cloud formation. J. Geophys. Res. 117 (D16):n/a–/a. doi: 10.1029/2012JD018063.
- Wilson, J., D. Imre, J. Beránek, M. Shrivastava, and A. Zelenyuk. 2015. Evaporation kinetics of laboratory-generated secondary organic aerosols at elevated relative humidity. Environ. Sci. Technol. 49 (1):243–249. doi: 10.1021/es505331d.
- Ye, Q., E. Shipley Robinson, X. Ding, P. Ye, R. C. Sullivan, and N. M. Donahue. 2016. Mixing of secondary organic aerosols versus relative humidity. Proc. Natl. Acad. Sci. USA 113 (45):12649–12654. doi: 10.1073/pnas.1604536113.
- Ye, Q., M. A. Upshur, E. S. Robinson, F. M. Geiger, R. C. Sullivan, R. J. Thomson, and N. M. Donahue. 2018. Following particle-particle mixing in atmospheric secondary organic aerosols by using isotopically labeled terpenes. Chem 4 (2):318–333. doi: 10.1016/j.chempr.2017.12.008.
- Zaveri, R. A., J. E. Shilling, A. Zelenyuk, M. A. Zawadowicz, K. Suski, S. China, D. M. Bell, D. Veghte, and A. Laskin. 2020. Particle-phase diffusion modulates partitioning of semivolatile organic compounds to aged secondary organic aerosol. Environ. Sci. Technol. 54 (5):2595–2605. doi: 10.1021/acs.est.9b05514.
- Zhang, Q., J. L. Jimenez, M. R. Canagaratna, J. D. Allan, H. Coe, I. Ulbrich, M. R. Alfarra, A. Takami, A. M. Middlebrook, Y. L. Sun, et al. 2007. Ubiquity and dominance of oxygenated species in organic aerosols in anthropogenically-influenced northern hemisphere midlatitudes. Geophys. Res. Lett. 34 (13):n/a–/a. doi: 10.1029/2007GL029979.
- Zhang, Y., Y. Chen, A. T. Lambe, N. E. Olson, Z. Lei, R. L. Craig, Z. Zhang, A. Gold, T. B. Onasch, J. T. Jayne, et al. 2018. Effect of the aerosol-phase state on secondary organic aerosol formation from the reactive uptake of isoprene-derived epoxydiols (IEPOX). Environ. Sci. Technol. Lett. 5 (3):167–174. doi: 10.1021/acs.estlett.8b00044.
- Zhou, S., B. C. H. Hwang, P. S. J. Lakey, A. Zuend, J. P. D. Abbatt, and M. Shiraiwa. 2019. Multiphase reactivity of polycyclic aromatic hydrocarbons is driven by phase separation and diffusion limitations. Proc. Natl. Acad. Sci. USA 116 (24):11658–11663. doi: 10.1073/pnas.1902517116.
- Zuend, A., C. Marcolli, A. M. Booth, D. M. Lienhard, V. Soonsin, U. K. Krieger, D. O. Topping, G. McFiggans, T. Peter, and J. H. Seinfeld. 2011. New and extended parameterization of the thermodynamic model AIOMFAC: Calculation of activity coefficients for organic-inorganic mixtures containing carboxyl, hydroxyl, carbonyl, ether, ester, alkenyl, alkyl, and aromatic functional groups. Atmos. Chem. Phys. 11 (17):9155–9206. doi: 10.5194/acp-11-9155-2011.
- Zuend, A., C. Marcolli, B. P. Luo, and T. Peter. 2008. A thermodynamic model of mixed organic-inorganic aerosols to predict activity coefficients. Atmos. Chem. Phys. 8 (16):4559–4593. doi: 10.5194/acp-8-4559-2008.