
ABSTRACT
Distribution, body size and genetic structure of the poorly known New Zealand mayfly Siphlaenigma janae were investigated to improve understanding of its conservation status. It has now been recorded from 42 locations, 22 of which are reported for the first time. The distribution of S. janae extends from Northland to the central North Island, and also into the northwestern South Island. Population structure consisted of three distinct haplotype networks; two in the North Island and one in the South Island. Maximum uncorrected genetic distance was 6.1% but no strong evidence for the presence of sibling species was found. The specialist nymphs predominantly live in low-gradient first- and second-order forested streams, a habitat that is increasingly being threatened by land-use modification. We recommend S. janae remain classified as Nationally Vulnerable due to its unique taxonomic position, regionally distinct genetic structure and fragmented population that is likely experiencing ongoing decline.
Introduction
The endemic New Zealand mayfly Siphlaenigma janae Penniket, Citation1962 is the only described species of the family Siphlaenigmatidae (Penniket Citation1962). The type series of specimens were collected from a small stream, informally known as ‘Baxter’s Creek’, which flowed into the Arnold River on the West Coast of the South Island. It was the only known location of S. janae at the time. The taxonomic status and phylogenetic relationships of Siphlaenigmatidae have been the subjects of some debate. In establishing the family, Penniket (Citation1962) showed that it possessed numerous morphological characters, including aspects of wing venation, external genitalia, eyes and legs that were intermediate between those of Baetidae and Siphlonuridae, as defined at the time. However, Riek (Citation1973) considered it to be a subfamily of Baetidae (i.e. Siphlaenigmatinae) and both McCafferty & Edmunds (Citation1979) and Landa & Soldán (Citation1985) supported this change. Subsequently, McCafferty (Citation1991) accorded the taxon family status once again and more recent workers have accepted that designation. The phylogenetic position of Siphlaenigmatidae within Ephemeroptera is not clear. A detailed morphological study by Staniczek (Citation1997) indicated that S. janae has retained many plesiomorphic baetoid characters and supported the contention that Baetidae and Siphlaenigmatidae were sister groups. The results of a study based on 101 morphological characters by Ogden et al. (Citation2009) also placed the two families together, but their phylogeny based on DNA sequences from five genes grouped the Siphlaenigmatidae with several other families, including two with New Zealand representatives (Coloburiscidae and Ameletopsidae), and not with Baetidae (Ogden et al. Citation2009).
Knowledge of the distribution of S. janae was expanded by Towns (Citation1978) who provided the first records of its occurrence in the North Island. He found nymphs in slow-flowing reaches of forest streams in the Waitakere Ranges west of Auckland and also listed the localities of several specimens present in museum collections. A second species reputed to be from Australia was described from nymphs by Lugo-Ortiz & McCafferty (Citation1998), but was subsequently synonymised with S. janae, when the material was found to have actually come from New Zealand (McCafferty Citation1999). More recently, Hitchings (Citation2001) and Hitchings et al. (Citation2015) published maps showing the collection sites of material held in the Canterbury Museum. The maps indicate a fragmented distribution and the species was listed as Nationally Vulnerable by Grainger et al. (Citation2014). Except for a description of the egg by Koss & Edmunds (Citation1974) and observations made by Towns (Citation1978) on the general habitat of nymphs, including their propensity to be associated with algae or terrestrial vegetation trailing in the water, nothing is known about the life history and ecology of S. janae.
The specific aims of the present study were to reassess the conservation status of S. janae based on: (1) an update of the known distribution and habitat; (2) an investigation of body size variation within the species; and (3) a preliminary examination of the genetic structure of the species using DNA sequence data (fragments of the COI and 28S genes). In particular, we looked for evidence that might indicate the presence of separate species in the North and South Island populations, as in the mayfly genera Rallidens and Ichthybotus (Hitchings et al. Citation2015). Cryptic species provide challenges for the accurate assessment of biodiversity and, if unrecognised, ‘may lead to erroneous inferences in conservation’ (Leys et al. Citation2016, p. 1). The overarching purpose of this research was therefore to generate information that would aid conservation managers to protect a unique freshwater species and, in doing so, draw attention to freshwater invertebrate conservation in New Zealand.
Methods
Geographic distribution
Historical collection records for Siphlaenigma janae were obtained from national specimen collections, from State of the Environment monitoring data (1995–2011; MFE Citation2015) and from published literature (Penniket Citation1962; Towns Citation1978; Hitchings Citation2001; Hitchings et al. Citation2015). National specimen collections accessed included the New Zealand Arthropod Collection, the Auckland, Canterbury and New Zealand (Te Papa) Museum Collections and the Purdue Entomological Research Collection (Indiana, USA). Material in the Canterbury Museum, which held the largest number of specimens, was inspected to verify identifications.
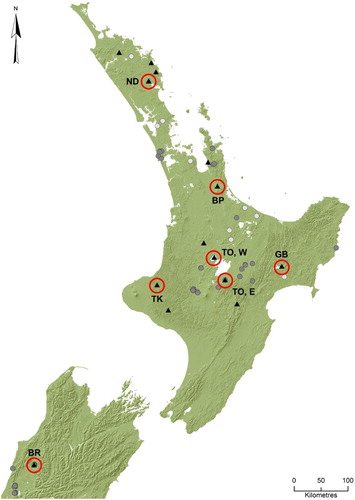
In addition, a series of specimens were obtained in 2013–2016 as part of an extensive nationwide light trapping survey for mayflies and stoneflies (see Winterbourn et al. Citation2017). Also, during December 2016–January 2017 a number of sites were visited where S. janae had been previously found—on the South Island’s West Coast, and in the Northland and Taupo regions of the North Island. The primary purpose of sampling the 2016–2017 sites was to obtain fresh specimens for DNA analysis, and confirm present-day occurrence at these locations. Distribution data based on all confirmed or trusted records were plotted on a map () and a catalogue of collection details was generated (Appendix ).
Figure 1. Distribution records for Siphlaenigma janae. Dark-grey points indicate locations of specimens held in national collections (1960–2003), light-grey points indicate locations of specimens recorded by State of Environment monitoring (2005–2010) and black triangles indicate locations of specimens collected by the authors (2011–2017). Red circles with corresponding codes indicate locations for which DNA analysis was undertaken in this study.
Body size variability
Forewing length of all imaginal and subimaginal specimens present in the Canterbury Museum collection, and specimens taken in the 2013–2016 light trapping survey of the country, was measured to the nearest 0.1 mm with a linear micrometer inserted into a binocular microscope. Body lengths of final instar nymphs in the Canterbury Museum collection, and in collections made in the Pukenui Forest in Northland, were measured in the same way. Because telescoping of abdominal segments can affect the reliability of body length measurements of mayfly nymphs, measurements were adjusted where necessary to enable direct comparisons to be made. Although head width is often used as an indicator of body size, it was not considered to be useful for nymphs of S. janae, which have narrow hypognathous heads. The collection locations of all specimens fell into three geographical groups: northern North Island; central North Island; and northern South Island.
Genetic structure
DNA sequences were obtained for 37 individuals from seven locations (see ) for genetic analysis, using the standard ‘barcoding’ fragment of the mitochondrial cytochrome c oxidase subunit I (COI) gene (Hebert et al. Citation2003). Sampling locations provided broad geographic coverage of the known distribution of S. janae and all available specimens (1–10 individuals per location) were used in the analysis. DNA was extracted from three legs of each specimen with an Extract-N-Amp Tissue PCR Kit (Sigma–Aldrich), the legs being crushed and added to 25 µL Extraction Solution and 7.0 µL Tissue Preparation Solution, incubated in a thermocycler at 37 °C for 30–45 min, then 95 °C for 3 min, and 25 µL Neutralising Solution added. The barcode fragment of the COI gene was amplified using the universal primer pair LCO1490 (5′-GGTCAACAAATCATAAAGATATTGG-3′) and HCO2198 (5′-TAAACTTCAGGGTGACCAAAAAATCA-3′) (Folmer et al. Citation1994). Polymerase chain reaction (PCR) amplifications were performed in a final volume of 15 µL containing 2× Kapa2G Robust HotStart ReadyMix (7.5 µL), 0.35 µM of each primer (1 µL), nanopure H2O (5.5 µL) and 1.0 µL of template DNA (30–86 ng/µL). Thermal cycling parameters included an initial denaturation at 95 °C for 3 min, followed by 35 cycles at 95 °C for 15 s, 50 °C for 20 s, 72 °C for 30 s and a final 5 min extension at 72 °C. PCR products were purified with incubation in 2 µL ExoSAP-IT reagent and sequenced in forward and reverse directions, using the same PCR primers used for amplification, by MacroGen (Seoul, South Korea). In addition, for seven individuals representing the three distinct COI haplotype networks found (see Results), the D2 fragment of the 28S nuclear gene was amplified with the primer pair 28Sa (5′-GACCCGTCTTGAAACACGGA-3′) (Nunn et al. Citation1996) and LSUR (5′-GCTACTACCACCAAGATCTGCA-3′) (Rix et al. Citation2008), using the same PCR, cleaning and sequencing procedures described above. Forward and reverse sequences of both COI and 28S were aligned manually and trimmed to 658 and 833 base pairs (bp), respectively, using BioEdit Sequence Alignment Editor v7.2.5 (Hall Citation1999) and deposited in GenBank (Benson et al. Citation2013) (Accession Numbers: COI MF668529–MF668565; 28S MF668243–MF668249).
Statistical analyses
In the body size study, nymphs from the three geographic groups (see above) were compared using one-way ANOVA, followed by Tukey’s pairwise HSD tests to determine where differences lay. A t-test was used to compare forewing length of male and female S. janae in the full data set. In the genetic structure study, haplotype composition and a statistical parsimony network were identified using TCS v1.21 (Clement et al. Citation2000). Evolutionary relationships were then constructed with a Median-Joining network (Bandelt et al. Citation1999) (Epsilon = 0) in PopART v1.7 (Leigh & Bryant Citation2015). Genetic distance within and among the seven populations was estimated in MEGA 7.0 (Kumar et al. Citation2016) using the uncorrected p-distance method (see Collins et al. Citation2012), and also with the Kimura two-parameter (K2P) model (Kimura Citation1980) to facilitate comparison with previously published studies. Our pairwise distance estimates employed the best-fitting nucleotide substitution model, a general time-reversible model with gamma-distributed among-site rate variation and invariant sites (GTR + G +I; shape parameter 0.4453; bootstrap = 2000) which was calculated in MEGA 7.0 and selected using the corrected Akaike Information Criterion (AICc; Akaike Citation1973). Genetic diversity indices were estimated with Nei’s gene (Hd) and nucleotide diversity (π) (Nei Citation1987) in Arlequin v3.5.1.3 (Excoffier & Lischer Citation2010). An Analysis of Molecular Variance (AMOVA; 1000 permutations) was also run in Arlequin to examine the biogeographical effect on genetic variance using all data grouped as one ‘New Zealand’ dataset, followed by pairwise Φst population differentiation values. While an aim of the study was to assess whether sibling species may exist in the North and South Islands, constructing AMOVA groupings in this manner was not appropriate as only one South Island population was sampled (see Fitzpatrick Citation2009).
Results
Geographic distribution
Siphlaenigma janae has a fragmented distribution and has now been recorded from 42 locations ranging from Omahuta Forest in the north of the North Island to the vicinity of Lake Brunner in the northwest of the South Island (; Appendix ). Collection localities ranged from 10 to 730 m above sea level (m a.s.l.). The earliest records of the species came from a low-gradient, forested tributary of the Arnold River in the Buller district of the South Island (Penniket Citation1962). This small stream (the type locality) no longer exists as the surrounding land has been drained and converted to pasture. There are also a number of other historic records in the vicinity, and west of Lake Brunner, but these localities have now been converted to exotic plantation forest, some of which have been logged and converted to pasture. Whether S. janae still inhabits any of these streams is not known. However, specimens have been collected repeatedly from streams draining the Reefton Saddle, particularly O’Malley Creek. Nymphs have also been reported from coastal streams near Punakaiki and Karamea (Hitchings Citation2001; Hitchings et al. Citation2015) and further inland from Claybank Creek near Murchison (Towns Citation1978). However, the Karamea and Murchison specimens could not be found in their respective museum collections for validation, and no nymphs were found in Claybank Creek despite extensive searching in December 2016. Nevertheless, in December 2016 specimens were collected from O’Malley Creek (Reefton Saddle), which is currently the only South Island location where S. janae is definitely known to occur.
In the North Island S. janae has been recorded from Northland, the Waitakere, Hunua and Coromandel Ranges, and various locations across the central North Island from Rotorua and Waikaremoana in the east to inland Taranaki in the west. Specimens recorded in national State of the Environment monitoring programmes, and specimens collected in mayfly surveys during 2011–2017 (S. Pohe, unpubl. data), have expanded the known distribution of S. janae to parts of Northland, Auckland, Bay of Plenty, Hawkes Bay, Whanganui and the Rotorua-Taupo regions. Specimens reported from Waipoua (Northland) and Whatawhata (Waikato) by Hitchings (Citation2001) and Hitchings et al. (Citation2015), and present in the Canterbury Museum collection, were misidentified. However, S. janae is known to occur in these general localities.
Body size variability
Body length measurements were made on 82 final instar nymphs, 31 from the South Island and 51 from the North Island. They formed three discreet geographical groups; one in the north of the North Island, one in the central North Island and one in the northwest of the South Island (). Although body size of final instar nymphs varied considerably within groups it differed significantly among them and between all pairs of groups (ANOVA, F = 37.68, P < 0.0001; Tukey’s HSD tests, P < 0.01). Mean body length was shortest in the most northern group and longest in the central North Island.
Table 1. Body lengths of final instar nymphs of Siphlaenigma janae collected in three geographical areas of New Zealand.
Twenty-five winged imagos and subimagos were available for measurement. The two northernmost specimens, a male and a female from Pukenui Forest near Whangarei, had forewing lengths of 5.9 mm and were the smallest individuals measured. Forewings of males from the central North Island and South Island ranged in length from 7.0–7.3 mm and 6.5–8.0 mm, respectively, whereas those of females ranged from 7.5–8.2 mm (central North Island) and 7.3–8.5 mm (South Island). Overall, females had significantly longer wings than males (t-test, P < 0.05).
Genetic structure
Sequence data for the standard barcode fragment of the mitochondrial COI gene were obtained from 37 S. janae, collected at seven locations across New Zealand. There was no evidence of saturation in the data, mean nucleotide composition was T = 40.6%, C = 15.4%, A = 27.3% and G = 16.7%, and of the 658-bp positions, 64 were variable and 56 parsimony-informative.
Overall nucleotide diversity (π) was 0.033 and from the 37 sequences generated, 28 haplotypes were identified, 22 of which were unique. For the three locations that had 10 individuals (Northland, Taranaki, Reefton Saddle), haplotype diversity (Hd) within the populations was 0.93, 1.0 and 0.76, respectively. Evolutionary relationships estimated using a Median-Joining model produced a multi-modal ‘long-chain’ haplotype network (). When the sequences were evaluated with TCS software they formed three distinct parsimony networks (= haplogroups) that were separated by at least 11 steps and could not be joined with 95% confidence. Haplogroup A comprised all 10 individuals from Northland, the sole individual from the northeastern North Island (Waitawheta) and two of the 10 individuals from Taranaki. Haplogroup B comprised 14 individuals, all from the central North Island (Taupo, Waikaremoana and Taranaki) and Haplogroup C, all 10 individuals from the northwestern South Island (Reefton Saddle).
Figure 2. Median-Joining network for Siphlaenigma janae based on the barcoding fragment of the COI gene. Coloured points represent different sampling locations and the size of the points is relative to the frequency of the haplotypes. Black points indicate hypothetical haplotypes and hatch marks on the branches indicate the number of mutational steps.
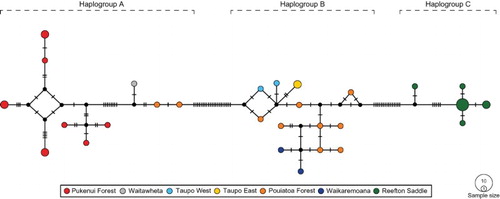
No sharing of haplotypes between the seven locations was found, and while some within-location haplotype sharing was observed in Northland (Pukenui Forest) and in the South Island at Reefton Saddle (O’Malley Creek), the Taranaki (Pouiatoa Forest) haplotypes were all unique. Overall mean p-distance of the 28 haplotypes was 3.1% (3.4% K2P), means between groups ranged from 0.5%–5.4% (0.5%–6.4% K2P) and within-groups was 0.3%–1.7% (0.3%–1.9% K2P) (). Maximum genetic p-distance was 6.1% (7.3% K2P), between individuals from the northernmost and southernmost sampling locations, and maximum within-group distances ranged from 0.3%–4.3% (0.3%–4.8% K2P). AMOVA indicated that overall genetic differentiation in the population was significant (Φst = 0.7529, P < 0.001) with 75.3% of the genetic variation among populations and 24.7% within populations. In addition, significant average pairwise differences were found between most populations, particularly between those with 10 individuals each (Reefton Saddle and Northland, Reefton Saddle and Taranaki, Northland and Taranaki, P < 0.001 for each).
Table 2. Estimated evolutionary divergence of Siphlaenigma janae, based on a 658-bp fragment of the COI barcoding gene, presented as uncorrected p-distance (%). Between-group mean and maximum distances are presented above (grey shade text) and below the diagonal, respectively. Within-group mean distances are presented on the diagonal (bold values). See Supplementary Table S1 for individual haplotype p-distances and standard error estimates. n = number of individuals, Hap = number of haplotypes. Abbreviations in parentheses follow locality codes of Crosby et al. (Citation1998).
Sequences of the 28S nuclear gene were obtained for seven individuals representing the three distinct COI haplotype networks found. All seven sequences were identical (833-bp).
Discussion
Distribution and genetic structure
Siphlaenigma janae, the sole representative of the family Siphlaenigmatidae, is reported from 22 new localities within New Zealand, increasing the total number of records to 42. In particular, recent nationwide light trapping combined with benthic sampling of adjacent streams has extended the known distribution of the species in the northern and central North Island (). However, the species appears to be absent from a number of South Island localities where it was historically recorded, notably at and around the type locality in the Buller district, which is likely a result of land-use changes. Siphlaenigma janae has not been found south of Lake Brunner in the South Island and there is a considerable distributional gap in the North Island, south of Hawkes Bay and Taranaki. The absence of records from the southern North Island is difficult to explain since suitable habitat would appear to be present in the foothills of the Tararua, Ruahine and Rimutaka ranges. The current distribution gap may simply be due to a lack of sampling effort. Further searches for S. janae in these areas, and in the Nelson and Buller regions (South Island), are warranted.
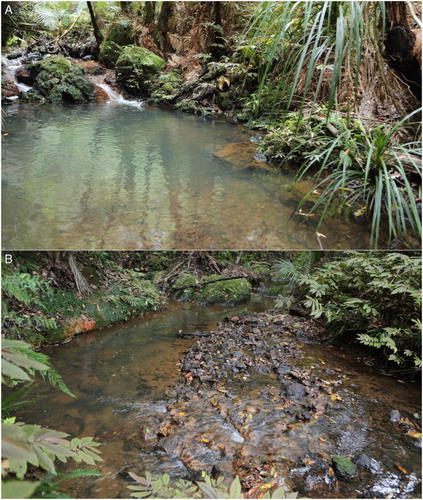
We found the typical habitat of nymphs to be low-gradient slow flowing sections of small streams with pools, in and alongside native forest (). Throughout our surveys nymphs were not found in swift water, and in the Waitakere River Towns (1978) reported that nymphs were often associated with clumps of algae and the overhanging herb Elatostema rugosum. Most streams from which we collected S. janae were densely forested, often with steep banks that created very low light conditions. In a few exceptions, where streams emerged into forest margins (including roadsides), nymphs were collected from vertical streambanks (i.e. clinging to the vertical banks) or from terrestrial vegetation trailing in the water. It may be that S. janae nymphs are to some degree negatively phototactic, and that vertical banks and trailing vegetation reduce light to acceptable levels in relatively open situations.
Figure 3. Typical native forest stream habitat of nymphs of Siphlaenigma janae in the Pukenui Forest, Northland. A, Pool below a small waterfall, with depositional zones and overhanging streamside vegetation; B, low-gradient slow-flowing stream section (a run) below a gravel-bar riffle, with vertical and undercut streambanks.
Nucleotide diversity (π), one measure of genetic variability, was higher in S. janae (0.0334) than reported in several other insect studies including that of the New Zealand giraffe weevil, Lasiorhynchus barbicornis (0.0121; Painting et al. Citation2017), which has a comparable North Island distribution, a Malaysian blackfly Simulium tani (0.0089; Low et al. Citation2014) and the neotropical butterfly Heliconus erato (0.022; Counterman et al. Citation2010). Our body size study of final instar nymphs also indicated considerable variation in regional populations, and no significant latitudinal or altitudinal trends were found. However, because precise body length measurements of preserved mayflies are difficult to obtain due to telescoping, and that material was available from only a small number of populations, regional patterns in nymphal size may have been obscured. Nevertheless, adult body size, measured as forewing length, indicated specimens from the far north of the country were the smallest recorded, a pattern also found in the New Zealand stonefly Stenoperla prasina (Winterbourn et al. Citation2017).
The 37 sequenced individuals of S. janae from the seven localities in the genetic study revealed 28 haplotypes, 22 of which were unique. They formed three haplogroups centred in the northern and central North Island, and in the northwest of the South Island. The North Island haplogroups are essentially congruent with McGlone’s (Citation1985) centres of plant endemism and likely represent areas of survival and/or evolution during the last ice age. A restricted Pleistocene distribution with important northern refugia from which range expansion followed glacial retreat has also been proposed for L. barbicornis (Painting et al. Citation2017). Similarly, Smith et al. (Citation2006) suggested that the levels of sequence divergence found in the mayfly Acanthophlebia cruentata could be interpreted as the result of Pleistocene divergence in multiple refugia leading to the evolution of regionally unique haplotypes. The southern limit of the northern haplogroup of S. janae near the base of the Coromandel Peninsula was coincident with the ‘Kauri Line’ of Wagstaff & Clarkson (Citation2012), which was also the southern limit of genetic clades of cicada species (Ellis et al. Citation2015). Together, these studies provide strong evidence that Northland was a significant faunal refuge in the Pleistocene from which subsequent southern dispersal of insects has occurred.
As in L. barbicornis (Painting et al. Citation2017) a high proportion of unique haplotypes was found in S. janae, a condition which suggests that populations have continued to evolve in relative isolation. Such a scenario is consistent with the findings of McCulloch et al. (Citation2010) where haplotype sharing was more common among populations of macropterous than apterous genera of New Zealand stoneflies (Plecoptera). The multi-modal ‘long-chain’ haplotype network found in S. janae is characteristic of old populations of constant size (Sekiné et al. Citation2017), and in conjunction with its high haplotype diversity and predominance of unique haplotypes, it suggests that populations have evolved in moderate isolation. As dispersal of this small, weak-flying insect is probably limited, genetic variation has likely accrued locally by combinations of drift, selection and mutation (McLean et al. Citation2008). In contrast, the large New Zealand stonefly S. prasina is a strong-flying species that has few unique haplotypes, restricted to the far north of the country (Winterbourn et al. Citation2017).
Does genetic distance among the three haplogroups of S. janae indicate the presence of cryptic species? Comparative data obtained by Ball et al. (Citation2005) indicated that the mean divergence (K2P distances) of COI barcode fragments between more than 200 species pairs of North American Ephemeroptera (11 families) was 18%. Only two interspecific distances (Caenis 3.3%, Baetisca 3.8%) were smaller than the maximum p-distance of 6.1% (7.3% K2P) we obtained for S. janae. In two more recent studies that used uncorrected p-distances of the COI barcode fragment, Williams et al. (Citation2006) found haplogroup diversity of 0.2%–3% within, and 8%–19% among groups of Baetis rhodani in Great Britain, Scandinavia and Western Europe, and Ståhls & Savolainen (Citation2008) found 0.3%–1.4% within and 13.1%–16.5% between haplogroups of B. vernus in northern Europe. These large genetic distances between haplogroups led Williams et al. (Citation2006) and Ståhls & Savolainen (Citation2008) to conclude there was strong evidence for the presence of cryptic species. In contrast, the smaller maximum distances found in S. janae (0.5%–6.1% [0.5%–7.3% K2P]) are less convincing. However, discrimination of species depends on how species are defined. If species are separately evolving metapopulation lineages as proposed by de Queiroz (Citation2007) as the basis of the ‘unified species concept’, then the three haplogroups identified among S. janae support the existence of three separate species. Because our sequences for the D2 region of the 28S nuclear gene were all identical it is tempting to conclude that the three haplogroups represent a single species. However, ribosomal 28S is generally viewed as being too highly conserved to enable resolution at the species level (Sonnenberg et al. Citation2007; Carew & Hoffmann Citation2015; Guerra et al. Citation2016), although some species of caddisflies (Kjer et al. Citation2014), beetles (Monaghan et al. Citation2005) and fish (Sonnenberg et al. Citation2007) have been successfully resolved using the 28S gene. At present, S. janae populations might best be regarded as incipient species given their differentiation is based on limited sequence data, sample sizes are not large and no morphological differences of geographical groups have been assessed.
Conservation
Freshwater invertebrates are under-represented in assessments of conservation status and often neglected in targeted aquatic conservation efforts (Collier et al. Citation2016). There is a clear need for more data on the abundance, distribution and diversity of taxa (Collier et al. Citation2016; Gerbeaux et al. Citation2016) and an improved understanding of ecology and genetic diversity is needed to conserve biodiversity and manage natural systems (Stauffer-Olsen et al. Citation2017). The motivation for the present study was to address some of these needs with respect to the taxonomically unique New Zealand mayfly Siphlaenigma janae. However, only a handful of adult specimens are held in national collections, limiting the advancement of any taxonomic research, and only nine winged adults were taken by light traps in our recent nationwide survey, compared to over 20,000 other mayfly individuals. In addition, it is a difficult insect to study because of its small size, low densities throughout its range, elusive adult life stage and because it has a nymphal habitat (low-gradient sections of forested streams) that is seldom sampled in biological monitoring programmes or more general aquatic ecology studies.
Currently, S. janae has a threat classification of Nationally Vulnerable (Grainger et al. Citation2014), a status which we believe is appropriate given that the nymphal habitat is under pressure from human development, the genetic distinctiveness of regional populations, and the limited area and size of the fragmented populations, particularly those in the South Island. Nevertheless, our recent surveys increased knowledge of its distribution with six new locations in the northern North Island, and five new (and two reconfirmed) locations in the central North Island. Our surveys also revealed that the type locality, ‘Baxter’s Creek’ near Lake Brunner, has been lost due to conversion to pasture. Other South Island streams where it has been found in the past are now also in pasture, or converted to plantation forest, so it is not known whether extant populations have endured.
Within the limits of its known distribution, South Island populations of S. janae appear to be most at risk due to land-use activities that include forestry, farming and, possibly, mining. There is a clear need to ensure that forested reserves encompassing low-gradient streams, particularly where the species is known to occur, have active conservation management. Implementation of assessments to gauge potential threats to stream habitat, and additional surveys to look for other southern populations, would be positive first steps. In particular, sites in and adjoining the Kahurangi National Park, Paparoa National Park, southern Victoria Forest Park (Tawhai Forest) and the Card Creek Ecological Area would be appropriate. Because the South Island population on the Reefton Saddle represents a distinct haplogroup not found elsewhere, the need for it to be protected is all the greater. Similarly, consideration of the conservation value of the distinctive northern haplogroup is warranted, which includes the historically important population in the Waitakere Ranges (Towns Citation1978) that has not been recorded since 1993. In contrast, S. janae appears to have numerous viable populations in conservation-managed native forest streams in the central North Island. However, there is a need for surveys in the Waikato, Wellington, Wairarapa and Marlborough regions where S. janae might be expected to occur, but currently have no records. Furthermore, surveys attempting to confirm presence at sites of historical records in the vicinity of the type locality (near Lake Brunner), and in the Nelson region, would be valuable.
Supplementary Table S1.
Download PDF (455 KB)Acknowledgements
We thank Matthew Shaw and Terry Hitchings (Canterbury Museum), Phil Sirvid (Museum of New Zealand), Cody Fraser (Otago Museum), Darren Ward (NZAC) and John Early (Auckland Museum) for enabling us to examine mayfly collections in their care, or for providing information on the material. We also express our gratitude to Luke Jacobus of Purdue University (Indiana, USA) for his considerable efforts trying to locate material purported to have been kept in his collection. Valuable technical assistance at the University of Canterbury was provided by Linda Morris, Nick Etheridge, Alan Woods, Matt Walters and members of ConSERT. We thank a private landowner, the Pukenui Western Hills Forest Charitable Trust and Nga Ahi Kaa O Pukenui for permission to collect samples in the Pukenui Forest. SRP also acknowledges scholarships received from Ngāi Tahu Research Centre, the Miss E. L. Hellaby Indigenous Grasslands Research Trust and the University of Canterbury. Finally, we thank Raymond Tana, Senior Editor Dr Cor Vink and two anonymous referees for comments that improved the manuscript.
Disclosure statement
No potential conflict of interest was reported by the authors.
ORCID
Stephen R. Pohe http://orcid.org/0000-0002-7357-5185
Michael J. Winterbourn http://orcid.org/0000-0002-3544-2613
Sharyn J. Goldstien http://orcid.org/0000-0002-0619-4016
Jon S. Harding http://orcid.org/0000-0002-1070-1594
Additional information
Funding
Related Research Data
References
- Akaike H. 1973. Information theory as an extension of the maximum likelihood principle. In: Petrov BN, Csaki F, editors. 2nd International Symposium on Information Theory. Budapest: Akademiai Kiado; p. 267–281.
- Ball SL, Hebert PDN, Burian SK, Webb JM. 2005. Biological identifications of mayflies (Ephemeroptera) using DNA barcodes. Journal of the North American Benthological Society. 24:508–524. doi: 10.1899/04-142.1
- Bandelt H-J, Forster P, Röhl A. 1999. Median-joining networks for inferring intraspecific phylogenies. Molecular Biology and Evolution. 16:37–48. doi: 10.1093/oxfordjournals.molbev.a026036
- Benson DA, Cavanaugh M, Clark K, Karsch-Mizrachi I, Lipman DJ, Ostell J, Sayers EW. 2013. Genbank. Nucleic Acids Research. 41:D36–D42. doi: 10.1093/nar/gks1195
- Carew ME, Hoffmann AA. 2015. Delineating closely related species with DNA barcodes for routine biological monitoring. Freshwater Biology. 60:1545–1560. doi: 10.1111/fwb.12587
- Clement M, Posada D, Crandall KA. 2000. TCS: a computer program to estimate gene genealogies. Molecular Ecology. 9:1657–1659. doi: 10.1046/j.1365-294x.2000.01020.x
- Collier KJ, Probert PK, Jeffries M. 2016. Conservation of aquatic invertebrates: concerns, challenges and conundrums. Aquatic Conservation: Marine and Freshwater Ecosystems. 26:817–837. doi: 10.1002/aqc.2710
- Collins RA, Boykin LM, Cruickshank RH, Armstrong KF. 2012. Barcoding’s next top model: an evaluation of nucleotide substitution models for specimen identification. Methods in Ecology and Evolution. 3:457–465. doi: 10.1111/j.2041-210X.2011.00176.x
- Counterman BA, Araujo-Perez F, Hines HM, Baxter SW, Morrison CM, Lindstrom DP, Papa R, Ferguson L, Joron M, ffrench-Constant RH, et al. 2010. Genomic hotspots for adaptation: the population genetics of Müllerian mimicry in Heliconius erato. PLoS Genetics. 6:e1000796. doi: 10.1371/journal.pgen.1000796
- Crosby TK, Dugdale JS, Watt JC. 1998. Area codes for recording specimen localities in the New Zealand subregion. New Zealand Journal of Zoology. 25:175–183. doi: 10.1080/03014223.1998.9518148
- de Queiroz K. 2007. Species concepts and species delimitation. Systematic Biology. 56:879–886. doi: 10.1080/10635150701701083
- Ellis EA, Marshall DC, Hill KBR, Owen CL, Kamp PJJ, Simon C. 2015. Phylogeography of six codistributed New Zealand cicadas and their relationship to multiple biogeographical boundaries suggest a re-evaluation of the Taupo Line. Journal of Biogeography. 42:1761–1775. doi: 10.1111/jbi.12532
- Excoffier L, Lischer HEL. 2010. Arlequin suite ver 3.5: a new series of programs to perform population genetics analyses under Linux and Windows. Molecular Ecology Resources. 10:564–567. doi: 10.1111/j.1755-0998.2010.02847.x
- Fitzpatrick BM. 2009. Power and sample size for nested analysis of molecular variance. Molecular Ecology. 18:3961–3966. doi: 10.1111/j.1365-294X.2009.04314.x
- Folmer O, Black M, Hoeh W, Lutz R, Vrijenhoek R. 1994. DNA primers for amplification of mitochondrial cytochrome c oxidase subunit I from diverse metazoan invertebrates. Molecular Marine Biology and Biotechnology. 3:294–299.
- Gerbeaux P, Champion P, Dunn N. 2016. Conservation of fresh waters. In: Jellyman PG, Davie TJA, Pearson CP, Harding JS, editors. Advances in New Zealand freshwater science. Wellington: New Zealand Hydrological Society and New Zealand Limnological Society; p. 573–593.
- Grainger N, Collier K, Hitchmough R, Harding J, Smith B, Sutherland D. 2014. Conservation status of New Zealand freshwater invertebrates, 2013, New Zealand Threat Classification Series 8. Department of Conservation, Wellington, New Zealand. 28 p.
- Guerra AL, Alevi KCC, Banho CA, de Oliveira J, da Rosa JA, de Azeredo-Oliveira MTV. 2016. D2 region of the 28S RNA gene: a too-conserved fragment for inferences on phylogeny of South American triatomines. American Journal of Tropical Medicine and Hygiene. 95:610–613. doi: 10.4269/ajtmh.15-0747
- Hall TA. 1999. Bioedit: a user-friendly biological sequence alignment editor and analysis program for Windows 95/98/NT. Nucleic Acids Symposium Series. 41:95–98.
- Hebert PDN, Cywinska A, Ball SL, deWaard JR. 2003. Biological identifications through DNA barcodes. Proceedings of the Royal Society of London. Proceedings of the Royal Society B: Biological Sciences. 270:313–321. doi: 10.1098/rspb.2002.2218
- Hitchings TR. 2001. The Canterbury Museum mayfly collection and database (Insecta: Ephemeroptera). Records of the Canterbury Museum. 15:11–32.
- Hitchings TR, Hitchings TR, Shaw MD. 2015. A revision of the distribution maps and database of New Zealand mayflies (Ephemeroptera) at Canterbury Museum. Records of the Canterbury Museum. 29:5–34.
- Kimura M. 1980. A simple method for estimating evolutionary rates of base substitutions through comparative studies of nucleotide sequences. Journal of Molecular Evolution. 16:111–120. doi: 10.1007/BF01731581
- Kjer KM, Zhou X, Frandsen PB, Thomas JA, Blahnik RJ. 2014. Moving toward species-level phylogeny using ribosomal DNA and COI barcodes: an example from the diverse caddisfly genus Chimarra (Trichoptera: Philopotamidae). Arthropod Systematics and Phylogeny. 72:345–354.
- Koss RW, Edmunds GF. 1974. Ephemeroptera eggs and their contribution to phylogenetic studies of the order. Zoological Journal of the Linnean Society. 55:267–349. doi: 10.1111/j.1096-3642.1974.tb01648.x
- Kumar S, Stecher G, Tamura K. 2016. MEGA7: molecular evolutionary genetics analysis version 7.0 for bigger datasets. Molecular Biology and Evolution. 33:1870–1874. doi: 10.1093/molbev/msw054
- Landa V, Soldán T. 1985. Phylogeny and higher classification of the order Ephemeroptera: a discussion from the comparative anatomical point of view, Studie Československá Akademie Věd No. 4, Prague, Czech Republic. 121 p.
- Leigh JW, Bryant D. 2015. POPART: full-feature software for haplotype network construction. Methods in Ecology and Evolution. 6:1110–1116. doi: 10.1111/2041-210X.12410
- Leys M, Keller I, Räsänen K, Gattolliat J-L, Robinson CT. 2016. Distribution and population genetic variation of cryptic species of the Alpine mayfly Baetis alpinus (Ephemeroptera: Baetidae) in the Central Alps. BMC Evolutionary Biology. 16:77. doi: 10.1186/s12862-016-0643-y
- Low VL, Adler PH, Takaoka H, Ya’cob Z, Lim PE, Tan TK, Lim YAL, Chen CD, Norma-Rashid Y, Sofian-Azirun M. 2014. Mitochondrial DNA markers reveal high genetic diversity but low genetic differentiation in the black fly Simulium tani Takaoka & Davies along an elevational gradient in Malaysia. PLoS ONE. 9:e100512. doi: 10.1371/journal.pone.0100512
- Lugo-Ortiz CR, McCafferty WP. 1998. First report of the genus Siphlaenigma Penniket and the family Siphlaenigmatidae (Ephemeroptera) from Australia. Proceedings of the Entomological Society of Washington. 100:209–213.
- McCafferty WP. 1991. Toward a phylogenetic classification of the Ephemeroptera (Insecta): a commentary on systematics. Annals of the Entomological Society of America. 84:343–360. doi: 10.1093/aesa/84.4.343
- McCafferty WP. 1999. Distribution of Siphlaenigmatidae (Ephemeroptera). Entomological News. 110:191.
- McCafferty WP, Edmunds GF. 1979. The higher classification of the Ephemeroptera and its evolutionary basis. Annals of the Entomological Society of America. 72:5–12. doi: 10.1093/aesa/72.1.5
- McCulloch GA, Wallis GP, Waters JM. 2010. Onset of glaciation drove simultaneous vicariant isolation of alpine insects in New Zealand. Evolution. 64:2033–2043.
- McGlone MS. 1985. Plant biogeography and the late Cenozoic history of New Zealand. New Zealand Journal of Botany. 23:723–749. doi: 10.1080/0028825X.1985.10434240
- McLean AJ, Schmidt DJ, Hughes JM. 2008. Do lowland habitats represent barriers to dispersal for a rainforest mayfly, Bungona narilla, in south-east Queensland? Marine and Freshwater Research. 59:761–771. doi: 10.1071/MF07202
- MFE. 2015. Ministry for the Environment national indicator data for river condition in New Zealand. Collected by Regional Councils and the National Institute of Water and Atmospheric Research (NIWA), collated and processed by NIWA and protected by copyright owned by the Ministry for the Environment on behalf of the Crown. Accessed 9th July 2015.
- Monaghan MT, Balke M, Gregory TR, Vogler AP. 2005. DNA-based species delineation in tropical beetles using mitochondrial and nuclear markers. Philosophical Transactions of the Royal Society B: Biological Sciences. 360:1925–1933. doi: 10.1098/rstb.2005.1724
- Nei M. 1987. Molecular evolutionary genetics. New York (NY): Columbia University Press. p. 512.
- Nunn GB, Theisen BF, Christensen B, Arctander P. 1996. Simplicity-correlated size growth of the nuclear 28S ribosomal RNA D3 expansion segment in the crustacean order Isopoda. Journal of Molecular Evolution. 42:211–223. doi: 10.1007/BF02198847
- Ogden TH, Gattolliat JL, Sartori M, Staniczek AH, Soldán T, Whiting MF. 2009. Towards a new paradigm in mayfly phylogeny (Ephemeroptera): combined analysis of morphological and molecular data. Systematic Entomology. 34:616–634. doi: 10.1111/j.1365-3113.2009.00488.x
- Painting CJ, Myers S, Holwell GI, Buckley TR. 2017. Phylogeography of the New Zealand giraffe weevil Lasiorhynchus barbicornis (Coleoptera: Brentidae): a comparison of biogeographic boundaries. Biological Journal of the Linnean Society. 122:13–28. doi: 10.1093/biolinnean/blx051
- Penniket JG. 1962. Notes on New Zealand Ephemeroptera. III. A new family, genus and species. Records of the Canterbury Museum. 7:389–398.
- Riek, EF. 1973. The classification of the Ephemeroptera. In: Peters WL, Peters JG, editors. Proceedings of the First International Conference on Ephemeroptera, 17–20 August 1970. Tallahassee, Florida, United States of America. Leiden, Netherlands: E. J. Brill. p. 160–178.
- Rix MG, Harvey MS, Roberts JD. 2008. Molecular phylogenetics of the spider family Micropholcommatidae (Arachnida: Araneae) using nuclear rRNA genes (18S and 28S). Molecular Phylogenetics and Evolution. 46:1031–1048. doi: 10.1016/j.ympev.2007.11.001
- Sekiné K, Bayartogtokh B, Bae YJ. 2017. Post-glacial distribution of a Mongolian mayfly inferred from population genetic analysis. Freshwater Biology. 62:102–110. doi: 10.1111/fwb.12853
- Smith PJ, McVeagh SM, Collier KJ. 2006. Genetic diversity and historical population structure in the New Zealand mayfly Acanthophlebia cruentata. Freshwater Biology. 51:12–24. doi: 10.1111/j.1365-2427.2005.01462.x
- Sonnenberg R, Nolte AW, Tautz D. 2007. An evaluation of LSU rDNA D1-D2 sequences for their use in species identification. Frontiers in Zoology. 4:6. doi: 10.1186/1742-9994-4-6
- Ståhls G, Savolainen E. 2008. MtDNA COI barcodes reveal cryptic diversity in the Baetis vernus group (Ephemeroptera, Baetidae). Molecular Phylogenetics and Evolution. 46:82–87. doi: 10.1016/j.ympev.2007.09.009
- Staniczek, AH. 1997. The morphology of Siphlaenigma janae Penniket (Ephemeroptera, Siphlaenigmatidae), and its significance for the ground plan of the Baetoidea. In: Landolt P, Sartori M, editors. Ephemeroptera & Plecoptera: biology, ecology, systematics. Proceedings of the 8th International Conference on Ephemeroptera and the 12th International Conference on Plecoptera, Lausanne, Switzerland, 14–20 August 1995. Fribourg, Switzerland: Mauron + Tinguely & Lachat SA. p. 536–549.
- Stauffer-Olsen NJ, O’Grady PM, Resh VH. 2017. Temporal patterns of genetic diversity in Baetis tricaudatus (Ephemeroptera: Baetidae) from the Russian River, northern California. Freshwater Science. 36:351–363. doi: 10.1086/691973
- Towns DR. 1978. First records of Siphlaenigma janae (Ephemeroptera: Siphlaenigmatidae) from the North Island of New Zealand. New Zealand Journal of Zoology. 5:365–370. doi: 10.1080/03014223.1978.10428322
- Wagstaff SJ, Clarkson BR. 2012. Systematics and ecology of the Australasian genus Empodisma (Restionaceae) and description of a new species from peatlands in northern New Zealand. PhytoKeys. 13:39–79. doi: 10.3897/phytokeys.13.3259
- Williams HC, Ormerod SJ, Bruford MW. 2006. Molecular systematics and phylogeography of the cryptic species complex Baetis rhodani (Ephemeroptera, Baetidae). Molecular Phylogenetics and Evolution. 40:370–382. doi: 10.1016/j.ympev.2006.03.004
- Winterbourn MJ, Pohe SR, Goldstien SJ. 2017. Genetic and phenotypic variability in Stenoperla prasina (Newman, 1845) (Plecoptera: Eustheniidae) in relation to latitude and altitude in New Zealand. Aquatic Insects. 38:49–65. doi: 10.1080/01650424.2017.1302091