
Abstract
Background: South Asians are prone to cardiometabolic disease at lower BMI levels than most other ethnic groups, starting in childhood. The magnitude of BMI misclassifications is unknown.
Aim: To compare the BMI distribution of contemporary South Asian 0–20 year olds in the Netherlands with: (1) The South Asian norm reference (secular trends); and (2) The WHO child growth standard and reference.
Subjects and methods: The BMI-for-age distribution of 6677 routine measurements of 3322 South Asian children, aged 0–20 years, was described with the LMS method and BMI z-scores.
Results: The BMI distribution in South Asian 0–4 year olds was almost similar to the norm reference (mean BMI z-score = 0.11, skewness = 0.31, SD = 1.0), whereas in 5–19 year olds the distribution had shifted upwards (mean = 0.53) and widened (skewness = −0.12, SD = 1.08). Overweight (incl. obesity) and obesity peaked at 8–10 years, at 45–48% and 35–37%, respectively. Relative to the WHO references, the BMI distribution was left-shifted at ages 0–4 years (mean BMI z-score = −0.46, skewness = 0.23, SD = 0.98) and widened at ages 5–20 years (mean = 0.05; skewness = −0.02, SD = 1.40). At most ages, thinness rates were significantly higher and obesity rates lower than based on South Asian norms.
Conclusions: A secular change of BMI-for-age in South Asian children mostly affected children >4 years. WHO references likely under-estimate overweight and obesity rates in South Asian children.
Introduction
The greatest numbers of people with type 2 diabetes are currently situated in Asia, in particular in China and India, and the numbers in those countries are still rising. In India, the number of adults with diabetes has more than doubled since 2000, with 69.2 million diabetics in 2015 (Pradeepa & Mohan, Citation2017). A major challenge for healthcare workers is to detect the high-risk individuals at an early stage, in order to take the proper (preventive) action. To pick out those at risk, a Body Mass Index (BMI) cut-off of 30 kg/m2 for obesity in adults is internationally used as a cue to action (Vazquez et al., Citation2007; WHO, Citation1995).
People of Asian descent generally have increased cardiometabolic risks at lower BMI levels than other ethnic groups (Deurenberg-Yap et al., Citation2001; WHO, Citation2004) because of a smaller muscle mass, together with a larger (abdominal) fat mass at the same BMI (Deurenberg et al., Citation2002; Lear et al., Citation2009). For that reason, for Asian populations the World Health Organisation (WHO) recommended lowering the adult BMI cut-offs for overweight from 25 to 23 kg/m2 and for obesity from 30 to 27.5 kg/m2 (WHO, Citation2004). Nonetheless, since the publication of this recommendation, several studies have shown that the proposed ‘Asian’ BMI cut-offs are still too high for people from South Asia (Chiu et al., Citation2011; Ntuk et al., Citation2014). In India, in anticipation of the associated health risks, an even lower BMI cut-off of 25 kg/m2 to classify obesity was recommended, as this value better reflects the actual risk of morbidity (Misra et al., Citation2009).
South Asian children and adolescents have also been shown to have higher cardiometabolic risks than children of European descent (Jafar et al., Citation2006; Whincup et al., Citation2010; Wickramasinghe et al., Citation2011), but, for South Asian children and adolescents, internationally, universal BMI cut-offs such as the WHO Child Growth standard (ages 0–4) (WHO, Citation2006) and the later added reference (5–19 years) (de Onis et al., Citation2007) are still in use. Based on the WHO cut-offs (<−2 SD), a recent study showed high thinness rates and low overweight and obesity rates, likely because of a left-shift of the BMI relative to the WHO population of the child growth study (de Wilde et al., Citation2013b).
The application of such universal BMI references and corresponding BMI cut-offs to children of South Asian descent is very likely to over-estimate thinness rates and under-estimate overweight rates (de Wilde et al., Citation2013b). For a proper assessment of the nutritional status and associated diseases in the Netherlands, a recently developed South Asian specific BMI-for-age reference, which also includes cut-offs for thinness, overweight and obesity, is currently used by preventive youth healthcare workers and paediatricians (de Wilde et al., Citation2013a).
This reference was based on historic BMI data of a cohort of children of South Asian descent, born 1974–1976, before the obesity epidemic started in the Netherlands. It is considered a norm for this ethnic group, as it entails an affluent population in which underweight and overweight prevalence were expected to be low. BMI cut-offs were based on the recommendation to apply a BMI of 23 kg/m2 and 25 kg/m2 for the classification of adult overweight and obesity, respectively (Misra, Citation2015). It is currently unknown if and how a secular shift in BMI in this population of South Asian descent in the Netherlands has occurred, since obesity became a major public health threat. This information may help in setting specific targets and goals for prevention, for example in specific sub-groups. It is also unknown how the BMI distribution in contemporary 0–20 year old children of South Asian descent in the Netherlands compares to the BMI distribution of the WHO Child Growth Study (de Onis et al., Citation2007, WHO, Citation2006). This knowledge may be important to estimate the magnitude and size of misclassification by universal BMI child growth references, likely leading to an under-estimation of the cardiometabolic risks associated with obesity (Whincup et al., Citation2002).
This study aims to (1) investigate secular trends in the BMI-for-age distribution of a contemporary population of South Asian children and adolescents aged 0–20 years and (2) compare the actual BMI-for-age distribution with the universal WHO BMI standard and the complementary reference, to estimate the degree of misclassification.
Subjects and methods
Sample and data collection
In the city of The Hague and its surroundings resides the largest population of South Asians in the Netherlands (estimated at 50 000), most of whom are descendants of Asian Indians who migrated to the former Dutch colony Suriname in the 19th century and migrated to the Netherlands around Suriname’s independence in 1975 (Meel, Citation1985).
For this study, routine height and weight measurements of South-Asian children were taken between 2007 and 2010 by Youth Health Care professionals in the city of The Hague during preventive health check-ups at fixed ages. From 0–4 years of age 11–12 standard health examinations were conducted and between 5–18 years of age another three were conducted, at the ages of 5–6, 9–10 and 13–15 years. To include the ages that were not routinely measured, additional measurements were performed between 2008 and 2010 in South Asian children from two Hindu schools and from primary and secondary schools that were known to have a considerable proportion of South Asian children in 2009–2010. Additional data such as sex, age, family name, parental education, (grand)parental country of birth, medicine use and presence of diagnosed growth disorders were either acquired from the (digital) record system or from questionnaires (in additionally measured children).
For all children under 2 years of age a measuring board was used for measuring length (to the nearest 0.1 cm) and a paediatric balance beam scale for weight measurement (0.1 kg). Older children were measured with a stadiometer or height measuring tape (0.1 cm). Children up to 6 years of age were weighed in underclothes and with bare feet. From the age of 6 years, children were weighed in light clothes without shoes. Further on in this article, this part of the study will be referred to as the ‘South Asian 2010 study’.
Ethical approval
The Leiden University Medical Centre (LUMC) Medical Ethical Review Board approved the study as part of the 5th national growth study of the Netherlands. For the additionally collected data, written consent was obtained from the parents of children <16 years and oral consent from children aged >12 years. Personal data such as names and dates of birth were removed from the database before analysis.
BMI distributions (references) and cut-offs
Internationally, universal BMI references are recommended to be used in general practice for all children, irrespective of ethnicity. The WHO Child Growth Standard was developed for this use (WHO, Citation2006). As a standard that was based on growth data of children of all continents, it describes how children 0-4 years of age in general ‘should grow’. The complementary Child Growth reference for children 5–19 years was based on growth of American children in the late 1970s (de Onis et al., Citation2007). In this article, the standard and reference will be referred to as ‘WHO reference’. For the classification of BMI into thinness, overweight and obesity groups, the WHO reference uses values of <−2 SD, >+1 SD but ≤+2 SD, and >+2 SD, respectively. The SD-lines (centiles) in the BMI-for-age charts approximate the internationally used adult BMI cut-offs at 18 years of <17 kg/m2, ≥ 25 kg/m2, and ≥30 kg/m2, respectively.
As the aim of this study was to compare the 2010 study with different BMI references, the distribution of BMI in the 2010 population was described by constructing sex-specific BMI-for-age charts.
A recently developed South Asian specific BMI-for-age reference including BMI cut-offs was based on historic data (birth cohort 1974–1976) and is considered normative for this population (de Wilde et al., Citation2013a). It has been recently implemented in (preventive) youth healthcare and paediatric practices in the Netherlands. Contrary to the WHO standard and the reference, the BMI cut-offs for overweight and obesity of this norm are based on actual demonstrated health risks and correspond to an adult BMI cut-off equivalent at age 18 years of ≥23 kg/m2 but <25 kg/m2 for overweight and ≥25 kg/m2 for obesity, values that were previously proposed for use in the adult Asian Indian population (Misra, Citation2015). Applying the more arbitrarily chosen WHO cut-offs of +1 SD and +2 SD would have led to centiles crossing at considerably higher BMI values at 18 years of age. To estimate thinness rates, as no information on health risks was available, a more pragmatic cut-off of <15 kg/m2 was chosen, corresponding to the WHO criterion for thinness of <–2 SD. In girls, the centile crossing a BMI of 15 kg/m2 at 18 years corresponded to the 2.7th percentile, approximating the –2 SD (Percentile 2.3). However, in boys, a value of 15 kg/m2 corresponded to the 7th centile.
This normative South Asian BMI-for-age reference will be further referred to as the ‘South Asian 1976 reference’.
Inclusion criteria
Only children of whom both parents were of South Asian descent were included in the study, which was determined by country of birth of both parents or the grandparents (the latter only available from questionnaires of additionally measured children). In the case of South Asians originating from Suriname, ethnicity was determined by country of birth (Suriname or the Netherlands) and a typical Surinamese South Asian family name of both parents. In cases with missing parental data the family name of the child was used to identify children of South Asian descent.
Similarly to the South Asian 1976 study and the WHO study (de Wilde et al., Citation2013a; WHO, Citation2006), children taking medication or diagnosed with disorders that could have affected growth, for example thyroid disorder, diabetes or coeliac disease, were excluded. Also, measurements of children under 2 years of age that were born prematurely (for South Asian children defined according to ethnic specific criteria as a gestational age <36 weeks (Patel et al., Citation2004)) were excluded. On the other hand, measurements of children born at term but with a low birth weight (<2500 g) were included as these children ‘likely represent small but normal children’ (WHO, Citation2006). Their exclusion would have biased the lower centiles of the distribution.
Statistical analyses
To construct BMI-for-age curves by sex, the LMS method was applied to the data of the 2010 study using the R integrated statistical software suite (v 2.54) with the GAMLSS package (Stasinapoulos & Robert, Citation2007). This method transforms the BMI data into a normal distribution at each age, while creating L-, M- and S-curves by age, which designate the skewness, the mean and the coefficient of variation, respectively (Cole, Citation1990). The combination of these LMS parameters accurately describes the characteristics of the distribution. Age was log-transformed to establish a good fit of the curves at ages of increased growth velocity. The optimal fit (the amount of smoothing that is applied) of the LMS curves was established by assessing ‘worm plots’ with the AGD package within the R suite (van Buuren & Fredriks, Citation2001).
To be able to compare the BMI distribution of the 2010 study with other distributions, z-scores were calculated for all individual BMI values with the two normative BMI references, the South-Asian specific (de Wilde et al., Citation2013a) and the universal WHO reference (de Onis et al., Citation2007; WHO, Citation2006).
To determine if the mean z-scores significantly differed from the means of the normal distributions of the references, 95% confidence intervals were calculated. To analyse differences in centiles between the 2010 study and the two references, prevalence rates of thinness, overweight (including obesity) and obesity with 95% confidence intervals (CI), including continuity correction (Wilson, Citation1927), were calculated based on the cut-offs (specific centiles) of these two references and compared with the proportion that would be expected at that specific centile. Although in children <2 years of age the use of BMI classes is deemed inappropriate to assess the nutritional status, for purposes of comparison, these values were also calculated.
IBM SPSS statistics v 22 and Microsoft Excel 2010 (v14) were used for the analyses, in which a p-value (two-sided) of <0.05 was considered statistically significant.
Results
In this study, 6677 measurements were included from 3322 children, of which 50.0% were boys. Of the measurements, 64.0% were taken at ages 0–4 years. The distribution was described with the LMS values by sex and age (Supplement I). All L-values as from the age of 4 months in girls and from 6 months of age in boys were lower than 1, indicating skewness to the right. The coefficient of variation S increased with age, indicating that the dispersion of BMI values increased.
The South Asian 2010 BMI-for-age vs the South Asian 1976 reference
From 0–4 years of age the BMI distribution of the 2010 study coincided for the most part with the distribution of the historical South Asian reference, both in boys and girls (). The main difference was that the +2 SD line in the 2010 charts deviated upward from the age of 1.5–2 years. Although the BMI distribution at ages 0–4 years of the 2010 study significantly differed from the 1976 study, the differences were quite small (). It was characterised by a mean BMI z-score of 0.11 (95% CI = 0.08–0.14), near normality (skewness of 0.31), and an SD of 1.0. From the age of 4 years, the BMI deviated more from the norm population of the 1976 study, with all SD-lines moving upward (), with a mean of 0.53 (95% CI = 0.49–0.58) and a skewness of –0.12 (). The larger SD of 1.08 indicates that, from 5 years of age, the distribution had widened compared with the 1976 norm population.
Figure 1. BMI-for age charts: combined South Asian (SA) 1976 reference (de Wilde et al., Citation2013a), South Asian 2010 study and WHO reference (de Onis et al., Citation2007; WHO, Citation2006) with −2, 0 and +2 SD lines, boys (A) and girls (B) separately.
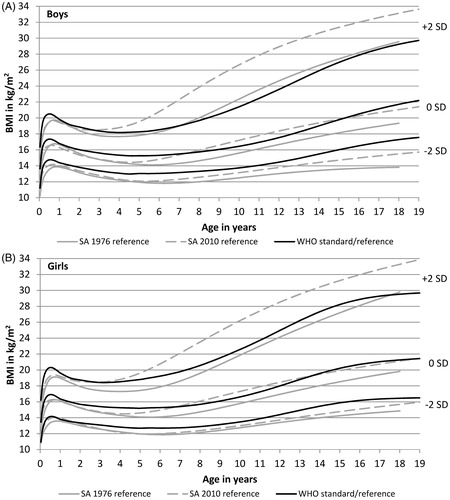
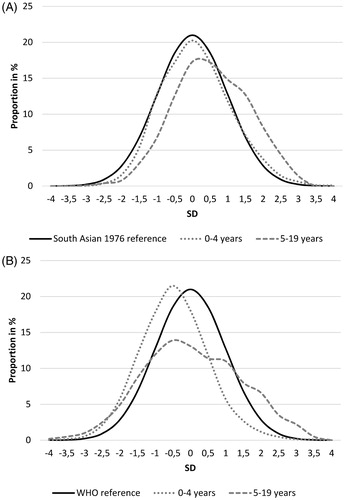
Figure 2. BMI Z-score distribution of age groups 0–4 and 5–19 years of the 2010 study, relative to South Asian 1976 reference (A) and WHO reference (B).
The prevalence of thinness, overweight and obesity is determined by specific SD-lines (or centiles) of the norm distribution of 1976 () and shows in more detail how contemporary children and adolescents differ from or agree with the 1976 norm population. At most ages, thinness rates in the 2010 study were significantly lower, whereas overweight (incl. obesity) and obesity rates were higher than the expected rates based on the cut-offs (centiles) of the 1976 distribution (). The general exceptions were 2–4 year old boys and girls for whom none of the prevalence rates differed from those in 2–4 year olds of the 1976 study. For 0–1 year olds in 2010, the ‘overweight (incl. obesity)’ criteria resulted in a prevalence of 22.9% (95% CI = 21.0–25.0) for girls and 21.6% (95% CI = 19.8–23.6) for boys, both only slightly higher than the expected 18.9% and 21.1% for boys and girls, respectively, of the 1976 study. In the 5 + age group, the overweight (including obesity) and obesity prevalence peaked at ages 8–10 years at an alarmingly high rate of 47–48% and 35–37%, respectively.
Figure 3. Prevalence of thinness, normal weight, overweight and obesity in South Asian children of the 2010 study by age category, boys (A) and girls (B), based on the South Asian BMI norm reference (1976) and the WHO reference.
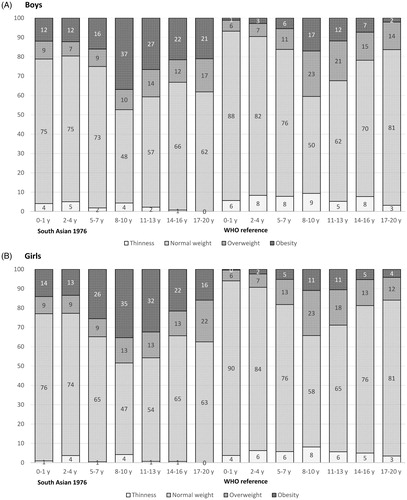
Table 1. Characteristics by sex of South Asian 1976 and WHO cut-offs for thinness, overweight and obesity and rates based on these references for 0–4 and 5–20 years groups of the 2010 study population.
The South Asian 2010 BMI-for-age vs the WHO reference
The BMI distributions in the South Asian children of the 2010 study differed visually from the WHO populations, in both boys and girls similarly (). The −2 SD line remained throughout the whole age range below the WHO −2 SD, whereas the 0 and +2 SD lines were below the WHO equivalent only under 4 years of age, after which age the +2 SD line diverged considerably upward.
As with the South Asian 1976 distribution, 0–4 year olds differed from children aged 5–20 years. The distribution of BMI z-scores in 0–4 year olds was shifted to the left (; mean BMI-z = −0.46, 95% CI = −0.49 to −0.43), but had a similar distributional pattern (skewness = 0.23, SD = 0.98). In 5–19 year olds of the 2010 study, the mean z-score (0.05, 95% CI = 0.0–0.11) and skewness (−0.015, 95% CI = −0.11–0.08) did not significantly differ from the WHO reference, but the distribution was considerably wider (SD = 1.40). The dispersion of values both left and right of the WHO distribution indicates larger differences within this population than in the WHO population.
Thinness rates were generally much higher than the expected 2.3%, even up to 9.3% (95% CI = 6.6–13.0%) in 8–10 year old boys of the South Asian 2010 population (). Expectedly, in the 0–4 years age group the left-shifted distribution of BMI z-scores () led to a low overweight (including obesity) prevalence (), while from 5 years of age the rates increased, to plateau at 8–10 years, and from then gradually decline up to 20 years. At 17–20 years, thinness, overweight (including obesity) and obesity rates did not significantly differ from the expected rates (2.3, 15.9 and 2.3%, respectively).
Overweight (including obesity) prevalence, based on the South Asian specific cut-offs of the 1976 study, was up to 21% points higher than the rates based on WHO cut-offs in girls of 17–20 years. Obesity rates were up to even 24% points higher in girls of 8–10 years ().
Discussion
Assessment of the secular changes in the BMI-for-age distribution in contemporary South Asian children and adolescents of 0–20 years found a distinction between children of 0–4 and 5–20 years of age. The BMI distribution in younger children was largely similar to that of the 1976 study. Nonetheless, children from the age of 5 showed a clear upward trend in the centiles, likely because of the influence of the obesogenic environment, which resulted in an extremely high prevalence of obesity of 37% in 8–10 year olds (South Asian specific criteria). Furthermore, application of the WHO standard and reference resulted in considerable differences with the South Asian 2010 BMI-for-age distribution and the corresponding prevalence rates of thinness, overweight and obesity. The distinction between younger and older children was also apparent here. The below 5 group had very low BMI values compared to the WHO population and also very low overweight and obesity rates, together with relatively high thinness rates. In the 5 + age group overweight was highly prevalent, but simultaneously a higher than expected prevalence of thinness was found, up to 9% in 8–10 year olds. Also the prevalence of overweight and obesity generally peaked at 8–10 years, after which the rates mostly declined.
A previous study in Turkish and Moroccan children, the largest minority groups in the Netherlands, also found overweight and obesity rates to reach a plateau between 8 and 10 years, for children of Turkish descent this was at a similar level (>45%) to that of the South Asian children of the current study (van Dommelen et al., Citation2015). However, when South Asian children were assessed with universal BMI cut-offs, such as the WHO criteria, the prevalence of overweight (including obesity) was considerably lower, but still similar at 26.2%, to that in Moroccan children of 2–18 years (26.6%).
However, the application of universal BMI criteria is inappropriate for children and adolescents of South Asian descent. Universal BMI cut-offs, as a surrogate measure of body fat, do not accurately represent the actual body fat mass (Nightingale et al., Citation2011; Shaw et al., Citation2007). A set of lowered BMI cut-offs would be better in accomplishing that (de Wilde et al., Citation2013a; Khadilkar et al., Citation2012). In addition, ethnic specific criteria will allow the early detection of cardiometabolic disease risk (Khadilkar et al., Citation2012; Wickramasinghe et al., Citation2011), which is highly desirable in the context of the current epidemic of cardiovascular diseases and Type 2 diabetes in India (Pradeepa & Mohan, Citation2017). Although in some studies of South Asian children ethnic specific cut-offs are used, in most studies universal BMI cut-offs are the norm. A study in India of children and adolescents aged 5–17 years also operationalised a BMI-equivalent of ≥23 kg/m2 at 18 years as the cut-off for overweight (including obesity) and found rates of 36% in boys and 37% in girls (Khadilkar et al., Citation2012), which are quite similar to the prevalence rates found in the current study. Such rates would be a call for action, but in many studies the urgency is not recognised, as prevalence rates based on universal criteria in South Asian children are quite low, sometimes even lower than in their counterparts of European descent (Balakrishnan et al., Citation2008; Taylor et al., Citation2005). Therefore, in order to reduce BMI misclassifications and accurately and timeously detect children who are at increased cardiometabolic risk, the use of South Asian specific BMI cut-offs is strongly recommended.
South Asian children aged 0–4 years of the 2010 study were found to not differ much in BMI distribution compared with their 1976 counterparts. This seems to be different from other ethnic groups. In 2–4 year old children of Dutch descent, an increase of overweight and obesity has been found since 1980 (Schonbeck et al., Citation2011) and in Turkish and Moroccan children a secular increase has also been found since 1997 in this age group (van Dommelen et al., Citation2015). It is unclear why in South Asian children the rise in overweight and obesity rates commences from the age of 5 years. It may mean a larger window of opportunity for preventive interventions. Nevertheless, in the Netherlands there is an urgent need for health educational and promotional programmes specifically tailored to South Asian parents and their children, to counteract the high overweight prevalence and prevent (future) cardiometabolic disease. Further research on these intervention programmes and their effectiveness is recommended.
IAHB_1445288 SupplementalFile.pdf
Download PDF (231.5 KB)Acknowledgements
We thank Ron Smit and Marion Groeneveld for their help in extracting the data from the digital health record system.
Disclosure statement
The authors report no conflicts of interest. The authors alone are responsible for the content and writing of the paper.
Related Research Data
References
- Balakrishnan R, Webster P, Sinclair D. 2008. Trends in overweight and obesity among 5-7-year-old White and South Asian children born between 1991 and 1999. J Public Health (Oxf) 30:139–144.
- Chiu M, Austin PC, Manuel DG, Shah BR, Tu JV. 2011. Deriving ethnic-specific BMI cutoff points for assessing diabetes risk. Diabetes Care 34:1741–1748.
- Cole TJ. 1990. The LMS method for constructing normalized growth standards. Eur J Clin Nutr 44:45–60.
- de Onis M, Onyango AW, Borghi E, Siyam A, Nishida C, Siekmann J. 2007. Development of a WHO growth reference for school-aged children and adolescents. Bull World Health Organ 85:660–667.
- de Wilde JA, van Dommelen P, Middelkoop BJ. 2013a. Appropriate body mass index cut-offs to determine thinness, overweight and obesity in South asian children in the Netherlands. PLoS One 8:e82822.
- de Wilde JA, Zandbergen-Harlaar S, van Buuren S, Middelkoop BJ. 2013b. Trends in body mass index distribution and prevalence of thinness, overweight and obesity in two cohorts of Surinamese South Asian children in The Netherlands. Arch Dis Child 98:280–285.
- Deurenberg-Yap M, Chew SK, Lin VF, Tan BY, van Staveren WA, Deurenberg P. 2001. Relationships between indices of obesity and its co-morbidities in multi-ethnic Singapore. Int J Obes Relat Metab Disord 25:1554–1562.
- Deurenberg P, Deurenberg-Yap M, Guricci S. 2002. Asians are different from Caucasians and from each other in their body mass index/body fat per cent relationship. Obes Rev 3:141–146.
- Jafar TH, Chaturvedi N, Pappas G. 2006. Prevalence of overweight and obesity and their association with hypertension and diabetes mellitus in an Indo-Asian population. CMAJ 175:1071–1077.
- Khadilkar VV, Khadilkar AV, Borade AB, Chiplonkar SA. 2012. Body mass index cut-offs for screening for childhood overweight and obesity in indian children. Indian Pediatr 49:29–34.
- Lear SA, Kohli S, Bondy GP, Tchernof A, Sniderman AD. 2009. Ethnic variation in fat and lean body mass and the association with insulin resistance. J Clin Endocrinol Metab 94:4696–4702.
- Meel P. 1985. De emigratie van Hindostaanse contractarbeiders naar Suriname 1873-1917. [The emigration of Hindustan contract labourers to Suriname 1873-1917]. Gronings Historisch Tijdschrift 92:120–138.
- Misra A. 2015. Ethnic-specific criteria for classification of body mass index: a perspective for Asian Indians and American diabetes association position statement. Diabetes Technol Ther 17:667–671.
- Misra A, Chowbey P, Makkar BM, Vikram NK, Wasir JS, Chadha D, Joshi SR, et al. 2009. Consensus statement for diagnosis of obesity, abdominal obesity and the metabolic syndrome for Asian Indians and recommendations for physical activity, medical and surgical management. J Assoc Physicians India 57:163–170.
- Nightingale CM, Rudnicka AR, Owen CG, Cook DG, Whincup PH. 2011. Patterns of body size and adiposity among UK children of South Asian, black African-Caribbean and white European origin: Child Heart And health Study in England (CHASE Study). Int J Epidemiol 40:33–44.
- Ntuk UE, Gill JM, Mackay DF, Sattar N, Pell JP. 2014. Ethnic-specific obesity cutoffs for diabetes risk: cross-sectional study of 490,288 UK biobank participants. Diabetes Care 37:2500–2507.
- Patel RR, Steer P, Doyle P, Little MP, Elliott P. 2004. Does gestation vary by ethnic group? A London-based study of over 122,000 pregnancies with spontaneous onset of labour. Int J Epidemiol 33:107–113.
- Pradeepa R, Mohan V. 2017. Prevalence of type 2 diabetes and its complications in India and economic costs to the nation. Eur J Clin Nutr 71:816–824.
- Schonbeck Y, Talma H, van Dommelen P, Bakker B, Buitendijk SE, Hirasing RA, van Buuren S. 2011. Increase in prevalence of overweight in Dutch children and adolescents: a comparison of nationwide growth studies in 1980, 1997 and 2009. PLoS One 6:e27608.
- Shaw NJ, Crabtree NJ, Kibirige MS, Fordham JN. 2007. Ethnic and gender differences in body fat in British schoolchildren as measured by DXA. Arch Dis Child 92:872–875.
- Stasinapoulos DMR, Robert AR. 2007. Generalized additive models for location scale and shape (GAMLSS) in R. J Stat Softw 23:1–46.
- Taylor SJ, Viner R, Booy R, Head J, Tate H, Brentnall SL, Haines M, et al. 2005. Ethnicity, socio-economic status, overweight and underweight in East London adolescents. Ethn Health 10:113–128.
- van Buuren S, Fredriks M. 2001. Worm plot: a simple diagnostic device for modelling growth reference curves. Stat Med 20:1259–1277.
- van Dommelen P, Schonbeck Y, HiraSing RA, van Buuren S. 2015. Call for early prevention: prevalence rates of overweight among Turkish and Moroccan children in The Netherlands. Eur J Public Health 25:828–833.
- Vazquez G, Duval S, Jacobs DR, Jr, Silventoinen K. 2007. Comparison of body mass index, waist circumference, and waist/hip ratio in predicting incident diabetes: a meta-analysis. Epidemiol Rev 29:115–128.
- Whincup PH, Gilg JA, Papacosta O, Seymour C, Miller GJ, Alberti KG, Cook DG. 2002. Early evidence of ethnic differences in cardiovascular risk: cross sectional comparison of British South Asian and white children. BMJ 324:635.
- Whincup PH, Nightingale CM, Owen CG, Rudnicka AR, Gibb I, McKay CM, Donin AS, et al. 2010. Early emergence of ethnic differences in type 2 diabetes precursors in the UK: the Child Heart and Health Study in England (CHASE Study). PLoS Med 7:e1000263.
- WHO. 1995. Physical status: the use and interpretation of anthropometry. Report of a WHO Expert Committee. World Health Organ Tech Rep Ser, 854, pp. 1–452.
- WHO. 2004. Appropriate body-mass index for Asian populations and its implications for policy and intervention strategies. Lancet 363:157–163.
- WHO. 2006. WHO child growth standards based on length/height, weight and age. Acta Paediatr Suppl 450:76–85.
- Wickramasinghe VP, Lamabadusuriya SP, Cleghorn GJ, Davies PS. 2011. Defining anthropometric cut-off levels related to metabolic risk in a group of Sri Lankan children. Ann Hum Biol 38:537–543.
- Wilson EB. 1927. Probable inference, the law of succession, and statistical inference. J Am Stat Assoc 22:209–212.