
Abstract
Background
Indicators of child height, such as mean height-for-age Z-scores (HAZ), height-for-age difference (HAD) and stunting prevalence, do not account for differences in population-average bone developmental stage.
Aim
Propose a measure of child height that conveys the dependency of linear growth on stage rather than chronological age.
Subjects and methods
Using Demographic and Health Surveys (2000–2018; 64 countries), we generated: (1) predicted HAZ at specific ages (HAZ regressed on age); (2) height-age (age at which mean height matches the WHO Growth Standards median); (3) Growth delay (GD), the difference between chronological age and height-age; (4) HAD; and (5) stunting prevalence. Metrics were compared based on secular trends within countries and age-related trajectories within surveys.
Results
In the most recent surveys (N = 64), GDs ranged from 1.9 to 19.1 months at 60 months chronological age. Cross-sectionally, HAZ, HAD and GD were perfectly correlated, and showed similar secular trends. However, age-related trajectories differed across metrics. Accumulating GD with age demonstrated growth faltering as slower than expected growth for children of the same height-age. Resumption of growth at the median for height-age was rarely observed.
Conclusion
GD is a population-level measure of child health that reflects the role of delayed skeletal development in linear growth faltering.
Keywords:
Introduction
Child height is universally considered to be sensitive to the cumulative effects of environmental exposures during the intrauterine period and early childhood (Tanner Citation1986; Bogin Citation1999). In optimal conditions, child height follows predictable age- and sex-dependent trajectories with population heights following a normal (Gaussian) distribution. In suboptimal conditions, linear growth faltering is expressed by a relatively slow rate of length/height gain, such that average length/height at any given age is smaller than expected. Linear growth faltering is a pervasive condition for which the causes and consequences have been a major focus of global health research and public health attention (WHO Citation2012; UN Citation2019). Although associations with adverse health outcomes later in life may be more correlational than causal (Leroy and Frongillo Citation2019), deficits in linear growth in early life are widely viewed as a core objective measure of the health and nutritional status of vulnerable populations.
Linear growth deficits are conventionally expressed as deviations from a reference or standard, such as the World Health Organisation Growth Standards (WHO-GS) (de Onis et al. Citation2007), by converting measures of child length or height into age- and sex-standardised height-for-age Z-scores (HAZ), or, alternatively, by calculating height-for-age difference (HAD) (Leroy et al. Citation2015) (). Both measures can be estimated from population-based surveys of anthropometric data (de Onis et al. Citation2007). Although a range of related indicators of child growth has been proposed (), the prevalence of stunting (% of a population with HAZ < −2) is the most widely used anthropometric indicator of suboptimal growth in low- and middle-income countries (LMICs).
Table 1. Summary of existing and proposed population-level child linear growth metrics.
In this paper, we propose that variations in population height distributions may be described by presenting the population height-age and the estimated mean growth delay (GD) in units of age or time, rather than stature. Height-age first appeared in the paediatric literature in the 1950s and is defined as the age at which an observed height would correspond to the 50th centile of a growth reference or standard (Reilly et al. Citation1950; Mellman et al. Citation1959; Bierich Citation1992). Although not a measure of maturation at the individual level, early literature used height-age to monitor the growth of individuals with endocrine disorders and found it to be related to other measures of maturity in childhood and adolescence (Mellman et al. Citation1959; Sproul and Huang Citation1964). The use of height-age has also been recommended by some to standardise other measures such as bone mineral density, and body mass index, in populations that experience high rates of linear growth faltering (Gordon et al. Citation2008; Zemel et al. Citation2010; Gao et al. Citation2012; Bonthuis et al. Citation2013). Although height-age cannot be used as a surrogate of maturational stage at the individual level, population-average height-age provides an empirical measure of the average skeletal developmental stage of the population compared to the reference population. However, height-age has rarely been used to explain or describe the slow average growth of children in LMICs (Golden Citation1994). To demonstrate the feasibility and utility of describing the growth of children in LMICs using height-age and GD, this study aims to use standardised multi-country anthropometric surveys to estimate both population height-age and GD, and to compare height-age and GD to conventional indicators of linear growth faltering (HAZ, HAD and stunting prevalence).
We propose GD to describe population growth deficits because population average absolute size, HAZ, or HAD do not directly convey that inequalities between populations in child growth are due to differences in the average stage of skeletal development which results in measured differences in observed average heights. Skeletal maturation is known to vary between healthy and disadvantaged populations (Tanner Citation1987; Hauspie et al. Citation1997; Malina Citation2004). If maturation is delayed by environmental constraints (e.g. dietary deficits), chronological age becomes progressively uncoupled from biological age, which is defined here as the age corresponding to the observed stage of biological maturation for a population living in optimal conditions for growth and development (Hermanussen Citation2011). We propose here that metrics of population-average child nutritional status that directly reflect height deficits as delays on the time scale (tempo), rather than deficiencies of physical stature (amplitude), are consistent with the cellular and endocrine mechanisms of bone elongation during child growth, and in particular the phenomenon of growth plate senescence (for details on growth plate senescence and its role in long bone development, growth faltering and catch-up growth see Emons et al. Citation2005; Forcinito et al. Citation2011; Lui et al. Citation2011, Citation2018). A focus on maturation delays may improve the understanding of the potential for later catch-up growth, because the rate of growth that children are expected to achieve after removal of any environmental constraints is related to their biological rather than chronological age (Finkielstain et al. Citation2013).
Subjects and methods
Study sample
The study sample consisted of publicly-available data from 145 Demographic and Health Surveys (DHS) from 64 countries, conducted between 2000 and 2018 (DHS Citation2019). Only data from available Phase IV–VII DHS surveys were included in this study to ensure consistency in the sampling frame and standardised anthropometric protocols. In these DHS phases, all children under age 5 years in the surveyed household were eligible for anthropometric assessment, whereas in previous DHS phases (I–III), only children of eligible women (women of reproductive age) were measured.
Anthropometric data
Height in centimetres (cm) and sex of children under 5 years of age were extracted from each survey, as well as age, in days, at the time of anthropometric assessment, calculated by subtracting date of birth from the date of the anthropometric measurement. Children whose month and/or year of birth was missing were excluded from the analyses of each survey. HAZ was calculated using the 2006 WHO-GS with the WHO macro in Stata 16 (WHO Citation2006). HAD was calculated as the difference (in cm) between the mean height of a population and the median height of the WHO reference population at a particular age (Leroy et al. Citation2015). Children with HAZ values more than 6 standard deviations above or below the median HAZ for the reference population were excluded, as recommended by the WHO (Citation2011).
Statistical analyses
Population mean HAZ at discrete ages (1, 2, 3, 4, and 5 years) was estimated with 95% confidence intervals (CI) using linear splines regressing HAZ on age in days, with a knot at 730 days of age (i.e. 2 years of age). The knot placement was based on the widely recognised pattern that most early life growth faltering, as observed on the HAZ-scale, takes place by 2 years of life (Victora et al. Citation2010). Moreover, visual observation of the HAZ-age associations in each individual survey confirmed that if there was an inflection point, it was approximately at age 2 years. Mean HAD values at discrete ages (1, 2, 3, 4, and 5 years) were generated using the same procedure. Finally, for each survey, we calculated the predicted probability of population-level stunting (in %) at discrete ages (1, 2, 3, 4, and 5 years) by regressing individual-level stunting status (“stunted,” observed HAZ < −2; or “not stunted,” observed HAZ ≥ −2) on age using logistic regression. All estimates (HAZ, HAD, and stunting) accounted for the DHS complex survey design and non-response by using sampling/design weights.
Height-age was defined as the age at which the observed mean of the population height in cm (at a certain chronological age) matches the median height (i.e. when HAZ = 0) of the WHO-GS. GD quantifies the discrepancy between height-age and chronological age at the population level. To estimate height-age, the predicted mean HAZ values for each survey at selected chronological ages were back-transformed into heights (cm) using WHO-GS LMS-parameters. The LMS parameters are the median (M), generalised coefficient of variation (S), and power (L) in the Box-Cox transformation (Cole Citation1990). The WHO-GS LMS table was used to identify the height-age (in days) at which the WHO-GS median height (i.e. the M-parameter) was closest to the observed population mean height (WHO Citation2006). As predicted HAZ was based on models that included data from both boys and girls, we computed the mean of each pair of boy and girl values of the WHO-GS median HAZ in the LMS table at each age to estimate height-age. To compute GD (in days, weeks, or months) we subtracted height-age from the chronological age at which the mean height was observed.
An alternative approach to model-based estimates of population level HAZ (or HAD) at a given age would be to calculate the arithmetic mean HAZ of observed height data collected within a narrow age-window (e.g. 2 months), and then follow the above-described process to derive height-age and GD. To establish the feasibility of this alternative approach, we compared our estimated GD from the spline estimates of HAZ at age 4 years (48 months) to mean HAZ of observed height data collected at 4 years ± 4 weeks (children measured at 47–49 months) for each survey and country. This age was selected to ensure there are observations on both sides of the target age when creating the age-bands (e.g. we could not use age 5, as there are no data available for age 5 years 4 weeks).
Height-age and GD were compared to several conventional metrics (predicted mean HAZ, HAD, predicted stunting prevalence at age 5 and under-5). The 95% upper and lower bounds for GD and height-age were calculated using the upper and lower bounds of the 95% confidence interval of the predicted mean HAZ based on the linear-spline regression model. To compare the population-level metrics, we created pyramid plots of GD (in months) against mean HAZ at age 5, predicted stunting prevalence at age 5, and predicted stunting prevalence among children under-5, for the most recent survey for each country, ranked by mean GD. We also created a matrix showing pair-wise Pearson correlation coefficients between metrics at age 5 (mean HAZ, mean HAD, height-age, GD, predicted probability of stunting, and predicted probability of stunted under-5). We plotted mean HAZ, HAD, and GD between ages 1 and 5 years for the most recent survey from each country. Secular trends in the growth metrics across multiple surveys were plotted for the countries with 3 or more repeated surveys (N = 22) between years 2000 and 2015.
Finally, using the WHO-GS, we generated figures showing simulated trajectories of GD and HAD between ages 0 and 2 years, and height-by-age and GD-by-age in a hypothetical population of children between ages 0 and 19 years (see Supplementary Appendix for further detail and methods).
All analyses were performed in Stata 16 (StataCorp Citation2019), and the code used to calculate height-age and GD is available in the Supplementary Appendix.
Results
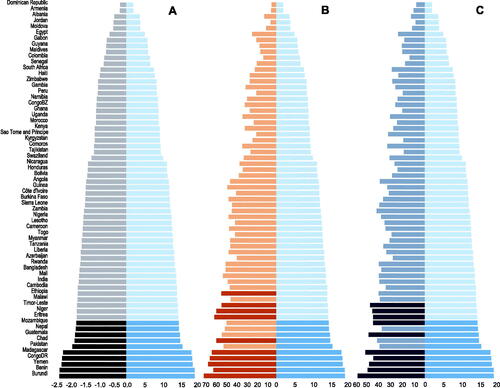
In the most recent survey for each country (N = 64), the height-age at the chronological age of 60 months (5 years) ranged from 40.9 to 58.1 months, corresponding to growth delays ranging from 1.9 to 19.1 months (Supplementary Table 1). Mean HAZ ranged from −2.3 to −0.2, HAD ranged from −11.2 cm to −1.0 cm and under-5 stunting prevalence from 7.1% to 56%. Countries were ranked identically using either GD or mean HAZ at 5 years, but the ranking of countries differed by stunting prevalence at both age 5 years and among children under-5 (). All five metrics were highly correlated; notably, the correlation of GD with stunting prevalence at age 5 years was identical to the correlation between mean HAZ and stunting prevalence at 5 years (Supplementary Figure 1).
Figure 1. GD (in months, light blue) at age 5 years versus (A) mean HAZ at age 5 years (dark grey), (B) prevalence of stunting at age 5 years (in %, orange), or (C) under-5 stunting prevalence (in %, grey-blue) (N = 64 countries, based on each country’s most recent available DHS dataset). In each panel, darker bars denote the 10 countries that would be ranked the worst-off based on each height metric.
Population-average age-related growth trajectories from birth to 5 years of age differed when using mean HAZ, mean HAD and GD; however, trajectories of GD by age generally appeared more similar to the mean HAD-by-age than the mean HAZ-by-age trajectories (; Supplementary Figure 2). The differences between the metrics were most notable between ages 2 and 5 years and are also reflected in a lower correlation coefficient between the change in GD and HAZ between ages 2 and 5 years (Pearson’s r = −0.48, p < 0.05) compared to the correlation between GD and the HAD change between ages 2 and 5 years (Pearson’s r = −0.94, p < 0.05). Simulated trajectories, however, demonstrated the discrepancies between GD and HAD in conveying stable versus catch-up trajectories (Supplementary Figure 3), and that a population that experiences catch-up defined by a stable (non-increasing) GD would need to extend its period of growth by a duration of time equal to its GD to achieve an average final height that is at the 50th centile of the WHO-GS (Supplementary Figure 4). However, this pattern of stable GD after a period of faltering was rarely observed in the surveyed countries (Supplementary Figure 2).
Figure 2. Mean HAZ, mean HAD, and GD at discrete ages between 1 and 5 years of age among children included in the most recent available DHS dataset for four example countries (Dominican Republic 2013 N = 3680, Zimbabwe 2015 N = 6084, Guatemala 2015 N = 12,286, and Pakistan 2018 N = 4212) ranked smallest to largest by the delta of GD between ages 1 and 5 years. See Supplementary Figure 2 for all countries.
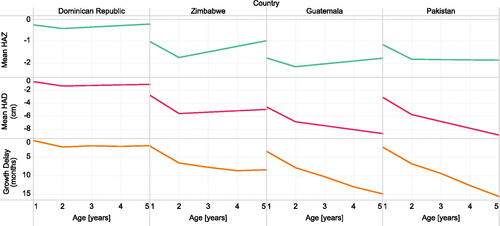
Figure 3. Secular changes in mean HAZ, mean HAD (in months) and GD (in months) at 5 years of age in all countries with three or more DHS surveys between 2000 and 2020 (N = 22).
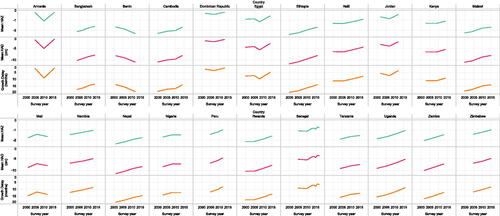
Four selected countries with highly divergent growth patterns (Dominican Republic, Zimbabwe, Guatemala and Pakistan) illustrated the differences among the metrics in their age-related trajectories (). In the Dominican Republic, mean HAZ, mean HAD and GD shared a similar trajectory by age (from ages 1 to 5 years), with a minor improvement in HAZ and HAD after 2 years, and a modest increase in GD between ages 1 and 2 years but stable GD thereafter (). In Zimbabwe, mean HAZ and HAD worsened until age 2 years, but improved thereafter, whereas GD showed a modest increase until age 4 years (). Both the Dominican Republic and Zimbabwe contrasted with Guatemala, where HAD and GD worsened across the age range despite mean HAZ improving after 2 years of age. This substantial increase in GD from ages 1 to 5 years was also observed in Pakistan, where mean HAZ did not change after 2 years of age but mean HAD and GD worsened (). In contrast to the variability in age-related trajectories, secular trends in child height were identically portrayed by HAZ, HAD and GD ().
In analyses using age-bands, height-age and GD metrics were usually similar to the estimates generated by the model-based approach. The Pearson correlation coefficient for height-age estimated using the model-based approach and the height-age from the age-band method was 0.94 (p < 0.05). The correlation coefficient for GD from the model-based approach and the age-band method was similarly 0.94 (p < 0.05). The estimates generated by the two methods differed by <5% in 92% of surveys for height-age, and in 44% of surveys for GD (Supplementary Table 2). Surveys with low sample sizes within the age-band produced less precise estimates (reflected by wide 95%CI) compared to the model-based method (Supplementary Table 2). Also, in surveys in which estimated GD was smaller (mean HAZ close to 0), relatively small absolute differences (in months) between the methods appeared as large relative (%) differences due to the small denominator.
Discussion
The present study used anthropometric survey data to describe variations in population height in LMICs in terms of height-age and growth delay. The rationale for this study was that existing metrics (mean HAZ, HAD, stunting prevalence) may not sufficiently convey the extent to which differences in child growth across populations reflect differences in the population-average stage of bone development. The results showed that although both height-age and GD were highly correlated with HAZ, HAD and stunting prevalence when used cross-sectionally, there were important differences when the metrics were applied to examine trajectories with age.
The mechanisms by which environmental factors in LMICs delay long bone lengthening are not fully understood, but likely relate to dysregulation of growth plate senescence (Emons et al. Citation2005; Forcinito et al. Citation2011; Lui et al. Citation2011; Finkielstain et al. Citation2013). Genetic and epigenetic programming intrinsic to the growth plate determine the extent to which bones achieve growth in length and defines the timing of eventual cessation of growth (i.e. senescence). The absolute increase in the length of a long bone in a given time interval, and variations in the rate of bone extension, are the result of growth plate chondrocyte proliferation rate and hypertrophy (Lui et al. Citation2011; Finkielstain et al. Citation2013). This process is governed by biological maturation (or biological age) rather than chronological age (Finkielstain et al. Citation2013), because if the cell proliferation rate slows down due to external constraints (e.g. malnutrition), so does the biological maturation of the skeleton, resulting in a bone/skeletal age that is younger than the chronological age (assuming skeletal age is a proxy for biological age). Rather than permanently impairing growth potential, a delay of growth plate senescence is theoretically remediable; upon removal of the constraining factors, bone elongation resumes at a rate that is consistent with the relatively delayed skeletal age (Emons et al. Citation2005).
Currently, the extent to which linear growth faltering affects children in LMICs is conventionally measured by the number of stunted children and stunting prevalence, indicators that are widely used by the research, programmatic and advocacy communities to describe global and national trends in child nutrition. A conceptual disadvantage of stunting prevalence is that it focuses attention on a defined sub-set of children who are below an arbitrary statistical cut-point in the z-score distribution; however, the entire HAZ distribution is often shifted downward in LMICs, indicating that both stunted and non-stunted children experience suboptimal growth (Roth et al. Citation2017; Perumal et al. Citation2018). Therefore, the burden of malnutrition, disease and poverty is substantially greater than what is conveyed by counting the number of stunted children. Using mean HAZ or mean HAD addresses this issue as these metrics summarise the average experience of the whole population. However, both HAZ and HAD share a limitation in that they reflect the health status of a population as a mean deficit in stature relative to a healthy reference population of the same chronological age. The assumptions in tracking either HAZ or HAD are that: (i) a decline with age suggests persistent (or worsening) adverse conditions, (ii) a constant HAZ/HAD deficit indicates a form of steady-state whereby neither faltering or catch-up growth are occurring, and (iii) an increase in HAZ or HAD with age (from a negative value towards zero) reflects catch-up growth. Leroy et al. argued that HAD rather than HAZ should be used to compare population changes with age (Leroy et al. Citation2015) and they highlighted the empirical differences between the two measures even though they are derived from the same underlying data; for example, mean HAZ is often observed to be steady or increasing towards zero between 2 and 5 years, suggesting catch-up growth but mean HAD continues to decrease (Leroy et al. Citation2015). However, neither the HAD or HAZ approach incorporates a physiological benchmark against which to judge the optimality of an observed HAZ or HAD trajectory. For example, in a previously growth-faltered population in which mean HAZ/HAD is < 0, the optimal amount of catch-up growth (e.g. the growth rate that would be expected if conditions for healthy growth were normalised) cannot be readily defined on either the HAZ or HAD scales (Supplementary Table 3). Conversely, the theory of delayed growth plate senescence (on which GD is based) suggests the maximal population-average growth rate under optimal conditions, irrespective of chronological age, is the expected rate for the biological age (or skeletal age) (Finkielstain et al. Citation2013). We therefore expect that if conditions for growth become optimal in a population of previously growth faltering children, their growth will, on average, occur at the rate expected for the children’s height-age. Our results showed that in some countries, such as Pakistan and Guatemala, worsening GD after 2 years of age suggested an ongoing process of maturational delay and inadequate rate of growth for biological age, even though the HAZ-by-age graph implied that the children grew at, or even higher than, the expected rate for their chronological age. Conversely, in some countries such as Zimbabwe, an improving HAZ-by-age trajectory was accompanied by a flattened GD curve by age 4 years, which met the definition of optimal catch-up growth (i.e. steady-state GD indicating that growth was proceeding at the expected rate for the height-age), and therefore a best-case scenario for a population that has experienced growth faltering. If country comparisons were based only on the shape of the HAZ-by-age trajectories, it may be erroneously concluded that growth conditions in Dominican Republic, Zimbabwe and Guatemala were similar, improving after 2 years of age when mean HAZ increased. Such a conclusion conflicts with the interpretation of the GD trajectories, which suggest important differences among these three countries – unlike in the Dominican Republic, growth of children in Guatemala continued to be restricted from age 2 to 5 years. Zimbabwe further highlighted the distinction between HAD and GD; even though these trajectories often appear similar, HAD is improving even when GD is worsening.
A GD-by-age trajectory does not mirror its corresponding HAZ- or HAD-by-age pattern because GD is benchmarked against expected growth at the same average biological age, whereas HAZ and HAD are both comparisons to growth of a healthy population at the same chronological age. Prior to puberty, average linear growth velocity is always expected to be higher at younger ages; therefore, a growth-faltered (and therefore biologically younger) population typically grows at a rate that is faster than that of the chronological age-matched standard, yet may still grow at a rate slower than the expected rate of the younger biological age-matched standard. Failure to attain the growth rate of the biological age-matched standard is evidence of ongoing limitations to healthy growth and would be indicated by an increasing GD (i.e. further uncoupling of chronological and biological age). Since both HAD- and HAZ-tracking entail comparisons to chronological age-matched trajectories, both approaches may yield positive slopes relative to the standard even while GD reveals a worsening trajectory. HAD- and HAZ-tracking are distinguished from one another by their reference trajectories – whereas HAD-tracking is a comparison to the chronological age-matched median trajectory (HAD = 0), HAZ-tracking is a comparison to any chronological age-matched trajectory corresponding to the HAZ at the beginning of the interval of interest (e.g. if HAZ = −1, then the reference trajectory is a continuation along HAZ = −1). At a given chronological age, absolute growth velocities are always somewhat lower when tracking along a negative HAZ versus the median (this is what gives rise to the familiar “fanning out” appearance of the growth curves), so a discrepancy between GD- and HAZ-tracking is expected to be more pronounced than the corresponding difference between GD- and HAD-tracking.
Nonetheless, it is important to acknowledge that HAZ, HAD, height-age and GD are simply different expressions of the same height and age data. Therefore, in contrast to their use in tracking age-related growth dynamics, they were nearly perfectly correlated and thus led to the same conclusions when used cross-sectionally (i.e. for a single age or narrow age interval) to make between-country comparisons or within-country comparisons over time. Differences in country rankings based on GD (or HAZ) versus stunting at age 5 reflect the expected variability in the shape of the height distributions between countries, such that the proportion of children under the −2 SD cut-off is strongly but not entirely predictable using mean HAZ. The differences between the stunting prevalence aggregated across the full 0-to-5-year age interval (which is the way the indicator is most conventionally presented) and the other metrics specified at 5 years of age reflect the differences in the cumulative growth experience of children who have survived until 5 years of age compared to the average growth experience of children between ages 0 and 5 years, some of whom do not survive to age 5.
Like mean HAZ and HAD, height-age and GD are theoretically robust against random errors in height and age ascertainment as they summarise growth at the population aggregate-level. However, the use of height-age and GD has limitations that must be acknowledged. From a mechanistic standpoint, height-age and GD draw attention to the critical role of tempo of growth, signified by skeletal maturation, on final height of children in resource-constrained settings. Mean skeletal age delays of up to two years have been reported, but it is possible that not all populations presenting low average height for age are experiencing a similar delay in biological maturation (Frisancho et al. Citation1970). In the context of the current study, it is important to highlight we did not aim to establish the extent to which low height-age represents a true biological delay in skeletal maturation, as this cannot be measured without access to biological age measures (e.g. bone age based on hand-wrist radiographs), which are not routinely collected in large-scale population health surveys. We also acknowledge that the term GD, while intuitive and easy to understand, comes with a risk of misinterpretation – it should not be taken as a direct proxy for delay in skeletal or biological age which may be lower than GD because factors other than delayed maturation may also have contributed to the observed height deficit (e.g. epigenetic factors, growth plate injuries unrelated to growth plate senescence). The conflation of GD with skeletal delay may also overestimate catch-up potential. In future work, routine collection of bone maturation data in demographic and health surveys, such as hand-wrist X-rays, would enable the estimation of the extent to which populations are experiencing maturational delays compared to other mechanisms of short stature. Modern X-ray technologies include portable devices with very low radiation exposure, making these safe and affordable methods of collecting maturational data even in field contexts. The interpretation of a population growth trajectory differs substantially from that of an individual child, since the normal population mean height can be assumed to be the WHO median, whereas an individual child’s optimal height trajectory is usually unknown even if there is ancillary information (e.g. bone age, parental heights). Therefore, the present recommendation is to consider GD as a candidate population-level metric, whereas its clinical application to individual children is not recommended. Although the use of height-age and GD directly quantify the extended period of growth that will eventually be required to achieve an average final adult height that would be expected under optimal conditions (Lui et al. Citation2011; Finkielstain et al. Citation2013), in reality, the onset of puberty will impact the eventual completeness of any catch-up growth earlier in childhood.
As with HAD, height-age and GD are most coherently used at a given age or within a narrow age band. The analysis we conducted using the age-band compared to the model-based approach to estimate height-age and GD highlighted that care should be taken if estimating GD within narrower age-bands with smaller sample sizes, or when mean HAZ is relatively high (close to zero). It is important to apply the same approach (i.e. age-band method or spline approach) to all samples within a study. With both methods it is important to consider data quality, and similarly to HAZ, poor quality anthropometric data could contribute to unreliable height-age and GD estimates (Perumal et al. Citation2020). While the term GD implies that height-ages are always lower than chronological ages, this does not hold true in some higher income country contexts, where the population height-age might be higher than zero when compared to the WHO-GS mean (Júlíusson et al. Citation2011; Saari et al. Citation2011). If height-age is positive, in a population or a population sub-group, compared to the WHO mean, GD should be constrained to zero (i.e. no delay).
The application of GD as a population health measure might seem to be a significant departure from the current standard of practice for describing growth faltering. However, in other fields, including psychology and education, delays in development (e.g. cognitive delay) are measured using the age scale as standard practice. To communicate GD to a broad audience, the growth status of a population could be described through a comparison with chronological age, e.g. In Pakistan, by 5 years of age, children’s growth is delayed, on average, by approximately 16 months. This means that the average height of 5-year-old children in Pakistan is similar to the height of three-and-a-half-year-old children living in optimal conditions for child growth. Future work should test the suitability of height-age and GD in a range of contexts, including child growth research, program monitoring, and advocacy. In conclusion, population-average height-age and growth delay are meaningful measures of child health and nutritional status that are consistent with biological principles. These measures may be preferred over mean HAZ, HAD or stunting prevalence, particularly when presenting age-related trajectories at the population level.
Author contributions
All authors contributed to the design and conceptualisation of this paper, HQ and LM carried out the analyses, and LM drafted the initial manuscript. All authors made substantial contributions to the interpretation of the data, revised the manuscript critically for important intellectual content, and agree to be accountable for all aspects of the work. All authors have read and approved the final manuscript.
Sources of support
LM was supported by the SickKids Centre for Global Child Health Growth and Development Fellowship.
Supplemental Material
Download PDF (942.8 KB)Acknowledgements
The authors would like to thank all the participants of the DHS surveys, and all the individuals involved in producing and curating these data. We would also like to thank William Johnson for a critical review of an earlier draft manuscript.
Disclosure statement
No potential conflict of interest was reported by the author(s).
Data Availability Statement
Data are available in a public, open access repository. The data used are DHS and are publicly available at https://dhsprogram.com/data/available-datasets.cfm.
References
- Bierich JR. 1992. Constitutional delay of growth and adolescence. Baillieres Clin Endocrinol Metab. 6(3):573–588.
- Bogin B. 1999. Patterns of human growth. Cambridge: Cambridge University Press.
- Bonthuis M, Jager KJ, Abu-Hanna A, Verrina E, Schaefer F, van Stralen KJ. 2013. Application of body mass index according to height-age in short and tall children. PLoS ONE. 8(8):e72068.
- Cole TJ. 1990. The LMS methods for constructing normalized growth standards. Eur J Clin Nutr. 44:45–60.
- DHS. 2019. Demographic and health surveys overview. [accessed 2019 July 2]. https://dhsprogram.com/What-We-Do/Survey-Types/DHS.cfm.
- Emons JAM, Boersma B, Baron J, Wit JM. 2005. Catch-up growth: testing the hypothesis of delayed growth plate senescence in humans. J Pediatr. 147(6):843–846.
- Finkielstain GP, Lui JC, Baron J. 2013. Catch-up growth: cellular and molecular mechanisms. World Rev Nutr Diet. 106:100–104.
- Forcinito P, Andrade AC, Finkielstain GP, Baron J, Nilsson O, Lui JC. 2011. Growth-inhibiting conditions slow growth plate senescence. J Endocrinol. 208(1):59–67.
- Frisancho AR, Garn SM, Ascoli W. 1970. Childhood retardation resulting in reduction of adult body size due to lesser adolescent skeletal delay. Am J Phys Anthropol. 33(3):325–336.
- Gao T, Leonard MB, Zemel B, Kalkwarf HJ, Foster BJ. 2012. Interpretation of body mass index in children with CKD. Clin J Am Soc Nephrol. 7(4):558–564.
- Golden M. 1994. Is complete catch-up possible for stunted malnourished children? Eur J Clin Nutr. 48:58–71.
- Gordon CM, Bachrach LK, Carpenter TO, Crabtree N, El-Hajj Fuleihan G, Kutilek S, Lorenc RS, et al. 2008. Dual energy X-Ray absorptiometry interpretation and reporting in children and adolescents: the 2007 ISCD pediatric official positions. J Clin Densitom. 11(1):43–58.
- Hauspie RC, Vercauteren M, Susanne C. 1997. Secular changes in growth and maturation: an update. Acta Paediatr Suppl. 423:20–27.
- Hermanussen M. 2011. Tempo and amplitude in growth. Georgian Med News. 8:83–88.
- Júlíusson PB, Roelants M, Hoppenbrouwers K, Hauspie R, Bjerknes R. 2011. Growth of Belgian and Norwegian Children compared to the WHO growth standards: prevalence below -2 SD and above +2 SD and the effect of breastfeeding. Arch Dis Child. 96(10):916–921.
- Kinyoki DK, Osgood-Zimmerman AE, Pickering BV, Schaeffer LE, Marczak LB, Lazzar-Atwood A, Collison ML, et al. 2020. Mapping child growth failure across low- and middle-income countries. Nature 577:231–234.
- Leroy JL, Frongillo EA. 2019. Perspective: what does stunting really mean? A critical review of the evidence. Adv Nutr. 10(2):196–204.
- Leroy JL, Ruel M, Habicht JP, Frongillo EA. 2015. Using height-for-age differences (HAD) instead of height-for-age z-scores (HAZ) for the meaningful measurement of population-level catch-up in linear growth in children less than 5 years of age. BMC Pediatr. 15(1):11.
- Lui JC, Jee YH, Garrison P, Iben JR, Yue S, Ad M, Nguyen Q, et al. 2018. Differential aging of growth plate cartilage underlies differences in bone length and thus helps determine skeletal proportions. PLoS Biol. 16(7):e2005263.
- Lui JC, Nilsson O, Baron J. 2011. Growth plate senescence and catch-up growth. Endocr Dev. 21:23–29.
- Malina RM. 2004. Secular trends in growth, maturation and physical performance: a review. Przegl Antropol. 67:3–31.
- Mellman W, Bongiovanni A, Hope J. 1959. The diagnostic usefullness of skeletal maturation in an endocrine clinic. Pediatrics. 23(3):530–544.
- Nandy S, Irving M, Gordon D, Subramanian SV, Smith GD. 2017. Poverty, child undernutrition and morbidity: new evidence from india. Child Serv Dev World. 011650:309–315.
- de Onis M, Onyango A, Borghi E, Siyam A, Nishida C, Siekmann J. 2007. development of a WHO growth reference for school-aged children and adolescents. Bull World Health Organ. 85(09):660–668.
- Osgood-Zimmerman A, AI, Millear RW, Stubbs C, Shields BV, Pickering L, Earl Nicholas Graetz DK, Kinyoki, et al. 2018. Mapping child growth failure in Africa between 2000 and 2015. Nature. 555(7694):41–47.
- Perumal N, Bassani DG, Roth DE. 2018. Use and misuse of stunting as a measure of child health. J Nutr. 148(3):311–315.
- Perumal N, Namaste S, Qamar H, Aimone A, Bassani DG, Roth DE. 2020. Anthropometric data quality assessment in multisurvey studies of child growth. Am J Clin Nutr. 112(Supplement_2):806S–815S.
- Reilly W, Wilkins L, Deamer W, Motel W, Dietrich H. 1950. Endocrine therapy in childhood: round table discussion. Pediatrics. 6(6):908–918.
- Roth DE, Krishna A, Leung M, Shi J, Bassani DG, Barros AJD. 2017. Early childhood linear growth faltering in low-income and middle-income countries as a whole-population condition: analysis of 179 demographic and health surveys from 64 countries (1993–2015). Lancet Global Health. 5(12):e1249–e1257.
- Saari A, Sankilampi U, Hannila ML, Kiviniemi V, Kesseli K, Dunkel L. 2011. New Finnish growth references for children and adolescents aged 0 to 20 years: length/height-for-age, weight-for-length/height, and body mass index-for-age. Ann Med. 43(3):235–248.
- Sproul A, Huang N. 1964. Growth patterns in children with cystic fibrosis. J Pediatr . 65(5):664–676.
- StataCorp. 2019. Stata statistical software: release 16. College Station (TX): StataCorp LLC.
- Svedberg P. 2000. Poverty and undernutrition: theory, measurement and policy. New Delhi: Oxford India Paperbacks.
- Tanner JM. 1986. Growth as a mirror for the conditions of society: secular trends and class distinctions. In: Demirjian A, editor. Human growth: a multidisciplinary review. London: Taylor and Francis. p. 3–34.
- Tanner JM. 1987. Issues and advances in adolescent growth and development. J Adolesc Health Care . 8(6):470–478.
- UN 2019. Sustainable development goals. Sustainable development knowledge platform. [accessed 2018 Oct 16]. https://sustainabledevelopment.un.org/sdgs.
- Victora CG, De Onis M, Hallal PC, Blössner M, Shrimpton R. 2010. Worldwide timing of growth faltering: revisiting implications for interventions. Pediatrics. 125(3):e473–e477.
- WHO. 2006. WHO child growth standards: length/height for age, weight-for-age, weight-for-length, weight-for-height and body mass index-for-age, methods and development. Geneva (Switzerland): WHO.
- WHO. 2011. Child growth standards software. WHO anthro and macros. Geneva (Switzerland): WHO.
- WHO. 2012. 65th World Health Assembly: prevention and control of non-communicable diseases. Geneva (Switzerland): WHO.
- WHO. 2015. 100 Core health indicators. Geneva (Switzerland): WHO.
- Zemel BS, Leonard MB, Kelly A, Lappe JM, Gilsanz V, Oberfield S, Mahboubi S, et al. 2010. Height adjustment in assessing dual energy X-ray absorptiometry measurements of bone mass and density in children. J Clin Endocrinol Metabol. 95(3):1265–1273.