
 ?Mathematical formulae have been encoded as MathML and are displayed in this HTML version using MathJax in order to improve their display. Uncheck the box to turn MathJax off. This feature requires Javascript. Click on a formula to zoom.
Abstract
Background
Lack of paediatric reference data limits the utility of handgrip strength as a measure of fitness and well-being.
Aim
To develop paediatric handgrip reference curves and evaluate associations with body size and composition and race/ethnicity group.
Subjects and methods
Handgrip, body size and composition data were obtained from National Health and Nutrition Examination Survey 2011–2014 participants aged 6–20 years. Densitometry-derived fat and appendicular lean soft tissue mass index Z-scores (FMIZ, ALSTMIZ) were generated in participants >8 years. Dominant and non-dominant handgrip reference curves were created using the LMS method. Analyses included sample weights to produce nationally representative estimates.
Results
Differences in handgrip strength according to hand dominance increased with age. Handgrip strength was associated with height and arm length Z-scores (R = 0.42 to 0.47) and ALSTMIZ (R = 0.54). Handgrip strength was higher in the non-Hispanic Black group and lower in the Mexican American compared to non-Hispanic White group. Group differences were attenuated when adjusted for height, arm length or ALSTMIZ.
Conclusion
Paediatric handgrip reference curves were generated from which individual Z-scores can be calculated separately for dominant versus non-dominant hand and adjusted for body size. Association with ALSTMIZ suggests handgrip Z-score may be used as a measure of functional body composition.
Keywords:
Introduction
Muscular fitness is associated with improved bone health, decreased metabolic and cardiovascular disease, and overall wellness in children (Smith et al. Citation2014). Improvements in muscular strength also complement improvements in aerobic fitness, contributing to overall health benefits of regular physical activity (Atlantis et al. Citation2009; Faigenbaum et al. Citation2013; Cadore et al. Citation2014). Grip strength, measured by handheld dynamometer, is an accessible, inexpensive, and accurate measurement of muscle fitness and strength. In population studies, it provides information about overall fitness and health (Yuki et al. Citation2023; de Souza et al. Citation2022), and in the clinical setting, it is useful for assessing effects of disease processes, medications, or behaviour such as physical inactivity on muscle mass and function (Dougherty et al. Citation2011; Hogan et al. Citation2020; Meyer et al. Citation2022; de Koning et al. Citation2023). However, the utility of handgrip strength measures in children is limited by a lack of adequate reference data from which to calculate Z-scores relative to age and gender with adjustment for body size.
Some previous studies have described normative values of handgrip strength by age and gender for populations of healthy children across the world (Catley and Tomkinson Citation2013; Omar et al. Citation2015; Little Citation2017; Lim et al. Citation2019), but these studies were based on small sample sizes, limited age ranges, or did not assess the relationship between handgrip strength and body size. Handgrip strength data collected as part of the U.S. National Health and Nutrition Examination Survey (NHANES) offers an opportunity to overcome these shortcomings. Prior publications have reported average estimates of paediatric handgrip strength by age, gender, and body size using NHANES data (Ervin et al. Citation2013, Citation2014; Laurson et al. Citation2017; Kocher et al. Citation2019; McGrath et al. Citation2020); however, these studies have significant limitations. First, some studies reported only a subset of the paediatric population within a limited age range or from a single NHANES survey (Ervin et al. Citation2013, Citation2014; Laurson et al. Citation2017). Second, some prior studies (Laurson et al. Citation2017; Kocher et al. Citation2019) reported reference values but did not apply sample weights as recommended by the National Centre for Health Statistics (NCHS) when using NHANES data so their results do not accurately represent the U.S. population. Third, no existing paediatric publication included smoothed percentile curves from which individual Z-scores can be calculated. Kocher et al. (Citation2019) reported mean and standard deviation grip strength by age group and percentile, but the percentiles were not smoothed. Analytic techniques that provide smoothed reference percentiles avoid random fluctuations in percentile distributions, especially at the extremes of the distribution (Flegal Citation1999). While McGrath et al. (Citation2020) published smoothed percentile curves of handgrip, the investigators did not provide the data from which to calculate individual level Z-scores. Finally, several prior studies reported maximum combined (left and right hand) handgrip strength (Ervin et al. Citation2013, Citation2014; Laurson et al. Citation2017) and did not differentiate dominant from non-dominant hand. The effect of hand dominance on grip strength in youth has been demonstrated previously (Lim et al. Citation2019). Wang et al. (Citation2019) observed that grip strength was about 5% greater on the dominant vs. non-dominant hand and the differences were significantly greater for right-hand dominant individuals versus left-hand dominant individuals in a large sample of participants ages 6–80 years across two NHANES surveys. McGrath et al. (Citation2020) reported percentile curves according to hand dominance, noting that hand dominance can change across the lifespan and that grip strength may not always be greater in the dominant hand (Sivagnanasunderam et al. Citation2015; Wang et al. Citation2018). However, the paper does not include the data from which to calculate individual level Z-scores by hand dominance. In children, neuromuscular, orthopaedic, or developmental disorders may produce asymmetries and affect handedness, supporting the differentiation of grip strength Z-scores by hand dominance for the most accurate description of overall muscle strength in individual youth.
Additionally, previous studies have examined associations of weight or body mass index (BMI) with handgrip strength (Ervin et al. Citation2014; Laurson et al. Citation2017; Kocher et al. Citation2019; McGrath et al. Citation2020). However, weight and BMI may conceal differences in fat and lean mass distribution in certain populations (Harsha et al. Citation1978; Schutte et al. Citation1984; Goran et al. Citation1997; Nelson and Barondess Citation1997; Lu et al. Citation2011; Sousa et al. Citation2013; Weber et al. Citation2013; Marwaha et al. Citation2014). For example, appendicular lean soft tissue index, a measure of skeletal muscle in the arms and legs, is significantly less in youth who identify as Asian and significantly higher in youth who identify as African American, compared to those who identify as White (Zemel et al. Citation2023). Muscle strength scales to muscle size and to the length of bone over which muscle forces are exerted. As such, handgrip strength may be a useful indicator of lean body mass or muscle function, and group differences in muscle strength may be related to body composition differences. No prior studies have examined associations of body composition measures with handgrip strength – an important consideration to support handgrip strength as a potential indicator of functional body composition (Lad et al. Citation2013).
Similarly, height as an indicator of bone length is an important determinant of handgrip strength but the association differs by age and sex (Kocher et al. Citation2019). In children, height and age co-vary, so handgrip strength-for-age encapsulates height effects to a large degree. Relative to handgrip strength-for-age, handgrip strength relative to height-for-age may be a more meaningful indicator since it captures residual size effects of height as well as pubertal maturation, since earlier and later maturing children will differ in their height-for-age during the peripubertal years. The effects of pubertal maturation on body composition are well-recognised (Zemel Citation2022). Assessment of muscle strength relative to height-for-age may be especially valuable in the clinical evaluation of individuals with altered body size, maturation or body composition.
In light of these gaps in the literature we aimed to: 1) generate smoothed age- and gender-specific paediatric handgrip reference distributions for dominant and non-dominant hand using appropriate sampling weights and the LMS (Lambda, Sigma, Mu) method (Cole and Green, Citation1992) to facilitate calculation of Z-scores (D-HGZ, ND-HGZ); 2) develop size adjustment factors for handgrip strength Z-scores using height-for-age Z-score (HAZ) and upper arm length Z-score (UALZ); 3) evaluate associations between handgrip strength Z-scores and densitometry (DXA)-derived lean body mass index Z-score (LBMIZ) and appendicular lean soft tissue mass index Z-scores (ALSTMIZ), and explore differences in handgrip strength among subgroups of the NHANES sample.
Methods
Study sample
This study utilised publicly available cross-sectional handgrip and body composition data from NHANES 2011–2014 participants aged 6–19.9 years (). All available data were used. NHANES is an annual survey conducted by the NCHS that uses a complex, multi-stage probability sampling method designed to produce a dataset representative of the noninstitutionalized U.S. civilian population (National Center for Health Statistics Citation2014). The survey included a household interview and a detailed examination obtained in mobile examination centres. Approval for NHANES 2011–2014 was obtained from the NCHS Research Ethics Review Board.
Figure 1. Participant flow chart.
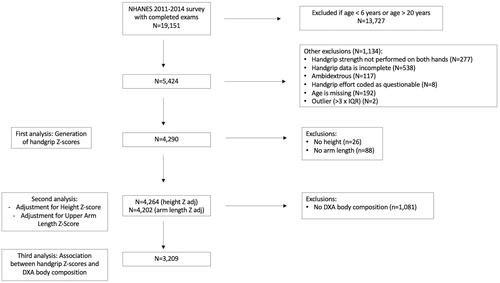
For the generation of handgrip and upper arm length Z-scores, we included participants ages 6–19.9 years with bilateral handgrip measurements. Participants were excluded for the following reasons: lack of bilateral measurements, incomplete handgrip data or questionable handgrip effort, ambidextrous status, missing age, or outlier status for handgrip strength (no outliers were identified for upper arm length). Outliers were identified by calculating the interquartile range by sex and integer age years and sex, and flagging values that were more than three times the interquartile range below the 25th percentile or above the 75th percentile. Sub-analyses were performed on participants with DXA data.
Study data
Dominant and non-dominant handgrip strength was determined using a Takei Digital Grip Dynamometer, Model T.K.K.5401. Participants self-reported handedness and were instructed to perform warm-up exercises prior to the procedure. Each hand was tested three times, alternating hands between trials with a 60-second rest between measurements on the same hand. The maximum handgrip strength for each hand was used for analysis. Full details of the handgrip strength methodology are available in the NHANES Muscle Testing Procedures Manual (National Center for Health Statistics Citation2011a).
Age was calculated in months as reported at the time of examination. U.S. Census Bureau classifications for race and Hispanic origin were ascertained by participant self-report at the time of the interview. These were categorised in the NHANES database as: Mexican American, Other Hispanic, Non-Hispanic White, Non-Hispanic Black, Other Race (including multi-racial) and missing. Height (cm) and weight (kg) were obtained by using standard procedures and were used to calculate BMI (kg/m2). Sex-specific height, weight, and BMI Z-scores for age were calculated by using the 2000 CDC reference data (Kuczmarski et al. Citation2000). Upper arm length was measured with a tape measure (0.1 cm) and the arm bent to 90° at the elbow. The measurement was taken from the uppermost edge of the right acromion process to the tip of the olecranon along the centre of the posterior surface of the upper arm (National Center for Health Statistics Citation2011b). Fat mass index, lean body mass (excluding bone), and appendicular lean soft tissue mass (ALSTM, excluding bone) were obtained from whole body DXA scans. DXA scans were performed in participants over 8 years of age using a Hologic A densitometer and analysed using APEX software version 4. Fat mass index (FMI), lean body mass index (LBMI), and appendicular lean soft tissure mass index (ALSTMI) were calculated [(kg)/height (m)2] and converted into age- and sex-specific Z-scores (Zemel et al. Citation2023). The NHANES body composition adjustment applied by the NCHS (Schoeller et al. Citation2005) was removed by dividing lean body mass by 0.946 and adjusting fat mass accordingly to maintain whole body mass in order to match the Zemel reference dataset.
Generation of handgrip and upper arm length reference curves
Sex-specific reference curves for dominant and non-dominant handgrip and upper arm length were generated using the LMS method described by Cole and Green (Citation1992) and implemented in R programming language using the Generalised Additive Models for Location, Scale, and Shape (GAMLSS library) in R (Stasinopoulos and Rigby Citation2007). The LMS method generates smoothed growth curves using the Box-Cox Cole and Green (BCCG) transformation. Model selection was performed sequentially by gradually increasing the degrees of freedom starting with mu (M), and then moving on to the lambda (L) and sigma (S) model parameters. Model selection was based on several considerations including the Akaike Information Criterion (AIC), diagnostic plots (e.g. residual, worm and trend plots) and visual inspection of the curves to avoid overfitting. Age-specific values for the power (L), median (M), and coefficient of variation (S) were estimated and used to calculate exact centile curves using EquationEquation 1(1)
(1) :
(1)
(1)
where L, M, and S are age-specific values, and Z is the value of a given percentile in the cumulative standard normal distribution (e.g. Z = 0 for the 50th centile). Exact Z-scores (Z) can be calculated for a measurement (X), using the age-specific L, M, and S parameters and Equation 2:
(2)
(2)
Statistical analysis
Statistical analyses were conducted with STATA 16.1 (StataCorp LLC). Survey data commands using the “svy” prefix in STATA were used to account for the multi-stage NHANES sample design and included sample weights as recommended by the NCHS to produce estimates representative of the U.S. population (Johnson et al. Citation2014). Standard descriptive statistics were used to summarise demographic characteristics and outcome data. Sex-specific regression analyses examined associations between indicators of body size for age (HAZ and UALZ) and D-HGZ and ND-HGZ. Interaction terms were included to consider whether the effect of body size varied as a function of age (e.g. HAZ × Age interaction). Based on these analyses, we developed adjustment equations for handgrip strength that adjusted for HAZ or UALZ as previously described (Zemel et al. Citation2010, Citation2011). This two-step method first involves predicting D-HGZ or ND-HGZ with age- and sex-specific prediction equations using either HAZ or UALZ as follows:
(3)
(3)
where a and b are age- and sex-specific coefficients.
The size adjusted Handgrip Z is the difference between the age and sex specific Handgrip Z and the Predicted Handgrip Z calculated as follows:
(4)
(4)
Pearson correlation coefficients were determined using the “corr_svy” STATA command, a user-written command compatible with “svy” that is available for download via the “findit” command, to describe associations between handgrip strength and continuous pre-specified outcomes of interest while accounting for NHANES sample design. Multiple linear regression models were developed to investigate the effect of gender, self-identified race/ethnicity group, and body composition on handgrip strength. Interaction terms were included to assess for differences in the strength of associations between gender and racial/ethnic groups. Variance inflation factors of all response and predictor variables were checked to investigate for collinearity. Akaike information criterion were considered to inform selection of final models.
Results
Dominant and non-dominant handgrip reference curves
Descriptive characteristics of the NHANES sample population used to create handgrip reference curves are shown in , including the United States population weighted proportions of gender and self-identified race/ethnicity groups. Handgrip was assessed on 4290 participants, and DXA measurement of lean mass and fat mass was available on 76% (n = 3244) and 75% (n = 3219) of the NHANES sample, respectively. Characteristics of the 3209 participants with complete handgrip, body size, and DXA data are available elsewhere (Supplemental Table 1).
Table 1. Descriptive characteristics of the NHANES sample population used to create handgrip reference curves.
Smoothed reference percentiles for dominant and non-dominant handgrip and upper arm length in males and females aged 6–19.9 years are shown in and . In addition to the 50th percentile “M,” each table also provides the L and S values, which can be used to calculate Z-scores for individuals. Reference percentiles for handgrip according to age in tenths of a year are available elsewhere (Supplemental Tables 2 and 3). Reference curves illustrating the 5th, 50th, and 95th centiles for dominant and non-dominant handgrip in males and females are shown in . Males have noticeably greater handgrip strength then females from early adolescence onward, and the age-related increase plateaus in older females, whereas it continues to increase in older males. The difference between dominant and non-dominant handgrip increases with age and becomes increasingly variable as shown in .
Figure 2. Reference curves for dominant and non-dominant handgrip by gender (A) and difference between dominant and non-dominant handgrip with age (B).
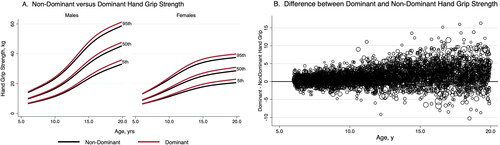
Table 2. Reference tables for dominant hand grip (A), non-dominant handgrip (B), and upper arm length (C) in male participants ages 6–19.9 years.
(B) Non-dominant handgrip, kg
(C) Upper arm length, cm
Table 3. Reference tables for dominant hand grip (A), non-dominant handgrip (B), and upper arm length (C) in female participants ages 6-19.9 years.
(A) Dominant handgrip, kg
(B) Non-dominant handgrip, kg
(C) Upper arm length, cm
Associations of anthropometry and body composition on handgrip Z-scores
Handgrip Z-scores were significantly associated with Z-scores for height, BMI, upper arm length, lean body mass index, appendicular lean soft tissue mass index, and fat mass index (). Among body composition variables, the correlations between handgrip Z-scores and ALSTMIZ were the highest (r = 0.54, p < .001 for ND-HGZ and D-HGZ). The correlations between handgrip Z-scores and FMIZ were the lowest (r = 0.17, p < .001 for both ND-HGZ and D-HGZ).
Table 4. Correlations between unadjusted and adjusted handgrip Z-scores, anthropometric, and body composition measures using data from 3209 NHANES participants with complete DXA data.
Using sex-stratified regression analyses with interaction terms for HAZ (or UALZ) × age (in whole year intervals), we developed equations to predict D-HGZ and ND-HGZ based on body size as described in EquationEquation 3(3)
(3) above. The prediction equations are shown in . The predicted Z-score from EquationEquation 3
(3)
(3) is used in EquationEquation 4
(4)
(4) to calculate a size adjusted Z score for handgrip strength which represents the difference between a child’s handgrip Z for age and the predicted Z based on their size. For example, for a 10 year old male with HAZ = 2.98 and D-HGZ = 1.58, his predicted D-HGZ is 1.60 [–0.248 + (.619 × 2.98)], and his HAZ-adjusted D-HGZ is −0.02 [1.58 − 1.60].
Table 5. Equations to predict D-HGZ and ND-HGZ based on body size as described in Equation 3 in text.
Group differences in handgrip Z-scores
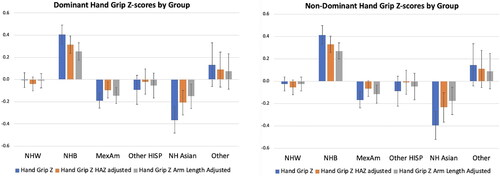
There were significant differences in handgrip Z-scores across gender and self-identified race/ethnicity groups. Compared to the non-Hispanic White group, the non-Hispanic Black group had significantly higher ND-HGZ and D-HGZ (p < .001 for both) while the Mexican American group had lower ND-HGZ and D-HGZ (p = .059 for ND-HGZ; p = .020 for D-HGZ) (). These group differences were attenuated when HAZ-adjusted and UALZ-adjusted ND-HGZ and D-HGZ were compared as shown in . When the interaction between gender and self-identified race/ethnicity group was tested, the non-Hispanic Black female group had higher D-HGZ (p = .012) and ND-HGZ (p = .061) compared to other groups. However, using HAZ-adjusted handgrip Z or UALZ-adjusted handgrip Z, this sex × group interaction was no longer significant. Moreover, in multivariate models, group differences in HAZ-adjusted ND-HGZ and D-HGZ were not significant when ALSTMIZ was included in the models, suggesting that group differences in handgrip strength are related to body size and composition.
Figure 3. Dominant and non-dominant handgrip Z-scores by race/ethnicity group.
Discussion
We generated nationally representative, smoothed, age- and gender-specific reference curves and percentiles for dominant and non-dominant handgrip strength in participants ages 6–20 years using NHANES data. These are the first smoothed percentile curves that can be used to calculate individual paediatric handgrip Z-scores. Handgrip Z-scores were associated with anthropometric and body composition parameters, strengthening the utility of handgrip strength as an accessible measurement of functional body composition. This study is a significant improvement over prior studies by its robust sample size drawn from two NHANES survey periods, consideration of hand dominance, incorporation of body size and composition data, and generation of smoothed percentile curves using sample weights to produce estimates representative of the U.S. population from which exact Z-scores can be calculated. These reference data will facilitate more accurate interpretation of handgrip strength in healthy children and those with chronic conditions at risk of muscle deficits.
Handgrip strength was consistently higher in males, similar to previous reports of gender differences in combined grip strength in the NHANES sample (Ervin et al. Citation2013, Citation2014; Perna et al. Citation2016; Laurson et al. Citation2017). The magnitude of the differences increased with age with male handgrip strength accelerating after approximately age 11. Age-related handgrip strength slowed in females after approximately age 14. These findings are consistent with prior reports of the effect of puberty on strength across multiple muscle groups in United States, European, and Australian populations (Bäckman et al. Citation1989; Beenakker et al. Citation2001; Eek et al. Citation2006; Catley and Tomkinson Citation2013; Ervin et al. Citation2014; Perna et al. Citation2016). However, while dominant and non-dominant handgrip strength both increased with age in males and females, the difference between hands increased with age and became increasingly variable, supporting our description of Z-scores by hand dominance, rather than combined handgrip strength as in prior studies.
We acknowledge that self-identified race and ethnicity are social constructs, yet embedded in these constructs are factors that may contribute to growth, maturation, body composition and muscle strength, including lifestyle differences, access to resources, and population ancestry. Therefore, we examined handgrip strength across self-identified race/ethnicity groups to provide a frame of reference for future studies and clinical evaluations that use these reference ranges. Importantly, the NHANES sample is based on a multi-stage probability sampling approach to reflect the United States demographics. Like McGrath et al. (Citation2020), we found significant differences between groups. Handgrip strength was highest in the group that self-identified as Black and lowest in the Mexican American group. D-HGZ was greatest in the non-Hispanic Black female group. However, use of size adjusted HGZ attenuated these group differences, and statistical models that adjusted for ALSTMIZ eliminated group differences. These findings demonstrate the impact of size and body composition on handgrip strength and emphasise that group differences are related to body size and composition characteristics that also vary between self-identified racial/ethnicity groups. This is useful information for interpreting handgrip Z-scores in population studies or clinical evaluations when body composition data are not available.
Handgrip strength was associated with body size, and we present a method for determining the degree to which a handgrip Z-score deviates from the expected values based on HAZ or UALZ. Height is a readily available measure in both research and clinical settings. It is a proxy measure of long bone length which is biomechanically relevant to strength measures. In children, height and age covary, yet for any given height, the age range can be fairly large (e.g. a height of 144 cm encompasses children who are at the 95th percentile at 9 years and at the 5th percentile at age 13 y). Consequently, height-based reference ranges may conflate prepubertal and pubertal children since they do not account for age. Therefore, we used height-for-age Z-score to account for the association of variability in body size on handgrip strength at any given age. This approach has the added advantage of partially accounting for maturational timing, since early maturing children will be taller than average at younger ages. Indeed, the attenuation of group differences in handgrip strength when HAZ-adjusted Z-scores were used is consistent with group differences both in size and maturational timing. Of note, we also presented body size-adjusted handgrip Z-score using UALZ with the expectation that a more specific and proximal measure of long bone length would be better than HAZ in accounting for group differences in handgrip strength, given the expected differences in body proportions between racial/ethnicity groups.
Muscle size is a major determinant of strength outcomes. We examined the association of LBMIZ and ALSTMIZ with handgrip Z-score. LBMIZ includes all lean tissues in the body including organs, whereas ALSTMIZ is based on the skeletal muscle in the arms and legs, which should be more relevant to a muscle strength outcome. Indeed, we found that the correlation coefficients with handgrip Z were higher for ALSTMIZ compared to LBMIZ. In addition, when ALSTMIZ was included in multivariate models, the differences in handgrip Z-scores among self-identified race/ethnicity group were not significant. In contrast, the association of FMIZ with handgrip Z was very low. These findings suggest that handgrip could be a surrogate for metabolically active skeletal muscle and a representation of functional body composition. While prior studies associated handgrip strength with body size (height, weight, BMI) (Laurson et al. Citation2017; Kocher et al. Citation2019; McGrath et al. Citation2020), weight and BMI may conceal differences in fat and lean mass distribution in certain self-identified race/ethnicity groups (Harsha et al. Citation1978; Schutte et al. Citation1984; Goran et al. Citation1997; Nelson and Barondess Citation1997; Lu et al. Citation2011; Sousa et al. Citation2013; Weber et al. Citation2013; Marwaha et al. Citation2014) and in chronic disease populations. Associations between handgrip strength and lean mass may be important in assessment of paediatric populations in which lean mass deficits (surrogates for skeletal muscle deficits) are associated with functional limitations (Avitabile et al. Citation2014, Citation2018, Citation2021, Citation2022). Future studies may explore handgrip Z-score as a marker of functional health status and potential clinical trial target in children with chronic disease.
Limitations
There are some important limitations to these results. The NHANES data are cross-sectional, preventing us from assessing changes in handgrip with growth or lean body mass accrual. Additionally, the body composition analyses were only performed on the subset of patients with both handgrip and DXA data; however, this is the largest nationally representative sample of children with these data and provide useful reference ranges. Finally, we could not assess the effect of puberty or nutritional status on handgrip,both important influences.
In conclusion, we have generated age- and gender-specific reference curves and smoothed percentiles for dominant and non-dominant handgrip strength in NHANES participants ages 6–20 years. Handgrip Z-scores differed among self-identified racial/ethnicity groups and were associated with body size and body composition. Generating individual level Z-scores from these data will be helpful to clinicians and researchers studying handgrip strength in healthy children and those with chronic conditions that threaten muscle health.
Supplemental Material
Download Zip (802.2 KB)Disclosure statement
No potential conflict of interest was reported by the author(s).
Data availability statement
The data that support the findings of this study are openly available from the Centres for Disease Control and Prevention (CDC), National Centre for Health Statistics (NCHS). National Health and Nutrition Examination Survey Data. Hyattsville, MD: U.S. Department of Health and Human Services, Centres for Disease Control and Prevention, 2011–2014, https://wwwn.cdc.gov/nchs/nhanes/continuousnhanes/overview.aspx?BeginYear=2011 and https://wwwn.cdc.gov/nchs/nhanes/continuousnhanes/overview.aspx?BeginYear=2013.
Additional information
Funding
References
- Atlantis E, Martin SA, Haren MT, Taylor AW, Wittert GA, Members of the Florey Adelaide Male Ageing Study. 2009. Inverse associations between muscle mass, strength, and the metabolic syndrome. Metabolism. 58(7):1–11. doi: 10.1016/j.metabol.2009.02.027.
- Avitabile CM, Goldberg DJ, Leonard MB, Wei ZA, Tang E, Paridon SM, Yoganathan AP, Fogel MA, Whitehead KK. 2018. Leg lean mass correlates with exercise systemic output in young Fontan patients. Heart. 104(8):680–684. doi: 10.1136/heartjnl-2017-311661.
- Avitabile CM, Leonard MB, Zemel BS, Brodsky JL, Lee D, Dodds K, Hayden-Rush C, Whitehead KK, Goldmuntz E, Paridon SM, et al. 2014. Lean mass deficits, vitamin D status and exercise capacity in children and young adults after Fontan palliation. Heart. 100(21):1702–1707. doi: 10.1136/heartjnl-2014-305723.
- Avitabile CM, McBride MG, Harris MA, Whitehead KK, Fogel MA, Paridon SM, Zemel BS. 2022. Skeletal muscle deficits are associated with worse exercise performance in pediatric pulmonary hypertension. Front Pediatr. 10:1025420. doi: 10.3389/fped.2022.1025420.
- Avitabile CM, Saavedra S, Sivakumar N, Goldmuntz E, Paridon SM, Zemel BS. 2021. Marked skeletal muscle deficits are associated with 6-minute walk distance in paediatric pulmonary hypertension. Cardiol Young. 31(9):1426–1433. doi: 10.1017/S1047951121000342.
- Bäckman E, Odenrick P, Henriksson KG, Ledin T. 1989. Isometric muscle force and anthropometric values in normal children aged between 3.5 and 15 years. Scand J Rehabil Med. 21(2):105–114. doi: 10.2340/165019778921105114.
- Beenakker EA, van der Hoeven JH, Fock JM, Maurits NM. 2001. Reference values of maximum isometric muscle force obtained in 270 children aged 4–16 years by hand-held dynamometry. Neuromuscul Disord. 11(5):441–446. doi: 10.1016/s0960-8966(01)00193-6.
- Cadore EL, Pinto RS, Bottaro M, Izquierdo M. 2014. Strength and endurance training prescription in healthy and frail elderly. Aging Dis. 5(3):183–195. doi: 10.14336/AD.2014.0500183.
- Catley MJ, Tomkinson GR. 2013. Normative health-related fitness values for children: analysis of 85347 test results on 9-17-year-old Australians since 1983. Br J Sports Med. 47(2):98–108. doi: 10.1136/bjsports-2011-090218.
- Cole TJ, Green PJ. 1992. Smoothing reference centile curves: the LMS method and penalized likelihood. Stat Med. 11(10):1305–1319. doi: 10.1002/sim.4780111005.
- de Koning L, Warnink-Kavelaars J, van Rossum M, Limmen S, Van der Looven R, Muiño-Mosquera L, van der Hulst A, Oosterlaan J, Rombaut L, Engelbert R, on behalf of the Pediatric Heritable Connective Tissue Disorders Study Group. 2023. Physical activity and physical fitness in children with heritable connective tissue disorders. Front Pediatr. 11:1057070. doi: 10.3389/fped.2023.1057070.
- de Souza LV, de Meneck F, Parizotto GP, Franco M. 2022. Low birth weight and its relation to physical fitness parameters in children: its negative effect on muscle strength and cardiorespiratory endurance. Am J Hum Biol. 34(1):e23595.
- Dougherty KA, Schall JI, Rovner AJ, Stallings VA, Zemel BS. 2011. Attenuated maximal muscle strength and peak power in children with sickle cell disease. J Pediatr Hematol Oncol. 33(2):93–97. doi: 10.1097/MPH.0b013e318200ef49.
- Eek MN, Kroksmark AK, Beckung E. 2006. Isometric muscle torque in children 5 to 15 years of age: normative data. Arch Phys Med Rehabil. 87(8):1091–1099. doi: 10.1016/j.apmr.2006.05.012.
- Ervin RB, Fryar CD, Wang C-Y, Miller IM, Ogden CL. 2014. Strength and body weight in US children and adolescents. Pediatrics. 134(3):e782-789–e789. doi: 10.1542/peds.2014-0794.
- Ervin RB, Wang CY, Fryar CD, Miller IM, Ogden CL. 2013. Measures of muscular strength in U.S. children and adolescents, 2012. NCHS Data Brief. 139(139):1–8.
- Faigenbaum AD, Lloyd RS, Myer GD. 2013. Youth resistance training: past practices, new perspectives, and future directions. Pediatr Exerc Sci. 25(4):591–604. doi: 10.1123/pes.25.4.591.
- Flegal KM. 1999. Curve smoothing and transformations in the development of growth curves. Am J Clin Nutr. 70(1):163S–5S. doi: 10.1093/ajcn/70.1.163s.
- Goran MI, Nagy TR, Treuth MS, Trowbridge C, Dezenberg C, McGloin A, Gower BA. 1997. Visceral fat in white and African American prepubertal children. Am J Clin Nutr. 65(6):1703–1708. doi: 10.1093/ajcn/65.6.1703.
- Harsha DW, Frerichs RR, Berenson GS. 1978. Densitometry and anthropometry of black and white children. Hum Biol. 50(3):261–280.
- Hogan J, Schneider MF, Pai R, Denburg MR, Kogon A, Brooks ER. 2020. Grip strength in children with chronic kidney disease. Pediatr Nephrol. 35(5):891–899.
- Johnson CL, Dohrmann SM, Burt VL, Mohadjer LK. 2014. National Health and Nutrition Examination Survey: Estimation Procedures, 2011-2014. Vital Health Stat 2. 162(162):1–33. 2.
- Kocher MH, Oba Y, Kimura IF, Stickley CD, Morgan CF, Hetzler RK. 2019. Allometric grip strength norms for American children. J Strength Cond Res. 33(8):2251–2261. doi: 10.1519/JSC.0000000000002515.
- Kuczmarski RJ, Ogden CL, Grummer-Strawn LM, Flegal KM, Guo SS, Wei R, Mei Z, Curtin LR, Roche AF, Johnson CL. 2000. CDC growth charts: United States. Adv Data. 314(314):1–27.
- Lad UP, Satyanarayana P, Shisode-Lad S, Siri CC, Kumari NR. 2013. A study on the correlation between the body mass index (BMI), the body fat percentage, the handgrip strength and the handgrip endurance in underweight, normal weight and overweight adolescents. J Clin Diagn Res. 7:51–54.
- Laurson KR, Saint-Maurice PF, Welk GJ, Eisenmann JC. 2017. Reference curves for field tests of musculoskeletal fitness in U.S. children and adolescents: the 2012 NHANES National Youth Fitness Survey. J Strength Cond Res. 31(8):2075–2082. doi: 10.1519/JSC.0000000000001678.
- Lim SH, Kim YH, Lee JS. 2019. Normative data on grip strength in a population-based study with adjusting confounding factors: sixth Korea National Health and Nutrition Examination Survey (2014-2015). Int J Environ Res Public Health. 16(12):2235. doi: 10.3390/ijerph16122235.
- Little M. 2017. Grip strength and body composition in Turkana pastoralist children and adolescents. Am J Hum Biol. 29(2):e22922.
- Lu H, Fu X, Ma X, Wu Z, He W, Wang Z, Allison DB, Heymsfield SB, Zhu S. 2011. Relationships of percent body fat and percent trunk fat with bone mineral density among Chinese, black, and white subjects. Osteoporos Int. 22(12):3029–3035. doi: 10.1007/s00198-010-1522-9.
- Marwaha RK, Tandon N, Garg MK, Narang A, Mehan N, Bhadra K. 2014. Normative data of body fat mass and its distribution as assessed by DXA in Indian adult population. J Clin Densitom. 17(1):136–142. doi: 10.1016/j.jocd.2013.01.002.
- McGrath R, Hackney KJ, Ratamess NA, Vincent BM, Clark BC, Kraemer WJ. 2020. Absolute and body mass index normalized handgrip strength percentiles by gender, ethnicity, and hand dominance in Americans. Adv Geriatr Med Res. 2(1):e200005.
- Meyer M, Wang Y, Brudy L, Häcker A-L, Schulz T, Weberruss H, Oberhoffer R, Ewert P, Müller J. 2022. Impaired grip strength in children with congenital heart disease. Arch Dis Child. 107(1):47–51. doi: 10.1136/archdischild-2020-319955.
- National Center for Health Statistics. 2011a. National Health and Nutrition Examination Survey: muscle Strength Procedures Manual. https://wwwn.cdc.gov/nchs/data/nhanes/2011-2012/manuals/muscle_strength_proc_manual.pdf. (Accessed 26 April 2022).
- National Center for Health Statistics. 2011b. National Health and Nutrition Examination Survey: anthropometry Procedures Manual. https://wwwn.cdc.gov/nchs/data/nhanes/2011-2012/manuals/Anthropometry_Procedures_Manual.pdf. (Accessed 8/30/23).
- Nelson DA, Barondess DA. 1997. Whole body bone, fat and lean mass in children: comparison of three ethnic groups. Am J Phys Anthropol. 103(2):157–162. doi: 10.1002/(SICI)1096-8644(199706)103:2<157::AID-AJPA2>3.0.CO;2-R.
- Omar MTA, Alghadir A, Al Baker S. 2015. Norms for hand grip strength in children aged 6-12 years in Saudi Arabia. Dev Neurorehabil. 18(1):59–64. doi: 10.3109/17518423.2014.967878.
- Perna FM, Coa K, Troiano RP, Lawman HG, Wang C-Y, Li Y, Moser RP, Ciccolo JT, Comstock BA, Kraemer WJ. 2016. Muscular grip strength estimates of the US population from the National Health and Nutrition Examination Survey 2011-2012. J Strength Cond Res. 30(3):867–874. doi: 10.1519/JSC.0000000000001104.
- Schoeller DA, Tylavsky FA, Baer DJ, Chumlea WC, Earthman CP, Fuerst T, Harris TB, Heymsfield SB, Horlick M, Lohman TG, et al. 2005. QDR 4500A dual-energy X-ray absorptiometer underestimates fat mass in comparison with criterion methods in adults. Am J Clin Nutr. 81(5):1018–1025. doi: 10.1093/ajcn/81.5.1018.
- Schutte JE, Townsend EJ, Hugg J, Shoup RF, Malina RM, Blomqvist CG. 1984. Density of lean body mass is greater in blacks than in whites. J Appl Physiol Respir Environ Exerc Physiol. 56(6):1647–1649. doi: 10.1152/jappl.1984.56.6.1647.
- Sivagnanasunderam M, Gonzalez DA, Bryden PJ, Young G, Forsyth A, Roy EA. 2015. Handedness throughout the lifespan: cross-sectional view on sex differences as asymmetries change. Front Psychol. 5:1556. doi: 10.3389/fpsyg.2014.01556.
- Smith JJ, Eather N, Morgan PJ, Plotnikoff RC, Faigenbaum AD, Lubans DR. 2014. The health benefits of muscular fitness for children and adolescents: a systematic review and meta-analysis. Sports Med. 44(9):1209–1223. doi: 10.1007/s40279-014-0196-4.
- Sousa MDGB, Pinheiro MM, Szejnfeld VL, Castro CHM. 2013. Body composition parameters in healthy Brazilian women differ from white, black, and Hispanic American women reference range. J Clin Densitom. 6(3):360–367.
- Stasinopoulos DM, Rigby RA. 2007. Generalized additive models for location scale and shape (GAMLSS) in R. J Statistical Software. 23(7):1–46.
- Wang YC, Bohannon RW, Kapellusch J, Washburn D, Li X, Yen SC, Rahman MH. 2019. Between-side differences in hand-grip strength across the age span: findings from 2011-2014 NHANES and 2011 NIH Toolbox studies. Laterality. 24(6):697–706. doi: 10.1080/1357650X.2019.1604727.
- Wang YC, Bohannon RW, Li X, Sindhu B, Kapellusch J. 2018. Hand-grip strength: normative reference values and equations for individuals 18 to 85 years of age residing in the United States. J Orthop Sports Phys Ther. 48(9):685–693. doi: 10.2519/jospt.2018.7851.
- Weber DR, Moore RH, Leonard MB, Zemel BS. 2013. Fat and lean BMI reference curves in children and adolescents and their utility in identifying excess adiposity compared with BMI and percentage body fat. Am J Clin Nutr. 98(1):49–56. doi: 10.3945/ajcn.112.053611.
- Yuki A, Tamase Y, Nakayama M. 2023. Association between decreased grip strength in preschool children and the COVID-19 pandemic: an observational study from 2015 to 2021. J Physiol Anthropol. 42(1):4. doi: 10.1186/s40101-023-00321-8.
- Zemel BS. 2022. Body Composition during Growth and Development. Human Growth and Development, 3rd Ed. Cameron, N and Schell, L (eds.). Amsterdam, Netherlands. Elsevier Publishing Company; 2022. p. 517–545.
- Zemel BS, Kalkwarf HJ, Gilsanz V, Lappe JM, Oberfield S, Shepherd JA, Frederick MM, Huang X, Lu M, Mahboubi S, et al. 2011. Revised reference curves for bone mineral content and areal bone mineral density according to age and sex for black and non-black children: results of the bone mineral density in childhood study. J Clin Endocrinol Metab. 96(10):3160–3169. doi: 10.1210/jc.2011-1111.
- Zemel BS, Leonard MB, Kelly A, Lappe JM, Gilsanz V, Oberfield S, Mahboubi S, Shepherd JA, Hangartner TN, Frederick MM, et al. 2010. Height adjustment in assessing dual energy x-ray absorptiometry measurements of bone mass and density in children. J Clin Endocrinol Metab. 95(3):1265–1273. doi: 10.1210/jc.2009-2057.
- Zemel BS, Shepherd JA, Grant SFA, Lappe JM, Oberfield SE, Mitchell JA, Winer KK, Kelly A, Kalkwarf HJ. 2023. Reference ranges for body composition indices by dual energy X-ray absorptiometry from the bone mineral density in Childhood Study Cohort. Am J Clin Nutr. 118(4):792–803. doi: 10.1016/j.ajcnut.2023.08.006.