
 ?Mathematical formulae have been encoded as MathML and are displayed in this HTML version using MathJax in order to improve their display. Uncheck the box to turn MathJax off. This feature requires Javascript. Click on a formula to zoom.
ABSTRACT
Persistent gender gaps characterise labour markets in many African countries. Utilising Eswatini’s first three labour market surveys (conducted in 2007, 2010, and 2013), this paper provides first systematic evidence on the country’s gender gaps in employment and earnings. We find that women have notably lower employment rates and earnings than men, even though the global financial crisis had a less negative impact on women than it had on men. Both unadjusted and unexplained gender earnings gaps are higher in self-employment than in wage employment. Tertiary education and urban location account for a large part of the gender earnings gap and mitigate high female propensity to self-employment. Our findings suggest that policies supporting female higher education and rural-urban mobility could reduce persistent inequalities in Eswatini’s labour market outcomes as well as in other middle-income countries in southern Africa.
1. Introduction
Countries cannot develop sustainably and reach their potential unless women, who represent half of the population, have equal access to education and productive opportunities as do men. Beyond the fairness aspect, the academic and policy-oriented literature has emphasised the economic arguments for gender equality, underscoring that women bring into the workforce different skills and perspectives that complement those of men (Ostry et al., Citation2018).Footnote1 With the analysis pointing to economic benefits of closing gender gaps in labour markets, policymakers in Africa (and elsewhere) have strived to promote inclusive growth and female economic empowerment.
Today most Sub-Saharan Africa (SSA) policymakers view gender equality as a key priority for sustainable development. Yet many SSA countries, including Eswatini, continue to experience sizeable gender gaps. Eswatini is among the bottom quarter of countries globally on the gender inequality index, having ranked 148 out of 189 in 2019 (UNDP, Citation2020). Women in Eswatini have relatively low labour force participation as well as lower access to resources and economic opportunities than men. They are also less represented in government leadership (Tsododo, Citation2014). Moreover, according to the UNICEF, Eswatini still has the highest HIV prevalence in the world with a prevalence rate of 27% among adults (15–59), with women being more impacted.Footnote2
The academic literature links lifting restrictions on female economic participation with higher growth. Specifically, using cross-country and panel regressions, Klasen (Citation2002) showed that gender inequality in education reduces long-term growth through lower investment in human and physical capital. Extending this analysis, Klasen & Lamanna (Citation2003) posited that gender gaps in employment tend to have bigger effect than gaps in education. Stotsky (Citation2006) documented that reducing gender gaps may not only promote economic growth, but contribute to macroeconomic stability. Utilising a broader measure of inequality, Amin et al. (Citation2015) showed that in low-income countries greater gender inequality is associated with lower economic growth. Hakura et al. (Citation2016) confirmed this finding and showed that policies that raise the opportunities of low-income households and women to participate in economic activities can contribute to alleviating inequalities.
In contrast, Ruiters & Charteris (Citation2020) found that in South Africa, higher development was associated with more equal female labour force participation, but gender equality in labour force participation was not linked with higher economic growth. They have concluded that since development is a slow and long-term process, the government should intervene directly in the labour market to support higher female labour force participation. Such intervention would need to be accompanied by measures to incentivize women to enter technical fields and also provide child-care facilities.
Several African countries have made strides in some areas of gender inequality (e.g. Rwanda and South Africa on female representation in middle-management, Liberia on legal protection of women). However, overall progress in the region has stalled in the past several years in most areas, including in the labour market (McKinsey, Citation2019). In this paper, we document critical gender gaps and their trends over time in the labour market in Eswatini, a small middle-income country which has one of the highest unemployment rates and one of the lowest female labour force participation rates in southern Africa (SADC, Citation2018).
Labour market survey data from African countries are scarce; until several years ago none was available for Eswatini. The analysis in this paper utilises the first three Eswatini Labor Force Surveys from 2007, 2010, and 2013 (LFS Citation2007, Citation2010, Citation2013), allowing for identification of trends between 2007 and 2013, which includes the global financial crisis. Our cross-sectional dataset provides, among other things, information on human capital of individuals as well as on personal and job characteristics, including working hours or professional field. This enables us to explore, for example, whether women earn less than men because of their productivity-related attributes or because they work in different sectors. Besides the labour force surveys, we utilise in Section 2 databases of the International Monetary Fund (IMF), the World Bank and the United Nations (UN). The purpose is to conduct regional comparisons and to assess Eswatini’s labour market outcomes in the context of overall macroeconomic developments.
We statistically investigate the drivers of the unequal labour market outcomes and draw policy recommendations. We explore the hypothesis that women in Eswatini have higher odds than men of being self-employed rather than wage employees in a multivariate logit regression. To quantify the factors behind the gender earnings gap we utilise an Oaxaca–Blinder decomposition (Blinder, Citation1973; Oaxaca, Citation1973) of male and female earnings. We find that while women in Eswatini are over-represented among self-employed, their returns on this activity are markedly lower than those of men, suggesting that women opt for self-employment out of necessity rather than to pursue profitable entrepreneurial opportunities.
This paper thus contributes to the literature on labour markets in southern Africa with the first systematic analysis of the gender gaps in the labour market in Eswatini. By shedding light on some factors contributing to the gender disparities in the labour market, the paper provides basis for evidence-based policies. Given the availability of data during 2007–13, it also illustrates the impact of the global financial crisis on the labour market of a small, middle-income and land-locked economy. It is thus relevant for other middle-income countries in southern Africa, including poorer regions of South Africa, which aim to reach inclusive growth amid volatile fiscal revenues, high unemployment and income inequality (Jauch, Citation2011). In the twenty-first century, a series of shocks such as the global financial crisis, the commodity price shock and recently the COVID-19 pandemic amplified inequalities in labour markets, including alongside the gender dimension (World Bank, Citation2012; Wenham et al., Citation2020; International Labour Organization, Citation2020). With gender inequality in economic opportunities on the global policy agenda, the paper can also inform policy debates on addressing gender disparities in Africa and other developing regions.
The rest of this paper is organised as follows. Section 2 summarises key facts about the gender gaps in the Eswatini’s labour market outcomes. Section 3 statistically investigates drivers of female self-employment as well as contributors to the gender gap in wages and income from self-employment. Section 4 concludes and draws policy recommendations.
2. Key trends in the labour market outcomes of women
This section analyses the macroeconomic context and the key features of the labour market in Eswatini that impact women based on the country’s first three Eswatini’s labour force surveys (2007, 2010 and 2013) collected by the Eswatini Statistical Office. The survey data is based on representative samples and contains information such as status of employment, hours of work, earnings as well as a socio-economic background of respondents. To analyse macroeconomic trends, we draw on data of the IMF, World Bank and UN.
2.1. Macroeconomic context
Eswatini is a small, lower-middle-income country in southern Africa, with an area of approximately 17,360 km² and a population of about 1.2 million. According to the World Bank indicators, Eswatini relies on South Africa for 85% of its imports and 60% of its exports. Over the past twenty years, the country has exhibited a volatile, but mostly low economic growth. Despite being classified as a middle-income country, the World Bank estimates that about 40% of the population lived below the poverty line of $1.90 (PPP) a day in 2017, making Eswatini more akin to a low-income country.Footnote3
Eswatini is part of a Common Monetary Area, together with South Africa, Lesotho, and Namibia. While this arrangement helps the country manage inflation, it reduces room for a monetary policy response to shocks and makes fiscal policy the primary counter-cyclical tool available. However, macroeconomic policy has been restricted by low budgetary space due to high spending, with a large share of outlays going into public sector wages. The government budget relies heavily on revenues from the Southern Africa Customs Union (SACU), which hampers the effective implementation of counter-cyclical policies.
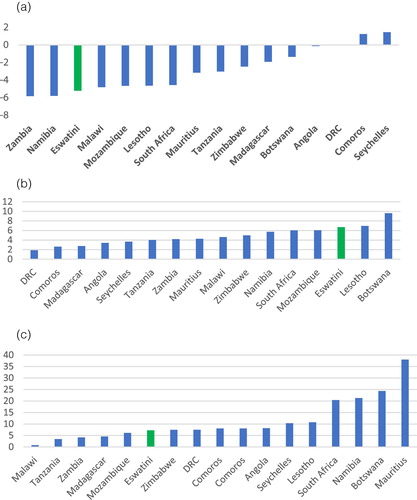
In the past ten years, the government has periodically experienced liquidity pressures, forcing it to borrow from the central bank or making abrupt expenditure cuts including in priority capital and social areas. Domestic revenue mobilisation capacity remains low, as evidenced by the lowest total revenues-to-GDP ratio in the SACU group, with majority revenues (and foreign exchange receipts) coming from the SACU. Despite the high outlays on education (over 7% of GDP and around 20% of total fiscal expenditures), gross tertiary enrolment rates remain relatively low ().
Figure 1. Eswatini’s fiscal challenges. (a) Fiscal balances in SADC members, average for 2010–19 (% of GDP). (b) Government expenditures on education in SADC members (% of GDP). (c) Gross tertiary enrolment rates in SADC members (%), average of the last 10 years. Source: World Bank Development Indicators and IMF World Economic Outlook databases.
Note: DRC for Democratic Republic of Congo.
2.2. High and rising female unemployment
Eswatini continues to have one of the highest female unemployment rates in the Southern African Development Community (SADC) and on the continent (). Even though the female unemployment started from a higher level than the unemployment rate of men, it rose during 2007–13 by five percentage points, notably more than the unemployment rate of men (). As a result, the gender gap in unemployment that existed before the global financial crisis has widened. These developments, together with persistently high unemployment in recent years, suggest that the structural factors play an important role.
Figure 2. Female unemployment rates in SADC members. 2014–19 average (% of female labour force). Source: World Bank Development Indicators, ILO estimates.
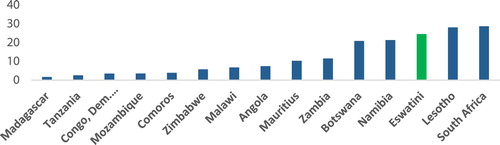
Table 1. Overall labour market outcomes in Eswatini, by gender, 2007, 2010 and 2013.
Further, if we count discouraged workers among the unemployed, a gap in unemployment emerges already among young men and women, which widens further for young adults (ages 25–34). Moreover, youth unemployment rates are particularly high if we include the discouraged workers (i.e. those who left the labour market because they did not see prospects for finding a job) among the unemployed. With this perspective, more than two-thirds of young women (ages 15–24) in Eswatini are unemployed ().
Table 2. Unemployment including discouraged workers, (% of relevant labour force).
Women with no or only primary education have much lower employment rates than men (27% employment rate for women and 39% for men in 2013) and are also over-represented among the unemployed relative to their more educated counterparts (). Moreover, a lower difference between employment rates among primary and secondary school graduates among women (5 percentage points for women vs. 9 percentage points for men in 2013) points to lower rates of return to high school education for women than for men.
Table 3. Employment (% of work. age pop. with relevant education), by gender.
The long duration of unemployment is another characteristic of the Eswatini labour market, especially among women. In 2010, a staggering 59% of women of working age were available for work for more than two years (Eswatini Ministry of Labor, Citation2011).
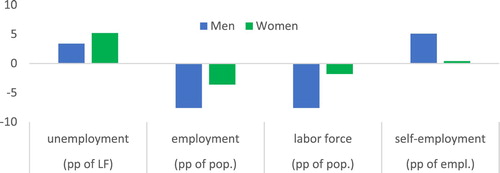
Regarding the transmission of the global financial crisis to the Eswatini’s labour market (mostly through South Africa), shows that the impact was more sizeable on men than women. In particular, the total employment rate for men showed a significant decline, while the structure of employment shifted towards self-employment.
Figure 3. Changes in labour market outcomes, in percentage points, from 2007 to 2013. Source: Authors’ calculations based on the Eswatini Labor Force Surveys.
Note: pp = percentage points.
2.3. Female labour force participation and labour market outcomes
Regarding the transmission of the global financial crisis to the Eswatini’s labour market (mostly through South Africa), shows that overall the impact was more sizeable on men than on women. In particular, the total employment rate for men showed a significant decline, while the structure of employment shifted towards self-employment.
Despite some reduction in the gender gap, Eswatini’s women still post both higher levels of unemployment and lower labour force participation than men. The female labour market outcomes are also weaker than those of other countries in the region, with Eswatini having the lowest female labour force participation in the SADC, according to the SADC Gender Protocol Barometer 2018. In 2018, the country also recorded the widest gender gap in the labour force participation in the SADC, pointing to women-specific barriers to labour market participation (43% labour force participation for women and 67% for men).
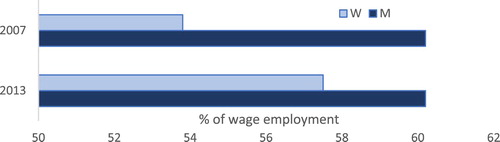
Women’s labour market outcomes are less favourable than those of men also in terms of the quality of jobs and in particular the security of jobs. Specifically, a lower share of women in wage employment than men have formal contracts, although the gender gap has narrowed during 2007–13 (). The small percentage of women with formal contracts implies that women’s jobs are not only less secure but also less protected by the labour code or less protected against health risks than those of men. These differences start emerging already among the youth (Brixiová & Kangoye, Citation2014).
Figure 4. Security of wage employment, by gender, 2007 and 2013. Share of wage employees with formal contract (%). Source: Authors’ calculations based on the Eswatini Labor Force Surveys.
Relatedly, women are less likely than men to work in relatively stable sectors such as the formal sector than in the informal sector. These disparities in employment quality between men and women emerge already among youth and widen with age. For young adult women (ages 15–24), the employment gap in the private sector employment is, in part, compensated by a higher share of women working in the public sector. Still, these ratios are reversed in the 35+ age group ().
Table 4. Sectoral distribution of employment, by gender and age, 2007 (% of total employment in each age category).
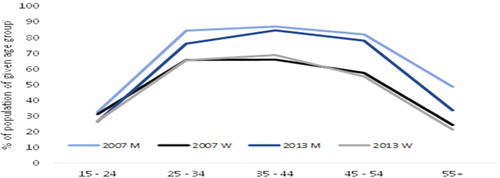
As in many SSA countries, women’s labour force participation in Eswatini is below that of men in most age categories (). Since the labour force participation has declined between 2007 and 2013 for men but not for women, the gender gap has somewhat narrowed. This is in part due to the nature of the shock exhorted by the crisis, where sectors with a high share of men in employment (e.g. manufacturing) were particularly impacted. However, according to the SADC Gender Protocol 2018 Barometer, the gender gap has widened again since then, and in 2018 may have exceeded the 2007 level (SADC, Citation2018).
Figure 5. Labour force participation in 2007 and 2013, by gender (% of population). Source: Authors’ calculations based on the Eswatini Labor Force Surveys.
2.4. Rising female migration
Besides discouragement, the low female labour force participation may be partly driven by the emigration of Eswatini citizens abroad, especially to South Africa, and remittances these migrants send back home. As shown in , in 2020, Eswatini received an estimated $98 million of official remittances (equivalent to 2.7% of its GDP), making it the third largest recipient of remittances in terms of their share in GDP in the region, after Lesotho (20.6%), and Zimbabwe (9.9%). Furthermore, these official remittances inflows do not account for informal remittances.
Table 5. Official remittance inflows to Eswatini and other countries in the region.
The lack of economic opportunities resulting in high unemployment rates has led to a relatively high migration from Eswatini. The 2018 Afrobarometer survey indicates that about a quarter of Eswatini citizens have emigrated abroad in recent years and that another similar share intend to do so.Footnote4 The driving reason is the job search. For several decades, South Africa has been the primary destination of Eswatini’s job-searching migrants (Harington et al., Citation2004). For low-skilled and semi-skilled male migrants, working in the mining industry was the main path to formal employment in South Africa. These migrants were recruited under a temporary labour scheme, i.e. on a short-term and contractual basis, which means they would often return home.
Eswatini’s low female labour force participation could also be related to remittances. Several studies found that remittances reduce labour force participation in receiving countries.Footnote5 More remittances received would lead to higher reservation wage of the recipients and to lower probability that they would participate in the labour force (Azizi, Citation2018).Footnote6
In the last decade, trade unions were able to negotiate more flexible contracts for migrant workers from Eswatini in South Africa. As a result, migration rose, with migrants returning home more frequently (therefore still being counted in the country’s working age population and the labour force). Given the high female unemployment and that Eswatini’s labour market provides even fewer job opportunities than that of South Africa, Swazi female emigration to South Africa exceeds the rate of typical SSA countries. Even though half of the female migrants from Eswatini to South Africa have tertiary education, most are employed in services such as retail trade in the informal sector (World Bank, Citation2016).
3. An analysis of gender gaps in self-employment, self-employment earnings and formal wages
This section statistically investigates drivers of female self-employment, using logit regressions, as well as factors behind the gender gap in wages and income from self-employment, through Oaxaca–Blinder decomposition.
3.1. Gender disparities in self-employment
Women in Eswatini, especially those with less than tertiary education, are disproportionally represented among self-employed (). This applies especially to women with primary or no education: while overall self-employment accounted for about 30% of total female employment, for women with primary or lower education, the shares were 37.3% and 42.8% in 2007 and 2013, respectively. The increased share of self-employment among less educated women in 2013 reflected both the adjustment to the shock of the global financial crisis and structural factors, in particular limited job creation in the formal sector.
Table 6. Share of employed with tertiary education, by gender and type of employment.
We explore further the drivers of female self-employment in the logit regressions (), which estimates the effect of the explanatory variables on the odds that people will become self-employed rather than wage employees. It takes the following form:
(1)
(1)
The vector of personal characteristics comprises gender, age, and citizenship, while the household-related vector contains dummy variables indicating whether the person is head of the household and their marital status. The vector of mobility-related characteristics captures whether the person lives in an urban area or in Manzini (the country’s business centre) and if they have been living in the location since birth. The hypothesis is that people who moved into the area (migrants) are more likely to be self-employed, in line with Harris-Todaro labour mobility theory (Fields, Citation2007). The vector of educational characteristics includes dummy variables for secondary and tertiary education. All variables are defined in Appendix 1 while the key descriptive statistics are in Appendix 2.
We find that being a woman (variable gender is set to 1) has a positive and statistically significant association with the odds of self-employment relative to wage employment (). Several personal characteristics, namely age, being married, and being a foreign national also have a positive and statistically significant association with self-employment. In contrast, secondary and especially tertiary education as well as living in an urban area enter negatively in all the regression specifications, which is associated with lower odds of being self-employed.Footnote7 Put differently, educated women are more sought-after employees, while living in urban areas increases opportunities for wage employment.
Table 7. Gender and self-employment (logit regressions; dependent var. is self-employed = 1).
Our findings that education reduces odds of self-employment are similar to those of Dieterich et al. (Citation2016) who, utilising household survey data, analyse drivers of gender gaps in five SSA countries. They illustrate that education can serve as an escape route from low productivity agricultural employment and poverty towards wage employment in the formal sector. However, household responsibilities that arise for married women may reduce wage for women with higher education.Footnote8 The authors also found that while self-employment in household enterprises offers women another escape venue, the women’s gains in income per capita are below those of men. They underscore the need for analysing labour markets beyond the aggregate figures and examine in detail self-employment.
3.2. Gender gaps in wage and self-employment earnings
Besides gaps in employment, unemployment and labour force participation, gender gaps persist in earnings. In this section, we explore the gender-based differences in income from wage employment and self-employment.
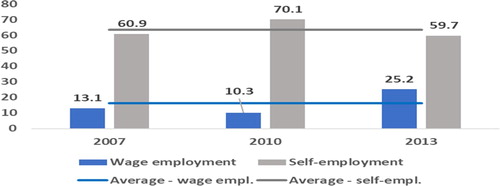
The labour force data shows that the gap between the average wages from employment among men and women at the economy-wide level amounted to about 13% (of average men’s wages) in 2007 and increased to 25% by 2013. The income gap is more pronounced for the self-employed, with female income amounting on average to less than 40% of male income (). Since a larger share of women than men are discouraged workers, as evidenced in and presented earlier in this paper, the unadjusted figure underestimates the actual income gap from the perspective of women’s earnings potential.
Figure 6. Gender gaps in earnings, 2007, 2010 and 2013 (in % of male income). Source: Authors’ calculations based on the Eswatini Labor Force Surveys.
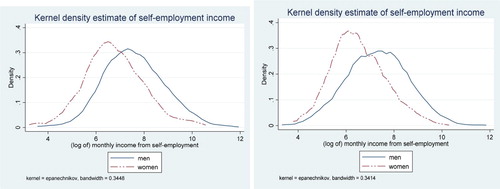
Regarding the distribution of the gender gap across different levels of income, and show nonparametrically estimated densities of log wage and log income from self-employment for men and women aged 15 years and higher, respectively. While the gender wage gap is relatively narrow at high-income ranges (), it is more sizeable in low paying sectors such as trade or social services, where women mostly work (Eswatini Ministry of Labour and Social Security, Citation2014). In traditional high-earning fields such as finance, men earn more than women. In contrast, women’s earnings exceed those of men in transport and construction, but those are fields where female presence accounts for small shares of total employment. , which focuses on self-employment income, also reveals an unadjusted income gap in both 2007 and 2013. In contrast to wage employment, the gap is present throughout the entire distribution, including a high-income range, and is notably larger than the gap from waged employment.
Figure 7. Kernel density estimate of (log of) income from wage employment, by gender. (a) Log of income from wages in 2007. (b) Log of income from wages in 2013. Source: Authors’ estimations based on the Eswatini Labor Force Surveys.
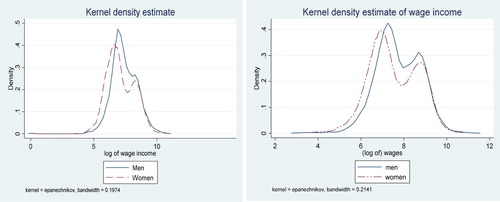
Figure 8. Kernel density estimate of (log of) income from self-employment, by gender. (a) In 2007. (b) In 2013. Source: Authors’ estimations based on the Eswatini Labor Force Surveys.
To identify the factors contributing to the unadjusted gender wage gap and the gap in income from self-employment, we utilised a statistical method developed by the Blinder (Citation1973) and Oaxaca (Citation1973). This procedure explains the extent to which the aggregate wage gap is caused by the wage structure (unexplained) effect, the composition (explained) effect, and their combination. The explained part is the gap between the wages of men and women due to the differences in their observed characteristics (e.g. age, education, sector). Such differences can result from many factors, including sectoral and/or occupational segregation. The unexplained part measures the gap in wages of male and female workers with identical observed characteristics, which can reflect gaps in their unobservable characteristics.Footnote9
displays the results of the Oaxaca–Blinder decomposition of the mean difference between (log of) monthly wages of men and women. The explained part (differences in characteristics) ranges from 21.7% in 2013 to 23.7% in 2010. Put differently, on average about 23% of the gender gap in monthly wages can be attributed to the differences in characteristics between male and female workers.
Table 8. Oaxaca–Blinder decomposition of gender wage gaps in Eswatini, 2007–13.
The explained part is driven by observed personal characteristics, especially whether the worker is the head of the household. This is consistent with findings for advanced economies which point to workers with greater financial responsibilities to their families earning higher wages (Hill, Citation1979). Marital status explains on average 9% of the total gender wage gap and the age 10%, but their contributions vary. In contrast, working in Manzini, in the industrial and in the private sector hub of the country, has almost no explanatory effect since a large share of the employment is also generated in the government sector in Mbabane. The tertiary education is negatively related to the gender gap (−30% on average), which means that the gap would be even larger if tertiary education of men and women were to be equal. In our sample, tertiary schooling has a positive effect on wages, and employed women have, on average, more years of tertiary schooling than employed men ().
also reveals that the unexplained part of the gender wage gap is large. However, this does not necessarily mean that this large part of the gender wage gap is due to practices such as unequal wage for equal work. Labour force surveys in Eswatini omit some important characteristics that may matter or be even critical for the labour market outcomes. Examples include differences in respondents’ length and quality of work experience, non-cognitive skills, or access to professional networks. At the same time, it is likely that prevailing social norms, attitudes, and practices impact negatively female labour market outcomes. For example, micro-surveys have pointed out that only half of women in Eswatini believe that men should share the housework and 17% believe that when women work, they should give their wage to their husband (SADC, Citation2018).
More broadly, researchers have also highlighted that the presence of women in the labour market, which is particularly low in Eswatini, is a key determinant of the degree of gender bias in the workplace (Agenor, Citation2017). SADC (Citation2018) found that women's participation in the formal economy remains undervalued in the region. Women in SADC are also less likely than men to benefit from digital technologies and the use web for economic empowerment, given their lower digital skills and more limited access to the Internet. In Eswatini, the challenge of including women in good (productive and well-paying) jobs is magnified by the country having one of the slowest real GDP growth in Africa.
Given the vital role of self-employment in women’s labour market activities and the sizeable unadjusted gender gap in the incomes from self-employment, we utilised the Oaxaca–Blinder decomposition to explore also factors linked with this earnings disparity ().
Table 9. Oaxaca–Blinder decomposition of net income from self-employment (log).
In self-employment and entrepreneurship research, it is common to include a correction for sample selection bias in the income equations based on the procedure developed by Heckman (Citation1979). This is because those individuals who are not self-employed and not in the labour force (e.g. discouraged workers) are not randomly sampled but constitute a self-selected sample. Since they are not working, their wages or earnings are unobserved, and thus they are omitted. Hence, a simple regression procedure will face the endogeneity problem of non-random omitted sample. Not accounting for this issue could yield biased estimates of the gender income gap. The Heckman procedure works as follows. In the first step, using a probit model, it estimates the determinants of the decision to engage in employment (selection equation). In the second step gender income gap (outcome equation) is estimated, using the results of the first step to correct for the endogenous sample selection.Footnote10 Hence we used this procedure and applied the standard decomposition formulas only after deducting the selection effects from the overall gender gap.
The pay gap between self-employed men and women is substantial (about 60% of male income in 2013) and does not appear to narrow over time. In contrast to the gender wage gap, differences in endowments (e.g. observed characteristics) account for a significant part of the unadjusted self-employment income gap, on average, for over 40% of it (). Personal characteristics, especially tertiary education and the sector of employment, mostly drive the explained part of the gap. Working in an urban area and the amount of weekly working hours also account for a large part of the gender gap in self-employment income. These four characteristics together account for 20–60% of the overall disparity.
However, sizeable pay gap remains unexplained, suggesting that the pay gap could be generated by the demand factors of the Eswatini’s labour market, most of which remain unaccounted for. It implies that a large share of women is likely pushed into self-employment due to the lack of other job opportunities, rather than pulled into it by more flexible working arrangements, autonomy and other potential psychological benefits of being self-employed. For many Swazi women who lack education and work experience, and also face high demands for care from families, productive job opportunities in the public of formal private sector are limited. These women often work as self-employed out of necessity and engage in non-professional jobs, such as low productivity and low value-adding services in the informal sector.
4. Conclusions
In this paper, we documented the gender gaps in the labour market in Eswatini and their trends, using the first three (2007, 2010 and 2013) Eswatini Labor Force Surveys. We found that women face higher likelihood of being unemployed than men and are more prone to being discouraged and exit from the labour force. Relatively large gender earning gaps were identified, even after accounting for different characteristics of men and women.
The unadjusted income gap is particularly high for the self-employed women, whose average earnings amount to only about 40% of those of their male counterparts. While part of this gap can be explained by gender differences in tertiary education and the sector of employment, a significant portion remains unexplained, suggesting that Swazi women are pushed into self-employment due to the lack of other employment opportunities. Social norms contribute to the large presence of women in the low paying and insecure segments of the labour market. Given its persistence over time, self-employment earnings gap has become a structural component of the labour markets. The country has made some progress with the legal framework on gender equality, but implementation is lacking. Specifically, since 2019 married women do not need their husbanďs consent for dealing with marital assets and administering property. Women also have same access to long-term land leases as men. However customary practices still restrict women’s access (World Bank, Citation2020).
The co-existence of large wage gap and low labour force participation contrasts with evidence from European countries, which exhibit trade-off between the two.Footnote11 In Eswatini, women are turning to low-paying self-employment out of necessity rather than opportunity as they face barriers in entering the high paying professions. This is confirmed by the observation that the share of women who have emigrated to find a job abroad has also increased since 2000, possibly hampering the country’s economic development. We have also highlighted low and declining labour force participation among Swazi women. Emigration and remittances received from abroad are likely to contribute to such decline.
The surveys show that Eswatini has one of the highest female unemployment rates in the region. The country has not been generating enough jobs, especially for women. It would need to invest more in female-friendly jobs through well-designed structural transformation strategy that would incentivize female workers to move from low to high productivity sectors and firms. By reducing pay gaps, such strategy would also help address emigration of skilled female workers. Moreover, the government could incentivize women to enter technical training programmes and university fields in Science, Technology, Engineering and Mathematics (STEM).Footnote12
Based on the evidence, policies both on the supply and demand side of the labour market are needed to reduce the persistent gender gaps and utilise the potential of women. The measures on the supply side could include enhancement of female education outcomes, and in particular raising enrolment rates into tertiary education. On the demand side, measures could include, for example, mentoring programmes, expansion of scholarships and opportunities for combining studies with internships. On the supply side, it would be important to raise the number of institutions providing tertiary education while also closely monitoring its quality. Other measures impacting woman’s job market outcomes could include government and firms’ support to their job search in the formal sector. Given the greater job opportunities in urban areas, complementary policies could focus on affordable urban housing and building roads to facilitate urban-rural commute, alongside creating more non-agricultural jobs in rural areas. To benefit from emigration, the government could develop (re)integration policy for returning migrants while creating networks with Eswatini diaspora abroad and incentivizing them to invest in their communities of origin.
On the labour demand side, measures that would encourage female entrepreneurship include financial instruments and change in regulations to help self-employed women access credit and grow their firms. The young women in particular could benefit from tailored entrepreneurship development programmes, alongside improved educational opportunities in technical and business fields, vocational training, including at the tertiary level, so as to strengthen female human capital and ease school-to-work transition. Given the fiscal costs associated with many of these measures, strengthening of public financial management and bringing the public finance on sustainable footing are a precondition.
In conclusion, while the paper has provided evidence on the positive role of tertiary education and urban location in securing wage employment by women, further research is needed to identify mechanisms through which these factors work. One area of possible interest is to examine the network spillovers at the universities and in urban centres once information on social and professional networks of respondents becomes available.
Disclosure statement
No potential conflict of interest was reported by the author(s).
Additional information
Funding
Notes
1 Various studies have documented the linkages between gender equality and economic outcomes as well as impacts of gender gaps in education, labour markets and political participation on growth, productivity, and societal well-being (Klasen, Citation2006; Cuberes & Teignier-Baqué, Citation2011; Schober & Winter-Ebmer, Citation2011; Duflo, Citation2012; World Bank, Citation2012; Dieterich et al., Citation2016; Hakura et al., Citation2016).
2 Specifically, young women (15–24) were 5 times more likely to be infected with HIV than their male counterparts, according to the UNICEF.
3 World Bank provides Eswatini overview at: www.worldbank.org/en/country/eswatini/overview.
4 Afrobarometer (2018) survey for Eswatini provides some highlights on views/perception towards emigration. The survey covers a nationally representative sample of 1200 individuals.
5 Cox-Edwards & Rodriguez-Oreggia (Citation2009) found that labour force participation depends on reservation wage. In turn, non-labour income, including remittances, is a key determinant of the reservation wage.
6 Azizi (Citation2018) found that remittances lower labour force participation of women but not men.
7 As we believe that variation in gender ratios is driven mostly by exogeneous factors and is not subject to mismeasurement, it’s unlikely that the results on gender suffer from endogeneity bias. The relatively limited variety of variables covered in the survey makes it difficult to devise a solid instrumental variable-based estimation strategy.
8 Ganguli et al. (Citation2014) showed that ‘the marriage gap’ (the labour force participation gap between married and single women) and the ‘motherhood gap’ vary widely across countries.
9 The analysis consists of two stages: a regression analysis and a decomposition analysis of the structure of earnings. The regressions build on the standard Mincer (Citation1974) earnings equation, where the log earnings are related to education and experience. In the decomposition part, a counterfactual equation is constructed where the constant and coefficients in the women’s equation are replaced by those of the men’s equation.
10 Jann (Citation2008) discusses this method in detail.
11 Boll & Lagemann (Citation2019) discuss this trade-off in the context of European Union, where countries with relatively large wage gap have relatively high labour force participation and vice versa.
12 A similar policy recommendation was made by Ruiters & Charteris (Citation2020) for South Africa.
References
- Agenor, P, 2017. A theory of social norms, women’s time allocation, and gender inequality in the process of development. Working paper no. 237. Centre for Growth and Business Cycle Research, University of Manchester.
- Amin, M, Kuntchev, V & Schmidt, M, 2015. Gender inequality and growth: The case of rich vs. poor countries, World Bank policy research working paper no. 7172. World Bank, Washington.
- Azizi, S, 2018. The impacts of workers’ remittances on Human capital and labor supply in developing countries. Economic Modelling 75, 377–96.
- Blinder, AS, 1973. Wage discrimination: Reduced form and structural estimates. The Journal of Human Resources 8, 436–55.
- Boll, C & Lagemann, A, 2019. The gender pay gap in EU countries—New evidence based on EU-SES 2014 data. Intereconomics 54(2), 101–5.
- Brixiová, Z & Kangoye, T, 2014. Youth unemployment in Africa: New evidence and policies from Eswatini. In Sciulli, D & Ángel Malo, M (Eds.), Disadvantaged workers. 1st edn, chapter 9. AIEL series in labour economics.
- Cox-Edwards, A & Rodriguez-Oreggia, E, 2009. Remittances and labor force participation in Mexico: An analysis using propensity score matching. World Development 37(5), 1004–14.
- Cuberes, D & Teignier-Baqué, M, 2011. Gender inequality and economic growth. Background paper for the World Development Report 2012. World Bank, Washington, DC.
- Dieterich, C, Huang, A & Thomas, A, 2016. Women’s opportunities and challenges in Sub-Saharan African job markets. International Monetary Fund working paper WP/16/188.
- Duflo, E, 2012. Women empowerment and economic development. Journal of Economic Literature 50(4), 1051–79.
- Eswatini Ministry of Labor (2008, 2011 and 2014), Labor Force Survey 2007, 2010, and 2013/14, Mbabane, Eswatini.
- Fields, G, 2007. The Harris-Todaro model. Cornell University, ILR School. http://digitalcommons.ilr.cornell.edu/workingpapers/21/ Accessed 7 July 2019.
- Ganguli, I, Hausmann, R & Viarengo, M, 2014. Closing the gender gap in education: What is the state of gaps in labor force participation for women, wives and mothers? International Labour Review 153(2), 173–220.
- Hakura, D, Hussain, M, Newiak, M, Thakoor, V & Yang, F, 2016. Inequality, gender gaps and economic growth: Comparative evidence for Sub-Saharan Africa. IMF working paper no. WP/16/111.
- Harington, JS, McGlashan, ND & Chelkowska, EZ, 2004. A century of migrant labour in the gold mines of South Africa. The Journal of the South African Institute of Mining and Metallurgy. https://www.saimm.co.za/Journal/v104n02p065.pdf.
- Heckman, JJ, 1979. Sample selection bias as a specification error. Econometrica 47, 153–61.
- Hill, MS, 1979. The wage effects of marital status and children. The Journal of Human Resources 14(4), 579–94.
- International Labour Organization, 2020. ILO monitor: COVID-19 and the world of work. 5th edn. ILO, Geneva.
- Jann, B, 2008. The Blinder-Oaxaca decomposition for linear regression models. The Stata Journal 8(4), 453–79.
- Jauch, H, 2011. Time to turn the tide: Tackling poverty, inequality and unemployment in Southern Africa. Freidrich Ebert Stiftung Perspective, June.
- Klasen, S, 2002. Low schooling for girls, slower growth for all? Cross-country evidence on the effect of gender Inequality in education on economic development. The World Bank Economic Review 16(3), 345–73.
- Klasen, S, 2006. Gender and pro-poor growth. In Menkoff, L (Ed.), Pro-poor growth: policy and evidence. Dunker and Humblot, Berlin.
- Klasen, S & Lamanna, F, 2003. The impact of gender inequality in education and employment on economic growth in the Middle East and North Africa. World Bank.
- McKinsey, 2019. The power of parity: Advancing women’s equality in Africa. McKinsey Global Institute, Washington, DC.
- Mincer, J, 1974. Schooling, experience and earnings. Cambridge, MA: National Bureau of Economic Research.
- Oaxaca, R, 1973. Male-female wage differentials in urban labor markets. International Economic Review 14, 693–709.
- Ostry, JD, Alvarez, J, Espinoza, RA & Papageorgiou, C, 2018. Economic gains from gender inclusion: New mechanisms, new evidence. IMF staff discussion note.
- Ruiters, M & Charteris, A, 2020. Gender equality in labour force participation, economic growth and development in South Africa. Development Southern Africa 37(6), 997–1011.
- SADC, 2018. SADC gender protocol 2018 Barometer.
- Schober, T & Winter-Ebmer, R, 2011. Gender wage inequality and economic growth: Is there really a puzzle? – A comment. World Development 39(8), 1476–84.
- Stotsky, JG, 2006. Gender and its relevance to macroeconomic policy: A survey. IMF working paper no. 06/233. International Monetary Fund, Washington, DC.
- Tsododo, V, 2014. Gender equality and the participation of women in public office in Swaziland. Afrobarometer briefing paper no. 147.
- UNDP, 2020. Human development reports – Gender inequality index.
- Wenham, C, Smith, J & Morgan, R, 2020. COVID-19: Gendered impacts of the outbreak. The Lancet 395, 14 March.
- World Bank, 2012. World development report: Gender equality and development. World Bank, Washington, DC.
- World Bank, 2016. Migration and remittances factbook. World Bank, Washington, DC.
- World Bank, 2020. The kingdom of Eswatini: Toward equal opportunity: Accelerating inclusion and poverty reduction, systematic country diagnostic. World Bank, Washington, DC.
Appendices
Appendix 2. Descriptive statistics of the main variables (% of total population aged 15+, unless otherwise stated)