
Abstract
Objective:
A clear understanding of changes in the consumption of sugars and other sugars-containing foods has become essential for dietary recommendations and nutrition policy considerations. This study aimed to estimate the consumption trends of added sugars, energy, macronutrients, and food categories using food supply data.
Methods:
Annual food availability data were obtained from Statistics Canada “Food Available in Canada” database and compared to the equivalent data from Canadian Community Health Survey 2004/2015 and USDA “Food Availability (Per Capita) Data System”.
Results:
There was a 17% decline in the loss-adjusted per capita consumption of added sugars (%energy) in Canada over the past two decades, largely attributed to reduced intakes of refined sugar and sugars from soft drinks. Added sugars consumption was generally 30% less than that in the US. There was also a consistent decline in total energy intake and %energy from carbohydrates, accompanied by increased %energy derived from fats particularly during the most recent 10 years.
Conclusion:
The observed trends in added sugars availability are similar to findings from the Canadian Community Health Surveys, demonstrating the potential application of annual loss-adjusted food availability data in monitoring trends in food and macronutrient intakes over time to complement dietary survey data in informing public policy development.
Introduction
Excess intakes of added sugars, especially from sugars-sweetened beverages, have been linked with excess energy intake and increased risk of obesity and associated chronic disease such as type 2 diabetes (Citation1, Citation2). Nevertheless, a series of systematic reviews and meta-analyses have demonstrated there is no difference between added sugars and other sources of calories, such as starch, regarding the effects on major chronic disease risk factors, and that the harmful effect is only observed when consumed as a source of excess calories (Citation3–6). Previous research also provides evidence of a reciprocal relationship between the intakes of sugars and fat (a phenomenon called “sugar-fat” see-saw) (Citation7), likely due to differences in food choices. As a result, improved understanding of the consumption of added sugars (including sugars in foods and beverages added during food processing and prepared at restaurants, institutions, and home), especially in relation to other important dietary information such as total energy, macronutrients, and food categories, has become essential for dietary recommendations and nutrition policy considerations. Previous surveys among Canadian health professionals (such as dietitians) and undergraduate nutrition students have identified understanding of sugars consumption as a knowledge gap, with the majority over-estimating Canadian consumption of added sugars (at approximately twice the average intake level) (Citation8, Citation9). While global consumption of added sugars in developed countries, including Canada, has been shown to be either steady or declining (Citation10, Citation11), respondents from these Canadian surveys also held the perception that added sugars consumption in Canada has been increasing over the past two decades (Citation8, Citation9). These perceptions may have resulted from a lack of widespread communication of the most recent dietary survey data and consumption trend (food availability) data on added sugars, or from the misreporting of sugars consumption data in media articles which have either used incorrect sugars terminology, or principally reported on added sugars intake data from the United States which are generally higher than in Canada (Citation10).
The Canadian Community Health Survey (CCHS)—Nutrition is a series of cross-sectional nationally representative surveys of food and nutrition consumption conducted by Statistics Canada, the details of which have been published (Citation12). In brief, CCHS collects dietary intake data using 24-hour dietary recalls that are administered in-person by trained interviewers using a computerized modification of the US Department of Agriculture Automated Multiple-Pass Method (Citation13). Thus far, only two iterations of the CCHS—Nutrition data have been completed, one conducted in 2004 and the second in 2015. Although these data provide a more accurate estimation of food and nutrient intakes among Canadians, the infrequency has largely limited the ability to monitor consumption trends over time.
An indirect method to estimate consumption trends is through the use of per capita food availability data, which provide an estimate of foods and nutrients available for consumption, and more importantly are reported on an annual basis. Historically, such estimates have been conducted in many countries nationally and estimates are also compiled globally by the Food and Agriculture Organization of the United Nations (FAO) (Citation14). Such data are complementary to much less frequent dietary survey data and when tabulated over time show trends in the national food supply, changes in the country’s overall dietary pattern and the extent to which the food supply is consistent with national food and nutrition policies. One of the most comprehensive national food supply databases is maintained by the United States Department of Agriculture “Food Availability (Per Capita) Data System” (Citation15, Citation16). The equivalent food supply data in Canada is the Statistics Canada “Food Available in Canada” database (Citation17). These two databases provide a comprehensive picture of total food availability in the US and Canada, demonstrating information on primary and processed commodities consumed directly or as ingredients in further processed foods, and can be used to further estimate energy and macronutrient availability. In addition, these comparable datasets can be used for a high-level comparison of potentially different eating patterns between these two North American countries. Although food availability data do not provide information on individual consumption patterns, eating occasions (e.g. at home or out of home) or intake variability within the population, the data are consistently reported on an annual basis, and thus can be used to estimate relative consumption trends over time to supplement previous analyses on added sugars consumption using dietary survey data (Citation18).
Therefore, the objectives of this study were 1) to provide the most up-to-date data on the Canadian trends in food availability of added sugars and energy contribution from macronutrients, 2) to assess the pattern of sugars availability in relation to that of other commodities in Canada, and 3) to compare Canadian trends to those in the United States, using per capita loss-adjusted food availability data.
Materials and methods
Annual loss-adjusted availability data in Canada and the United States
Food availability data in Canada (also known as disappearance data or apparent consumption) reported by Statistics Canada include data on approximately 150 basic food and beverage commodities entering the Canadian market including dairy products, beverages, eggs, pulses and nuts, sugars and syrups, cereal products, meats and poultry, citrus fruits, fresh fruits, processed fruits, fresh vegetables, processed vegetables, juices, oils and fats, and fish, regardless of its final use (e.g. direct consumption or as ingredients during food preparation or processing) (Citation17). While the data do not provide a direct measure of foods in their finished form, the methodology is designed to account for all nutritive ingredients used to produce products in Canada, and is therefore considered to be a “proxy” for actual consumption when used in combination with food loss/waste estimates. The data are not collected from individual consumers, and thus provide an independent basis for examining dietary trends without the limitations implicit in consumer survey data (Citation19). Data are reported on an annual basis, compiled from a wide variety of sources by Statistics Canada using a commodity supply-disposition approach to produce per capita food availability to monitor consumption trends (Citation20).
For this analysis, the “loss-adjusted” availability of all food commodities in Canada for the last two decades (1999-2019) were obtained from the Statistics Canada “Food Statistics in Canada” database [Table: 32-10-0054-01 Food available in Canada (formerly CANSIM 002-0011)] (Citation17). Loss-adjusted food availability accounts for losses that occur in the storage, preparation, and cooking of food, as well as the food that makes it to the plate but is not consumed (i.e. plate loss). Statistics Canada uses the most recent loss-adjustment factors obtained from the Economic Research Service of the United States Department of Agriculture (USDA-ERS), which provide a proxy of fork-level consumption (Citation19). For a few commodities that do not have loss-adjusted availability in Statistics Canada Table 32-10-0054-01, the USDA loss-adjustment factors were applied to their corresponding unadjusted availability. There were also a set of commodities (mostly in the fruits, vegetables, and dairy categories) where loss-adjustment factors were not updated for the period between 1999 to 2005 in the Statistics Canada database; therefore, the corresponding USDA loss-adjustment factors were applied to the respective unadjusted availability data within this period. To compare food availability in Canada to the US, annual loss-adjusted food availability data in the US for the same period (i.e., 1999-2019) were obtained from the US Department of Agriculture (USDA) Economic Research Service (ERS) Food Availability (Per Capita) Data System (Citation21).
Estimation of added sugars availability in Canada and the United States
The estimation of loss-adjusted per capita consumption of added sugars was based on previously published methods (Citation10). In brief, added sugars in this study based on the Canadian availability data was defined as the combined categories of “sugars and syrups” and “soft drinks” available in the Canadian food supply for all possible consumption occasions. The estimates are at the commodity level for sugars consumed as foods directly, or used as ingredients in sugar-containing processed foods and beverages (e.g. baked goods, confectionary, sweetened beverages, etc.) for various functional roles, such as adding sweetness, providing texture, and supporting yeast fermentation, regardless of whether prepared by food manufacturers, at home, in restaurants, or in institutions. Hence, it is a comprehensive estimate of added sugars as nutrients in the food supply in all foods and beverages consumed in Canada. Specifically, the “sugars and syrups” category includes refined sugar (including all white, brown and specialty sugars, and sugar syrups sourced from sugar beet and sugar cane), maple syrup, and honey. The availability of corn sweeteners [e.g. high fructose corn syrup (HFCS)], is proprietary information in Canada and thus not reported by Statistics Canada. Since the primary use of HFCS is in sweetened caloric beverages, the availability of “soft drinks” was used as an indirect estimate of HFCS availability. It is important to note that the “soft drinks” category includes beverages sweetened with both sugars and other low/no caloric sweeteners (i.e., diet soft drinks), thus our calculation overestimated the amount of added sugars from “soft drinks”. The extent to which this overestimation serves to balance the unreported amount of HFCS in other foods and beverages (e.g., fruit drinks) not captured in the analysis is unknown. Nevertheless, this approach provides a reasonable estimation of added sugars based on data that are publicly available. The corresponding added sugars availability in the US were calculated by USDA-ERS (Citation21).
Dietary energy and macronutrient intakes in Canada
Per capita loss-adjusted availability of total energy (kilocalories per person) and macronutrient intakes (including carbohydrate, protein, fat, and alcohol, as grams per person) in Canada were calculated from the loss-adjusted availability of all commodities using methods previously described to calculate food energy (Citation20). In brief, loss-adjusted food availability data were translated into nutrient equivalents by multiplying the loss-adjusted retail weight by conversion factors on an individual food basis. Specifically, kilograms (and for selected foods, litres) per capita of each food available for consumption per year was divided by 365, and then multiplied by the food’s nutritive equivalent factor “as purchased at retail”. The nutrient equivalent factors were developed by the Food Bureau of Agriculture and Agri-Food Canada in cooperation with Statistics Canada, originally based on food values obtained from the Canadian Nutrient File provided by Health Canada. This methodology, used to calculate the apparent nutritive value of food available for consumption in Canada, is similar to that used in the US and in many other countries.
Energy contribution from major food groups in Canada and the United States
Commodity groups in Statistics Canada Table: 32-10-0054-01 Food availability in Canada (Citation17) were further grouped into: 1) meat, eggs, and nuts; 2) dairy; 3) fruit; 4) vegetables; 5) flour and cereal products; 6) fats and oils; 7) sugars; and 8) alcoholic beverages. Percentage energy contribution from these food categories were calculated and compared to the equivalent food categories in the US.
Statistical analysis
Trend analyses were completed in GraphPad Prism 9.1.0 (GraphPad) using simple linear regression. Results were considered as statistically significant at a p-value < 0.05.
Results
Trends in estimated added sugars consumption
In Canada, a steadily declining trend was observed for the estimated loss-adjusted per capita consumption of added sugars between 1999 and 2019 (). Total estimated added sugars declined 22% from 76.8 g/day (298 kcal) in 1999 to 59.6 g/day (230 kcal) in 2019. As a share of total energy intake, added sugars dropped by 17% over the two decades, from 12.6% of energy (%E) in 1999 to 10.5 %E in 2019. This decline was largely due to the substantial drop in soft drink consumption – a 52% reduction in sugars from soft drinks (20.5 g/d in 1999 vs 9.8 g/d in 2019 per capita) – as well as a 13% reduction in per capita refined sugar intake (54.7 g/d in 1999 vs 47.8 g/d in 2019). A small increase in maple sugar (+0.4 g/day) and honey (+0.5 g/day) per capita was also observed.
Table 1. Loss-Adjusted Daily Per Capita Added Sugars Availability in Canada1 and the United States2.
In the US, the absolute loss-adjusted per capita consumption of total caloric sweeteners (equivalent to added sugars, ) also steadily declined between 1999 and 2019, from 111 g/day (423 kcal) to 90 g/day (343 kcal), a 19% reduction. This was largely due to reduced intakes of high-fructose corn syrup and other corn sweeteners (42% and 17% reduction, respectively). Refined sugar showed a slight increasing trend over the two decades (3% increase), primarily replacing high-fructose corn syrup in some beverages, but has been declining since 2016 (Citation22). While similar declining trends in total caloric sweeteners were observed in Canada and the US, the absolute per capita estimated consumption of added sugars in Canada is approximately 33% less than in the US (230 kcal vs 343 kcal, respectively in 2019). Due to the termination of select Current Industrial Reports by the US Census Bureau, data on some added fats and oils could not be updated beyond 2010 in the Food Availability Data System for the calculation of total energy intake; as a result, the % energy from added sugars in the US cannot be calculated from 2011 onwards. Nevertheless, between 1999 and 2010, Canada’s consumption of added sugars was about 23% less than that in the US when expressed as a percentage of energy.
Loss-adjusted per capita consumption of dietary energy and macronutrients
Over the past two decades, there has been a consistent decline in the per capita intake of total energy in Canada, from 2369 kcal in 1999 to 2197 kcal in 2019, representing a 7.3% reduction (). Changes in %E between 1999 and 2019 are presented in . For macronutrients, the %E from protein and alcohol remained relatively stable while %E from carbohydrate slowly declined by 2.7 %E (–34.6 g/day) between 1999 and 2019. On the other hand, the consumption of fat (both as g/day and %E) declined until 2005 but has since exhibited an increasing trend, reaching 38.6 %E in 2019 which is 2.6%E higher than the intake level in 1999. Unfortunately, the macronutrient intake data (expressed in kcal/day) in the US are only available up to 2010 (Citation21) and were not loss-adjusted, thus cannot be directly compared to data in Canada.
Figure 1. Changes in loss-adjusted daily per capita macronutrient consumption (%E) in Canada from 1999 to 2019.
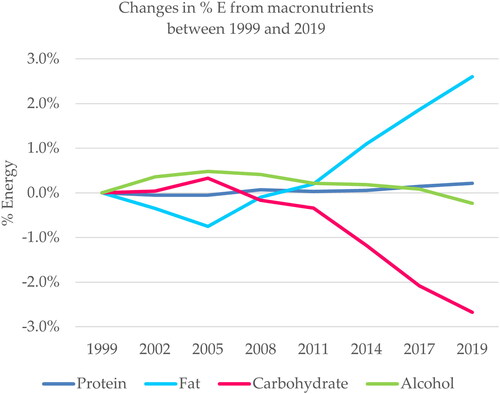
Table 2. Loss-Adjusted Daily Per Capita Macronutrient and Energy Intakes in Canada Between 1999 and 20191.
Energy contribution from major food and beverage groups in Canada
In Canada, the change in energy availability from major food groups between 1999 and 2019 is shown in (kcal/day) and Supplementary Table S1 (%E). “Added sugars” is the only category that showed a consistent declining trend and is consistent with the data in , whereas the categories of “fats and oils”, “meat, eggs and nuts”, and “flour and cereal products” showed a “U”-shaped pattern. “Flour and cereal products” showed greater fluctuation compared to other categories, largely explained by the decline of “wheat flour” by over 10 g (equivalent to 40 kcal) between 2008 and 2018 followed by an increase of 4.5 g between 2018 and 2020. For “fats and oils”, the “U”-shape was likely driven by corresponding changes in salad oils and butter (declining up to 2013 and increasing ever since). Energy from “dairy”, “fruit”, and “other non-alcoholic beverages” (excluding soft drinks) remained relatively stable, with fluctuations within 10 kcal/day during this period. When the changes were expressed as %E, most food categories except added sugars had fluctuations within 1%E (Supplementary Table S1). When comparing to the US between 1999 and 2017 (since the US food commodity data were only updated up to 2017) (), Canadians generally had lower consumption in the categories of “added sugars”, “meat, eggs and nuts”, and “fats and oils” (data up to 2010).
Figure 2. Changes in loss-adjusted energy availability (kcal/day) from major food and beverage groups in Canada between 1999 and 2019.
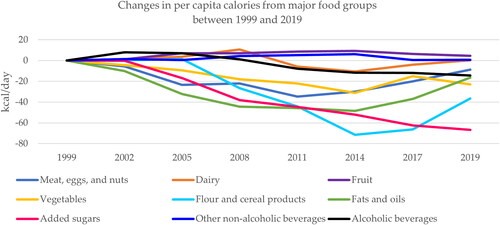
Table 3. Difference in the Energy (kcal) from Major Food Groups in Canada1 Compared to the Equivalent Food Categories in the US2 (Note: Negative Values Indicate Lower Canadian Consumptions; Vice Versa).
Discussion
This is an updated report of the consumption trends in loss-adjusted added sugars availability in the Canadian food supply and the first study to compare Canada and US data on added sugars availability in the context of macronutrient intakes and other food commodity trends. Similar to previously reported Canadian (Citation10, Citation18) and global sugars consumption trends (Citation11, Citation23, Citation24), data from this study indicate a steady decline in loss-adjusted per capita added sugars consumption in both absolute (g/day) and relative (%E) terms over the past two decades, with the largest reduction coming from sugars in soft drinks (principally corn sweeteners such as high-fructose corn syrup, −10.7 g/day or −1.7%E), followed by refined sugar (-6.9 g/day or −0.5%E). The declining trend in total added sugars, most notably sugars from soft drinks, may reflect ongoing public health and media attention to concerns regarding added sugars in relation to dietary management of obesity, and more recently from global dietary recommendations such as the 2015 World Health Organization Free Sugars Guideline (Citation25) and related public policies (e.g. Canada’s Food Guide) focusing on reducing free sugars, especially from sugars-sweetened beverages.
When compared to the most recent Canadian national dietary survey, the loss-adjusted per capita availability of added sugars in 2015 was 11.3%E, which is very close to the usual intake of added sugars (11%E) calculated from the 24-hour dietary recall data in the CCHS 2015-Nutrition by Liu et al (Citation26). Notably, added sugars availability in 2019 was 10.5%E, very close to the 10% threshold recommended in the Dietary Guidelines for Americans 2020-2025. In addition, the declining trends in added sugars and sugars from soft drinks were consistent with previous analyses of dietary surveys in CCHS 2004 and 2015 (Citation18, Citation27, Citation28), previous sugars availability trend data from Australia (Citation29, Citation30), and per capita sales data specifically on sugars from soft drinks in the UK (Citation31). These trends also reflect global dietary recommendations and policies in reducing sugars intake. Although the soft drink availability data do not differentiate sugars-sweetened soft drinks from diet soft drinks, Canadian consumption of both categories have declined between 2004 and 2015 while the volume of plain water consumption increased, demonstrating a shift in the choice of beverages (Citation28). Collectively, these findings suggest that loss-adjusted per capita availability of added sugars in Canada can be a useful tool to monitor added sugars consumption over time given its much greater data collection frequency compared to Canadian national dietary surveys.
While intakes of refined sugar and sugars in soft drinks declined, slight increases were observed in the loss-adjusted availability of maple syrup (used either as a food ingredient or consumed directly), which reflects findings from the series of “Tracking Nutrition Trends” studies conducted by the Canadian Foundation of Dietetic Research. In their 2018 report, they conclude that since 2013, Canadians are more likely to say they will eat foods containing honey and maple syrup, and less likely to eat foods containing sugar, fructose, corn syrup and evaporated cane juice (Citation32). The “health halo” associated with perceived naturalness in maple syrup despite providing the same amount of calories as table sugar (4 kcal/g) was also seen for agave and “raw” sugar, which were considered to be healthier than table sugar by participants of the 2017 Canada Food Study online survey (Citation33). A 2016 Mintel survey among 1,700 Canadians aged 18 years and older suggested that the preference for more natural or less processed sugars/alternative sweeteners was driving consumers toward the use of those ingredients in food preparation or baking, especially among younger women (Citation34). Unfortunately, Statistics Canada does not report per capita availability of agave or other novel caloric sweeteners, such as date sugar and coconut sugar, to monitor consumption trends. Neither can these data provide insight into trends in the use of sugars-based ingredients in foods and beverages, or changes in consumer dietary choices to account for the observed declining trend in refined sugar/increase in natural syrups.
While consumer trends and global policies are driving manufacturers toward reformulation to reduce the content of sugars in packaged foods, a recent study comparing sugars content in Canadian prepackaged foods and beverages between 2013 and 2017 demonstrated that the overall calorie content and other nutrients stayed the same or decreased among products reformulated to be “lower in sugars” (Citation35). On many occasions, reduced sugars were replaced by starch to maintain a similar taste or texture (Citation21). Since all types of sugars and starches provide a similar number of calories, and the health effects of sugars have been shown to largely be mediated through its caloric contribution (Citation3–6), reformulation strategies need to be carefully considered to provide a comprehensive improvement in overall nutritional value rather than a narrow focus on reducing sugars alone.
Loss-adjusted energy and macronutrient availability were also calculated for the period of 1999-2019 using published methods by Statistics Canada, to provide a comprehensive overview of dietary sources of calories. A consistent decline in the loss-adjusted per capita total energy intake was observed with a 172 kcal (7.3%) reduction between 1999 and 2019, which can be mostly attributed to the reduction in carbohydrates (34.6 g, equivalent to 138 kcal), including a 68.1 kcal reduction from added sugars. Further, the proportion of energy from carbohydrate decreased while that from fat increased over the two decades, similar to the “sugar-fat see-saw” phenomenon shown in a 2015 systematic review (Citation7). Recent publications on per capita nutrient availability or household purchase data within the past few decades from the United Kingdom, Portugal, Bangladesh, and eastern Mediterranean countries have also shown a similar decline in % energy from carbohydrates and the reciprocal increase in % energy from fat (Citation36–39), whereas in Africa, the energy contribution of carbohydrate, fat, and protein remained relatively constant (Citation40). For southeast Asian countries, data on the energy contribution from macronutrients are not yet available, however there was an increasing trend in the absolute per capita protein availability between 1999 and 2018 (Citation41). Importantly, in comparison to dietary surveys, the observed trends in the per capita consumption of macronutrients in Canada are consistent with the reported shifts in macronutrients reported by dietary surveys in CCHS 2004 and 2015 (Citation42).
The US/Canada Dietary Reference Intakes Acceptable Macronutrient Distribution Range (AMDR) provides guidance in the intakes of energy sources associated with reduced risk of chronic disease while providing adequate intakes of essential nutrients (Citation43). The AMDR for dietary fat is 20-35 %E, and the per capita dietary fat intakes have been consistently above this range, whereas the %E from protein stayed within the range of 10-35 %E, and the %E from carbohydrate has dropped below the lower end of the AMDR range for carbohydrate (45-65 %E). The loss-adjusted availability of dietary fiber remained relatively stable over the past two decades at about 13 g/day, which is much lower than the recommended intakes for Canadians (25 g/day for women and 38 g/day for men) (Citation43). While the most recent loss-adjusted availability of energy and macronutrients in the US was not available (because some added fats and oils data could not be updated beyond 2010), Americans consumed about 42.8 %E from fat and 47.4 %E from carbohydrates in 2010, both higher than the corresponding values for Canadians in the same year.
An important feature of the food availability data is that they provide annual per capita consumption data by commodities, which allows a unique analysis of key food groups in the Canadian food supply. Our analysis indicates that while “added sugars” consistently declined over the past two decades, the absolute intakes (kcal/day) of several food categories such as “fats and oils”, “meat, eggs and nuts”, “flour and cereal products” also declined and remain below 1999 levels but have shown an increasing trend in more recent years, suggesting a shift in consumer food choices.
Different eating patterns were also observed between Canadians and Americans, where Canadians appear to be consuming considerably less energy from “meat, eggs and nuts”, and “fats and oils”, with little difference in the categories of “dairy”, “fruit”, “vegetables”, or “flour and cereal products”. For sugars, Canadian consumption of added sugars is approximately 30% less than that in the US, and the difference may largely be explained by differences in in soft drink consumption. Historically, soft drink consumption in Canada is approximately half that of the United States [5] and recent dietary survey data provide further support on this. Children in the US (2-18 years) consumed about 12.6 g sugars per day from soft drinks and adults 19 years and older consumed 17.4 grams of sugars from soft drinks, based on analyses of NHANES 2017-2018 (Citation44). On the other hand, Canadians 1 year and older on average consumed 7.4 grams of sugars from regular soft drinks based on CCHS 2015 data (Citation45), which is the closest timepoint available in Canadian dietary surveys that enables a direct comparison. Future analysis is warranted to assess the diet quality of Canadians with food availability data using indicators such as the Healthy Eating Index, to monitor changes in the food supply in relation to dietary recommendations.
There are several strengths of the study. First, food availability is reported on an annual basis using a consistent methodology, which is ideal for assessing trends over time. Second, food availability data were adjusted for losses at the primary, retail and consumer levels using the most recent USDA waste adjustment factors to provide a more accurate estimation of the actual consumed proportion of the available food commodities in the food supply. Third, data are precisely separated into individual commodities, which simplifies the analysis of food groups in comparison to additional analysis required to summarize data reported at the individual intake level in dietary surveys. Finally, these data provide a valuable lens through which to examine changes in the macro food environment and how it conforms to dietary recommendations. Nevertheless, the main limitation is that loss-adjusted food availability data only offers an ecological portrait of the food supply but does not provide any retail-level distribution or individual-level consumption pattern information to precisely estimate nutrient intakes or assess any potential impact of public health campaigns. Direct comparisons of food availability data to dietary survey data should be interpreted with caution since they represent different stages of the food supply chain (Citation46). The loss-adjustment also assumed that waste and other losses in the system were relatively constant over time. The estimation of energy availability was based on published methods by Statistics Canada in 2007; however, there may be variations in the nutrient composition of the commodities over time, which cannot be accounted for in this study.
Conclusions
Based on analyses of Statistics Canada Food Availability database, there has been a 17% decline in the loss-adjusted per capita consumption of added sugars as %E over the past two decades, largely attributed to reduced apparent intakes of refined sugar and sugars in soft drinks (principally corn sweeteners such as high-fructose corn syrup). Absolute added sugars consumption in Canada was generally 30% less than that in the US within this period. There was also a consistent decline in total energy intake and %E from carbohydrates, accompanied by increased %E derived from fats especially over the most recent 10 years. The observed downward trend in Canadian added sugars consumption (mostly in beverages) is consistent with reported data from the national dietary surveys (CCHS). Although only showing a macroscopic ecological portrait of the Canadian food supply, Statistics Canada’s loss-adjusted food availability data reported on an annual basis can provide valuable trend information to complement dietary surveys in monitoring added sugars consumption in relation to other dietary components, as well as informing evidence-based public policy development. Future dietary survey data and updated nutrient composition information by commodities are needed to further validate and improve the accuracy of this methodology.
Author contributions
Conceptualization, Y.(F.)W., and S.M.; methodology, investigation and formal analysis, Y.(F.)W., L.C., and S.M.; supervision, J.L.S.; writing—original draft preparation, Y.(F.)W.; writing—review and editing, all authors. All authors have read and agreed to the published version of the manuscript.
Supplemental Material
Download MS Word (25 KB)Disclosure statement
Y.(F.)W., C.D. and S.M. are employees of the Canadian Sugar Institute, a nonprofit association that supports the industry in the areas of international trade, and nutrition research and communications. L.C. is a Mitacs-Elevate post-doctoral fellow jointly funded by the Government of Canada Mitacs program and the Canadian Sugar Institute. J.L.S. has received research support from the Canadian Foundation for Innovation, Ontario Research Fund, Province of Ontario Ministry of Research and Innovation and Science, Canadian Institutes of health Research (CIHR), Diabetes Canada, PSI Foundation, Banting and Best Diabetes Center, American Society for Nutrition, INC International Nut and Dried Fruit Council Foundation, National Dried Fruit Trade Association, National Honey Board, International Life Sciences Institute, Pulse Canada, Quaker, The Tate and Lyle Nutritional Research Fund at the University of Toronto, The Glycemic Control and Cardiovascular Disease in Type 2 Diabetes Fund at the University of Toronto (a fund established by the Alberta Pulse Growers), and The Nutrition Trialists Fund at the University of Toronto (a fund established by an inaugural donation from the Calorie Control Council). He has received in-kind food donations to support a randomized controlled trial from the Almond Board of California, California Walnut Commission, American Peanut Council, Barilla, Unilever, Upfield, Unico/Primo, Loblaw Companies, Quaker, Kellogg Canada, WhiteWave Foods, and Nutrartis. He has received travel support, speaker fees and/or honoraria from Diabetes Canada, Dairy Farmers of Canada, FoodMinds LLC, International Sweeteners Association, Nestlé, Pulse Canada, Canadian Society for Endocrinology and Metabolism (CSEM), GI Foundation, Ab-bott, General Mills, Biofortis, ASN, Northern Ontario School of Medicine, INC Nutrition Research & Education Foundation, European Food Safety Authority (EFSA), Comité Européen des Fabricants de Sucre (CEFS), and Physicians Committee for Responsible Medicine. He has or has had ad hoc consulting arrangements with Perkins Coie LLP, Tate & Lyle, Wirtschaftliche Vereinigung Zucker e.V., Danone, and Inquis Clinical Research. He is a member of the European Fruit Juice Association Scientific Expert Panel and Soy Nutrition Institute (SNI) Scientific Advisory Committee. He is on the Clinical Practice Guidelines Expert Committees of Diabetes Canada, European Association for the study of Diabetes (EASD), Canadian Cardiovascular Society (CCS), and Obesity Canada. He serves or has served as an unpaid scientific advisor for the Food, Nutrition, and Safety Program (FNSP) and the Technical Committee on Carbohydrates of ILSI North America. He is a member of the International Carbohydrate Quality Consortium (ICQC), Executive Board Member of the Diabetes and Nutrition Study Group (DNSG) of the EASD, and Director of the Toronto 3 D Knowledge Synthesis and Clinical Trials foundation. His wife is an employee of AB InBev.
Data availability statement
Loss-adjusted food availability in Canada can be accessed at: https://www150.statcan.gc.ca/t1/tbl1/en/tv.action?pid=3210005401. USDA loss-adjusted food availability data can be accessed at https://www.ers.usda.gov/data-products/food-availability-per-capita-data-system/loss-adjusted-food-availability-documentation/. Further analyses of these data are contained within the article.
Additional information
Funding
References
- Stanhope KL. Sugar consumption, metabolic disease and obesity: The state of the controversy. Crit Rev Clin Lab Sci. 2016;53(1):52–67. doi:10.3109/10408363.2015.1084990.
- Malik VS, Popkin BM, Bray GA, Despres JP, Willett WC, Hu FB. Sugar-sweetened beverages and risk of metabolic syndrome and type 2 diabetes: a meta-analysis. Diabetes Care. 2010;33(11):2477–83. doi:10.2337/dc10-1079.
- Sievenpiper JL, de Souza RJ, Mirrahimi A, Yu ME, Carleton AJ, Beyene J, Chiavaroli L, Di Buono M, Jenkins AL, Leiter LA, et al. Effect of fructose on body weight in controlled feeding trials: a systematic review and meta-analysis. Ann Intern Med. 2012;156(4):291–304. doi:10.7326/0003-4819-156-4-201202210-00007.
- Sievenpiper JL. Sickeningly sweet: Does sugar cause chronic disease? No. Can J Diabetes. 2016;40(4):287–95. doi:10.1016/j.jcjd.2016.05.006.
- Hall KD, Sacks G, Chandramohan D, Chow CC, Wang YC, Gortmaker SL, Swinburn BA. Quantification of the effect of energy imbalance on bodyweight. Lancet. 2011;378(9793):826–37. doi:10.1016/S0140-6736(11)60812-X.
- Khan TA, Sievenpiper JL. Controversies about sugars: results from systematic reviews and meta-analyses on obesity, cardiometabolic disease and diabetes. Eur J Nutr. 2016;55(Suppl 2):25–43. doi:10.1007/s00394-016-1345-3.
- Sadler MJ, McNulty H, Gibson S. Sugar-fat seesaw: a systematic review of the evidence. Crit Rev Food Sci Nutr. 2015;55(3):338–56. doi:10.1080/10408398.2011.654013.
- Wang YF, Bellissimo N, Kitts DD, O’Brien HT, David Ma WL, Suh M, Luhovyy B, DiAngelo C, Pasut L, Marsden S, et al. Knowledge and perceptions of carbohydrates among nutrition-major and nutrition-elective undergraduate students in Canada. J Am Coll Nutr. 2021;40(2):164–71. doi:10.1080/07315724.2020.1750503.
- Wang F, Diangelo CL, Marsden SL, Pasut L, Kitts D, Bellissimo N. Knowledge of sugars consumption and the WHO sugars guideline among Canadian dietitians and other health professionals. Can J Diet Pract Res. 2020;81(3):142–5. doi:10.3148/cjdpr-2020-004.
- Brisbois TD, Marsden SL, Anderson GH, Sievenpiper JL. Estimated intakes and sources of total and added sugars in the Canadian diet. Nutrients. 2014;6(5):1899–912. doi:10.3390/nu6051899.
- Walton J, Bell H, Re R, Nugent AP. Current perspectives on global sugars consumption: definitions, recommendations, population intakes, challenges and future direction. Nutr Res Rev. 2021:1–62. doi:10.1017/S095442242100024X.
- Canadian Community Health Survey - Nutrition (CCHS). Detailed information for 2015. 2017. [accessed 2022 Apr 26]. https://www.canada.ca/en/health-canada/services/food-nutrition/food-nutrition-surveillance/health-nutrition-surveys/canadian-community-health-survey-cchs/reference-guide-understanding-using-data-2015.html?wbdisable=true.
- USDA. AMPM - USDA Automated Multiple-Pass Method. 2019. [accessed 2022 Apr 26]. https://www.ars.usda.gov/northeast-area/beltsville-md-bhnrc/beltsville-human-nutrition-research-center/food-surveys-research-group/docs/ampm-usda-automated-multiple-pass-method/.
- FAO of the United Nations. FAO guidelines for food balance sheets 2017. [accessed 2022 Apr 26]. http://www.fao.org/3/ca6404en/ca6404en.pdf.
- Shao Q, Chin KV. Survey of American food trends and the growing obesity epidemic. Nutr Res Pract. 2011;5(3):253–9. doi:10.4162/nrp.2011.5.3.253.
- Conrad Z, Chui K, Jahns L, Peters CJ, Griffin TS. Characterizing trends in fruit and vegetable intake in the USA by self-report and by supply-and-disappearance data: 2001-2014. Public Health Nutr. 2017;20(17):3045–50. doi:10.1017/S1368980017002385.
- Statistics Canada. Food Available in Canada. Table: 32-10-0054-01 [accessed 2022 Apr 26]. https://www150.statcan.gc.ca/t1/tbl1/en/tv.action?pid=3210005401.
- Wang YF, Chiavaroli L, Roke K, DiAngelo C, Marsden S, Sievenpiper J. Canadian adults with moderate intakes of total sugars have greater intakes of fibre and key micronutrients: Results from the Canadian community health survey 2015 public use microdata file. Nutrients. 2020;12(4):1124. doi:10.3390/nu12041124.
- USDA. Loss-adjusted food availability documentation. [accessed 2022 Apr 26]. https://www.ers.usda.gov/data-products/food-availability-per-capita-data-system/loss-adjusted-food-availability-documentation/.
- Statistics Canada. Canadian Food Statistics Methods and Data Sources. 2007. [accessed 2022 Apr 26]. http://www23.statcan.gc.ca/imdb-bmdi/document/3475_D1_T9_V2-eng.pdf.
- USDA. Food availability (per capita) data system. [accessed 2022 Apr 26]. https://www.canada.ca/en/health-canada/services/food-nutrition/healthy-eating/dietary-reference-intakes.html.
- McConnell MJ. U.S. caloric sweetener deliveries continue to decline on a per capita basis, driven by lower high-fructose corn syrup use. [accessed Apr 26]. https://www.ers.usda.gov/amber-waves/2019/december/us-caloric-sweetener-deliveries-continue-to-decline-on-a-per-capita-basis-driven-by-lower-high-fructose-corn-syrup-use/.
- Wittekind A, Walton J. Worldwide trends in dietary sugars intake. Nutr Res Rev. 2014;27(2):330–45. doi:10.1017/S0954422414000237.
- Powell ES, Smith-Taillie LP, Popkin BM. Added sugars intake across the distribution of US children and adult consumers: 1977-2012. J Acad Nutr Diet. 2016;116(10):1543–50 e1. doi:10.1016/j.jand.2016.06.003.
- World Health Organization. Guideline: sugars intake for adults and children; 2015. [accessed Apr 26]. https://www.who.int/publications/i/item/9789241549028.
- Liu S, Munasinghe LL, Ohinmaa A, Veugelers PJ. Added, free and total sugar content and consumption of foods and beverages in Canada. Health Rep. 2020;31(10):14–24.
- Langlois K, Garriguet D, Gonzalez A, Sinclair S, Colapinto CK. Change in total sugars consumption among Canadian children and adults. Health Rep. 2019;30(1):10–9.
- Jones AC, Kirkpatrick SI, Hammond D. Beverage consumption and energy intake among Canadians: analyses of 2004 and 2015 national dietary intake data. Nutr J. 2019;18(1):60. doi:10.1186/s12937-019-0488-5.
- Brand-Miller JC, Barclay AW. Declining consumption of added sugars and sugar-sweetened beverages in Australia: a challenge for obesity prevention. Am J Clin Nutr. 2017;105(4):854–63. doi:10.3945/ajcn.116.145318.
- Australian Bureau of Statistics. Apparent consumption of selected foodstuffs. Australia; 2022. [accessed Apr 26]. https://www.abs.gov.au/statistics/health/health-conditions-and-risks/apparent-consumption-selected-foodstuffs-australia/latest-release.
- Bandy LK, Scarborough P, Harrington RA, Rayner M, Jebb SA. Reductions in sugar sales from soft drinks in the UK from 2015 to 2018. BMC Med. 2020;18(1):20. doi:10.1186/s12916-019-1477-4.
- Canadian Foundation for Dietetic Research. Tracking Nutrition Trend Report 2018. [accessed 2022 Apr 26]. https://www.cfdr.ca/Sharing/Tracking-Nutrition-Trends.aspx.
- Goodman SP, Vanderlee LP, Jones AP, White CM, Hammond DP. Perceived healthiness of sweeteners among young adults in Canada. Can J Diet Pract Res. 2021;82(2):90–4. doi:10.3148/cjdpr-2020-030.
- Mintel. Sweeteners and attitudes toward sugar 2016. [accessed Apr 26]. https://store.mintel.com/report/sweeteners-and-attitudes-toward-sugar-canada-december-2016.
- Bernstein JT, Christoforou AK, Weippert M, L’Abbe MR. Reformulation of sugar contents in Canadian prepackaged foods and beverages between 2013 and 2017 and resultant changes in nutritional composition of products with sugar reductions. Public Health Nutr. 2020;23(16):2870–8. doi:10.1017/S1368980020001159.
- Bento A, Goncalves C, Cordeiro T, Vaz de Almeida MD. Portugal nutritional transition during the last 4 decades: 1974-2011. Porto Biomed J. 2018;3(3):e25. doi:10.1016/j.pbj.0000000000000025.
- Al Hasan SM, Saulam J, Kanda K, Murakami A, Yamadori Y, Mashima Y, Ngatu NR, Hirao T. Temporal trends in apparent energy and macronutrient intakes in the diet in Bangladesh: A joinpoint regression analysis of the FAO’s food balance sheet data from 1961 to 2017. Nutrients. 2020;12(8):2319. doi:10.3390/nu12082319.
- Berger N, Cummins S, Smith RD, Cornelsen L. Recent trends in energy and nutrient content of take-home food and beverage purchases in Great Britain: an analysis of 225 million food and beverage purchases over 6 years. BMJ Nutr Prev Health. 2019;2(2):63–71. doi:10.1136/bmjnph-2019-000036.
- Doggui R, Al-Jawaldeh H, El Ati J, Barham R, Nasreddine L, Alqaoud N, Aguenaou H, El Ammari L, Jabbour J, Al-Jawaldeh A, et al. Meta-analysis and systematic review of micro- and macro-nutrient intakes and trajectories of macro-nutrient supply in the eastern mediterranean region. Nutrients. 2021;13(5):1515. doi:10.3390/nu13051515.
- Gebremedhin S, Bekele T. Evaluating the African food supply against the nutrient intake goals set for preventing diet-related non-communicable diseases: 1990 to 2017 trend analysis. PLoS One. 2021;16(1):e0245241. doi:10.1371/journal.pone.0245241.
- Al Hasan SM, Saulam J, Mikami F, Kanda K, Ngatu NR, Yokoi H, Hirao T. Trends in per capita food and protein availability at the national level of the Southeast Asian countries: An analysis of the FAO’s food balance sheet data from 1961 to 2018. Nutrients. 2022;14(3):603. doi:10.3390/nu14030603.
- Statistics Canada. Nutrient Intakes from food; 2015. [accessed 2022 Apr 26]. https://www150.statcan.gc.ca/n1/pub/82-625-x/2017001/article/14830-eng.htm.
- Institute of Medicine. Dietary reference intakes. [accessed 2022 Apr 26]. https://www.canada.ca/en/health-canada/services/food-nutrition/healthy-eating/dietary-reference-intakes.html.
- Ricciuto L, Fulgoni VL, 3rd, Gaine PC, Scott MO, DiFrancesco L. Sources of added sugars intake among the U.S. population: Analysis by selected sociodemographic factors using the national health and nutrition examination survey 2011-18. Front Nutr. 2021;8:687643.
- Rana H, Mallet MC, Gonzalez A, Verreault MF, St-Pierre S. Free sugars consumption in Canada. Nutrients. 2021;13(5):1471. doi:10.3390/nu13051471.
- Serra-Majem L. Food availability and consumption at national, household and individual levels: implications for food-based dietary guidelines development. Public Health Nutr. 2001;4(2B):673–6. doi:10.1079/phn2001152.