
 ?Mathematical formulae have been encoded as MathML and are displayed in this HTML version using MathJax in order to improve their display. Uncheck the box to turn MathJax off. This feature requires Javascript. Click on a formula to zoom.
Abstract
Background
Most infectious diseases are caused by viruses, fungi, bacteria and parasites. Their ability to easily infect humans and trigger large-scale epidemics makes them a public health concern. Methods for early detection of these diseases have been developed; however, they are hindered by the absence of a unified, interoperable and reusable model. This study seeks to create a holistic and real-time model for swift, preliminary detection of infectious diseases using symptoms and additional clinical data.
Materials and methods
In this study, we present a medical knowledge graph (MKG) that leverages multiple data sources to analyse connections between different nodes. Medical ontologies were used to enhance the MKG. We applied various graph algorithms to extract key features. The performance of multiple machine-learning (ML) techniques for influenza and hepatitis detection was assessed, selecting multi-layer perceptron (MLP) and random forest (RF) models due to their superior outcomes. The hyperparameters of both graph-based ML models were automatically fine-tuned.
Results
Both the graph-based MLP and RF models showcased the least loss and error rates, along with the most specific, accurate recall, precision and F1 scores. Their Matthews correlation coefficients were also optimal. When compared with existing ML techniques and findings from the literature, these graph-based ML models manifested superior detection accuracy.
Conclusions
The graph-based MLP and RF models effectively diagnosed influenza and hepatitis, respectively. This underlines the potential of graph data science in enhancing ML model performance and uncovering concealed relationships in the MKG.
Introduction
The World Health Organization (WHO) [Citation1] identifies infectious diseases as significant public health challenges. Diseases like lower respiratory tract infections rank among the top 10 global causes of death. Fatalities often occur from contagious respiratory diseases like COVID-19 and influenza, which stem from viral infections. Especially vulnerable to complications from these diseases are the elderly and infants with chronic illnesses [Citation2].
The Coronaviridae family can lead to severe respiratory issues, including COVID-19, SARS and MERS [Citation3]. Influenza epidemics happen yearly due to the virus’ high mutation rate and infectiousness. Its symptoms can vary from mild to severe. There are four types of influenza viruses, A, B, C and D, but only A and B cause the yearly flu epidemics [Citation4].
Viral hepatitis, a liver infection, often causes symptoms such as yellow eyes and skin fatigue. The liver performs various functions, such as protein creation, toxin elimination and bile production [Citation5]. Because of this, hepatitis-induced inflammation can lead to liver dysfunction and health decline in infected individuals.
Early disease identification plays a vital role in enhancing patient care, controlling disease spread and preventing future outbreaks. Several issues have been identified in previous studies focused on diagnosing influenza [Citation6]. For instance, one problem is that the interpretability of the models has not been thoroughly examined [Citation7]. There is also a reliance on Twitter data, which may not accurately represent the entire population and does not support health conditions or diseases beyond influenza.
Studies may be limited by a small sample size, lack of diversity, and a narrow feature set, and findings may not be compared to other methods [Citation7,Citation8]. Similarly, a study with only 116 participants was conducted in a controlled environment, limiting its applicability to broader scenarios [Citation9]. Another case involves just 20 healthy adults, raising questions about the generalizability of its results [Citation10]. In one instance, a study used a wearable device to monitor heart rates and activity levels but did not compare its performance to other diagnostic tests for influenza [Citation11]. An issue was also found in another machine-learning (ML) model that applied synthetic patient data, rather than real patient data [Citation12] and necessitating further validation. Furthermore, another study requires further validation to confirm its accuracy and applicability to other populations [Citation13].
A study used graph neural networks to mimic human behaviour and identify symptoms of influenza using mobile sensing data [Citation14]. However, it relied on Bluetooth interactions as a measure of social proximity, which could introduce bias. The lack of a laboratory-confirmed influenza diagnosis was another downside.
Fuzzy logic provides the ability to represent uncertainty and imprecision in data, although it can become computationally complex, particularly with large and intricate datasets [Citation15]. An amalgamated model of linear support vector machine (SVM) and AdaBoost was developed using imbalanced datasets, yet it required further accuracy and sensitivity enhancements [Citation16]. Enhanced ensemble learning attained more dependable and consistent diagnostic results [Citation17]. However, its comparison to other cutting-edge methods and external validation were lacking. The random forest (RF) algorithm successfully predicted diseases with high accuracy, sensitivity and specificity [Citation18]. Despite this, its exclusive reliance on the hepatitis C dataset from the UCI library may limit its representativeness and completeness. The use of electronic health records (EHRs) and ML classifiers for predicting hepatitis C and cirrhosis diagnoses was found to be effective, but the study was limited by a small sample size of only 75 patients [Citation19]. Additionally, excluding other relevant features may undermine the model’s predictive accuracy. Although the research provided useful insights, potential biases or missing data could distort the findings [Citation20]. The main challenges include the need for substantial computing power and the difficulty of implementing and maintaining tailor-made models in real-world healthcare environments [Citation21]. Enhanced diagnostic capabilities for hepatitis based on a few features and effective class balancing with the synthetic minority over-sampling technique (SMOTE) strategy were among the reported benefits [Citation22]. Nevertheless, the study only investigated a limited assortment of classifiers without exploring alternate ML algorithms, leaving its general applicability on other datasets questionable. Lastly, the relatively small dataset size may restrict the findings’ generalizability and potentially affecting the ML algorithms’ performance [Citation23].
Researchers used artificial intelligence, ML and pathway enrichment analysis to identify virus-targeted cellular pathways. The study in [Citation24] proposed a two-step ML process for evaluating COVID-19 pathways: gene selection, network development, pathway ranking, and a thorough analysis of top pathways. Rapid identification of effective medications is crucial in preventing worldwide disease transmission. In [Citation25], researchers aimed to find human proteins that can bind to approved drugs. This approach was supported by human-virus protein–protein interactions (PPIs) and the biology of the host cell. They also identify topological and statistical features of proteins within the PPI network.
An entity-relation knowledge graph (KG) is a multi-dimensional graph where relationships (edges) and entities (nodes) illustrate the connections across various domains. Semantic Web technology provides a framework allowing for semantic interlinking, where data are annotated in a machine-readable format. This usually involves implementing ontologies, which provide a clear, formal representation of the domain’s knowledge.
This research applies a novel use of an existing methodology to generate MKG through intelligent health information retrieval [Citation26–28]. Previous studies have utilized MKG for disease diagnosis [Citation29–35] and drug analysis [Citation36,Citation37]. Additionally, the Graph-Guided Multi-Task Sparse Learning (GG-MTSL) model was employed to identify variations in the antigenic properties of the influenza A (H3N2) virus [Citation38]. A separate study constructed biological and PPI networks using graphs [Citation39]. These graphs are crucial for calculating substantial topological features. Ultimately, these features are incorporated into unsupervised learning algorithms to select genes relevant to SARS-CoV-2.
We developed an innovative method for creating the proposed medical knowledge graph (MKG) for viral infections, aiming to aid in early disease detection. This involved consolidating data from multiple sources into a unified graphical database. This integration culminated in a comprehensive MKG for COVID-19, influenza and hepatitis, simplifying the understanding of the complex relationships between the MKG nodes and boosting the proposed detection model’s performance. Our research reaffirms the utility of graph algorithms in extracting unique features from specific datasets. Furthermore, we highlight how graph-based ML can enhance detection model performance and unveil concealed connections.
Methods
Building medical knowledge graph
We created a comprehensive MKG for COVID-19, influenza and hepatitis following the methods outlined by Gao et al. [Citation40] and Chen et al. [Citation41]. The study integrates data from various sources, according to the graph model depicted in () and summarized in . Our goal is to identify the critical nodes and connections within this model. The import processes are illustrated in .
Figure 1. Schema of the proposed graph model.
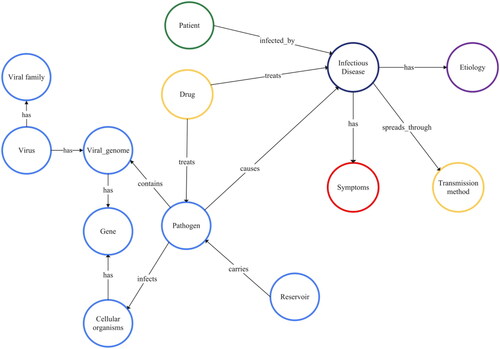
Table 1. Heterogeneous data implemented in the proposed MKG.
Table 2. Importing procedures for heterogeneous data into a graph model.
The graph model consists of 13 nodes and 14 edges, with one of the nodes representing a patient, as extrapolated from the dataset. This model utilizes a graph ML technique to sort patients with particular infectious diseases. The model provides comprehensive data relevant to the treatment and management of such diseases.
Each infectious disease illustrated in the graph has its causes, symptoms and methods of transmission. Infectious diseases are primarily transmitted via pathogens and reservoirs, which could be of animal, human or environmental origin.
Pathogens are microorganisms that cause diseases in living cells. Genes, the hereditary units of living cells, also significantly play a role in infection susceptibility. Certain pathogenic entities, known as viruses, contain a viral genome, granting them the power to infiltrate and infect living cells. A ‘viral genome,’ to elaborate, is a virus’s genetic content. Viruses are grouped based on shared traits under taxonomic classifications called ‘viral families.’
The relationship between drugs and pathogens involves drugs’ unique targeting of specific biological aspects of the pathogens and their effectiveness in treating the pathogens. The drugs are used to treat, prevent and control infectious diseases, depending on the specific pathogenic agent.
illustrates the method where a healthcare provider enters patient symptoms and clinical data into the MKG through an EHR at the point of care. Each node within the MKG represents a vertex and is connected to multiple graphs. We utilized this model to classify infectious diseases and fetch all related information from the connected graphs.
Figure 2. General schema of the proposed method.
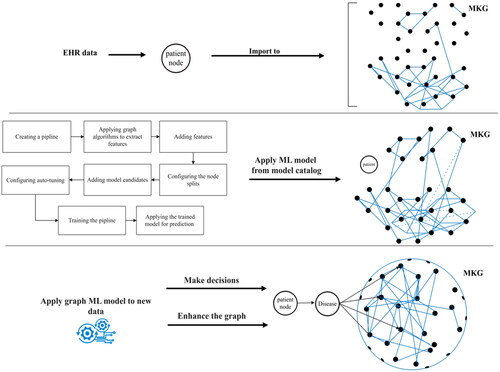
Medical providers can gain crucial insights such as disease complications and suitable therapies from the proposed MKG by using similarity algorithms like cosine similarity. After building the desired MKG, we created and applied a ML model for node classification on graphs of influenza and hepatitis datasets. We store the optimal prediction models in our model catalogue. For future utilization and training on new datasets, we preserve the model in our database. This entire process aids in decision-making and enhances the MKG.
The accuracy of our ML model’s predictions was enhanced by employing graph algorithms, including scale properties and Fast Random Projection (FastRP). Furthermore, automated hyperparameter tuning guaranteed optimal values for each hyperparameter, consequently maximizing the model’s predictive accuracy.
Influenza disease dataset
The dataset used in this study, which aimed to distinguish influenza from influenza-like illness (ILI), was based on records collected from both inpatients and outpatients over a span of five days [Citation57]. It consisted of 4569 entries and 16 features capturing symptoms and laboratory tests associated with influenza, along with a target feature for identifying infection.
The cross-sectional study included demographic, clinical and exposure data. Subjects were tested for influenza types A and B. provides a list of the 17 features, brief descriptions and their respective values.
Table 3. Features of the influenza dataset.
Datasets preprocessing
In the influenza dataset, a value of 0 denotes no infection, while a value of 1 signifies an influenza infection. The number of infected males, at 2487, was higher than the number of infected females, at 2082. Patients’ ages ranged from 1 to 60 years. The dataset included 3076 cases (67.32%) that were not infected and 1493 cases (32.68%) that were infected. The synthetic minority oversampling technique (SMOTE) was employed to balance the data in the influenza dataset due to the underrepresentation of the minority class. shows that five factors had a stronger association with the final flu result: age, malaise, chills, a runny nose, and a cough. To process this data, we converted all ‘yes’ values to 1 and all ‘no’ values to 0.
Table 4. Phi-values and p values for categorical features in the influenza dataset.
The calculated Pearson correlation coefficient (PCC) for age yields a value of 0.214051, suggesting a correlation with the target class, Flu Result. presents phi coefficient values and p values for other categorical features within the influenza dataset.
From , our findings indicated that gender, vaccination status, fever, diarrhoea, breathing issues, sore throat and headaches have no relation to the flu result. Contrastingly, features such as a cough, malaise, runny nose and chills share an association with flu results. This study exclusively focuses on signs and symptoms, therefore disregarding unrelated features such as injections and RT-PCR tests.
Hepatitis disease dataset
The hepatitis dataset, procured from the UC Irvine ML repository [Citation58], consists of 155 observations with 19 features and a target feature. This dataset is imbalanced, as 74% of patients survive while 26% die, posing a significant challenge to the classification process.
Datasets preprocessing
Just as we did with the influenza dataset, we utilized SMOTE for data balancing in the hepatitis dataset although the datasets do have a few missing data points, the most considerable absence is found in the prothrombin time (PROTIME) feature, where 67 data points are missing. This presents a significant 43% deficiency in the dataset. Other missing data points constitute less than 10% of the total dataset. Training a ML model using these incomplete datasets might significantly impact its quality.
Categorical features originally reflecting ‘yes’ or ‘no’ were changed to numeric values ‘1’ and ‘2’. displays hepatitis dataset features.
Table 5. Features of the hepatitis dataset.
We selected all continuous features correlated to the target feature, excluding the PROTIME feature due to its substantial missing values. The correlated features were determined by calculating PCCs. These correlated features are shown in .
Figure 3. Correlated features with class target feature.
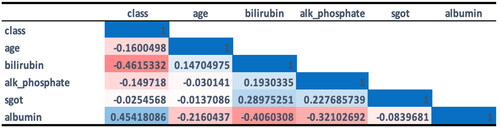
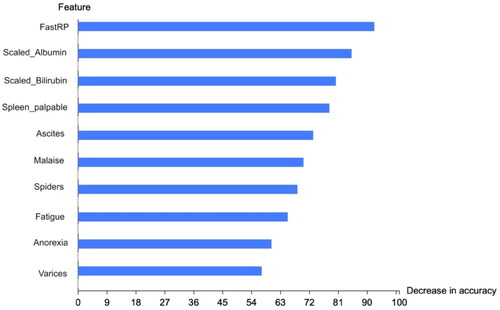
reveals that bilirubin and albumin are the features most closely correlated with the class category. Furthermore, we calculated the phi coefficient and p value (at p < .05) for other categorical features in the dataset, as shown in , to identify features associated with the target class. Our analysis indicated no significant correlations between gender, steroid usage, antivirals, liver size, liver firmness, histology and the target class. However, fatigue, malaise, loss of appetite (anorexia), palpable spleen, varices, spider nevi and ascites were found to have an association with the target class. These latter features were, therefore, chosen to train ML models throughout this study.
Table 6. Phi-values and p values for categorical features in the hepatitis dataset.
To mitigate the missing data problem in both datasets: for continuous variables (as we had non normal distribution) and for categorical variables, we substituted with the most common value (mode).
Infectious disease detection through node classification method
The graph ML method has been employed in numerous studies. For instance, it was utilized for the classification of diabetes [Citation59] and the investigation of Alzheimer’s disease [Citation60]. In this study, we conducted a binary node classification on a training graph. The goal was to classify unlabelled nodes for influenza and hepatitis based on the features of their fellow nodes.
The training pipeline started by enhancing the graph with newly extracted features, as well as the dataset’s existing features. This augmented graph was then employed to train our proposed model. Essentially, selected graph algorithms – FastRP and scaled properties – were used to create new node features.
Following this, a selection of the node features was used, with nodes split into training, testing and validation phases for the ML model. The process involved dividing the entire graph into two sections – training and testing. We also implemented a stratified 10-fold cross-validation on the training graph. This ensured that each partition contained training and validation sets and provided the necessary performance data. To conclude, the proposed model was employed to classify the unlabelled nodes.
The training process of the node classification pipeline implemented in [Citation61] was applied to detect influenza and hepatitis diseases in this study as indicated in Algorithm 1.
Algorithm 1
Training node classification pipeline
Require: Infectious disease dataset
Ensure: Split all dataset graphs into training and testing graphs
1: for All training graphs do
2: Divide into validation folds = k
3: for Each cross-validation evaluation do
4: Strati ed training graphs
5: for All train and validation parts ∈Validation folds do
6: Train on training sets
7: Evaluate on validation sets
8: if Performance metrics are the best for a model candidate then
9: Select the winning model hyperparameters
10: else
11: Select other values for hyperparameters
12: end if
13: end for
14: end for
15: end for
16: for Winning model candidate do
17: Retrain on entire training graph
18: Evaluate on testing graph
19: Retrain on entire original graph
20: if Performance metrics are the best for a model candidate then
21: Return winning model registration
22: Return performance metrics
23: Save models in a model catalog
24: Apply the model for new prediction
25: else
26: Select other values for k and for hyperparameters
27: end if
28: end for
Results
Applying the graph-based model for influenza and hepatitis detection
The multi-layer perceptron (MLP) model was used to train 4569 nodes of an influenza dataset. We used the hold-out method for node classification, dividing the graph into training and testing subgraphs, comprising 80% and 20%, respectively. The training graph was then subjected to a stratified 10-fold cross-validation.
Features extracted from the FastRP and scale property algorithms were included in the training, along with node properties – a subset of the influenza dataset features. We sought to identify a target feature indicating whether a patient was infected with influenza.
As part of the training process, the MLP model underwent automatic tuning to determine optimal hyperparameter values. sets out the results from this tuning process, detailing the best maximum and minimum epochs, patience and tolerance, learning rate, batch size, penalty, hidden layer sizes and class weights.
Table 7. Values for hyperparameters automatic tuning results.
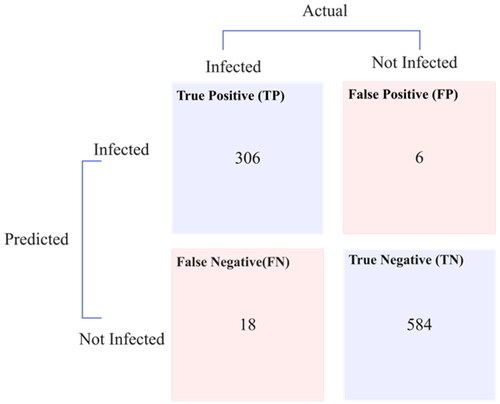
An average training accuracy of 98.62% and a weighted average F1 score of 0.975 were achieved with the MLP model in training. Additionally, the trained model was used to detect unclassified patient nodes in the testing graph. This was achieved using a sigmoid activation and a cross-entropy loss function, the latter also known as logarithmic loss. presents the confusion matrix for the testing graph.
Figure 4. Influenza testing graph confusion matrix.
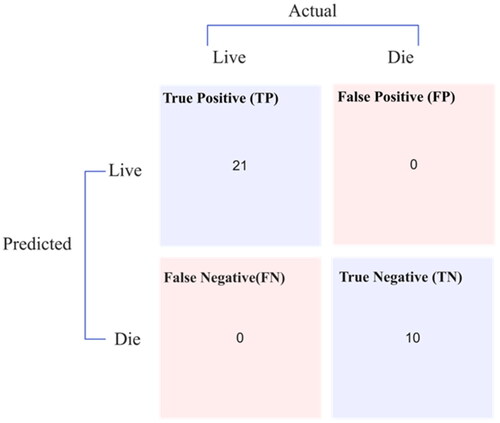
The RF model, trained on 155 nodes from the hepatitis dataset, employed a hold-out method that split each dataset’s graph into subgraphs for training (80%) and testing (20%). The training graph underwent a 10-fold stratified cross-validation. The training incorporated features were extracted by the FastRP and scale property algorithms, commencing with node properties, a subset of the dataset’s characteristics. Through training, the method conducts automatic tuning on the ML model to identify ideal hyperparameter values, with detailing the optimal hyperparameters determined. The RF model achieved a perfect accuracy of 100% and a weighted average F1 score of 0.999 in average training. Furthermore, the trained ML model was applied to predict infection and classify previously unidentified patient nodes in the testing graphs, depicted in .
Figure 5. Hepatitis testing graph confusion matrix.
presents the statistical parameters for the graph MLP and RF classifiers when applied to influenza and hepatitis datasets, as derived from their respective confusion matrices. The MLP model demonstrated a latency of 6001 ms, while the RF model indicated a lower latency of 4001 ms. Their performance was further evaluated using the Matthews correlation coefficient (MCC), with values approaching or equal to one suggesting successful classification. Another testament to the efficacy of these models is the log loss, which was calculated to be near zero, as well as the error rate, which was precisely zero, further establishing their accuracy and reliability.
Table 8. Performance values for the graph ML models.
Efforts have been extensive in detecting influenza and hepatitis. This study enhances such efforts by automatically fine-tuning MLP and RF models. We leveraged the feature permutation importance method to identify the model’s most critical features in and that highlight the key features affecting the proposed graph ML models’ accuracy. FastRP is the most influential feature, followed by scaled features. Not including these features significantly diminishes the model’s accuracy, as they provide crucial information.
Figure 6. Most significant features of the graph MLP model.
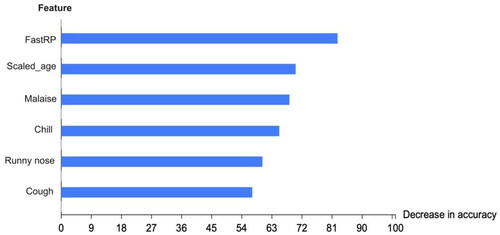
Figure 7. Most significant features of the graph RF model.
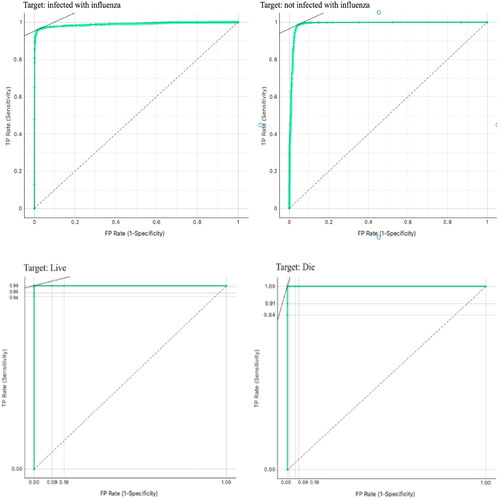
Furthermore, displays the results of the receiver operating curve (ROC) analysis for the proposed graph MLP and RF models. Both models achieved nearly perfect scores, with their areas under the curve being close to one.
Figure 8. Testing graph ROC curve analysis for both classes in the datasets.
Exploring various relations in the proposed MKG
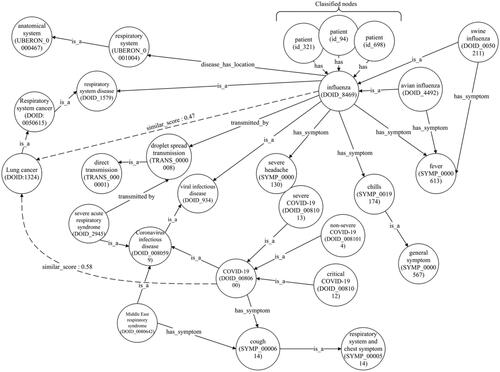
The cosine similarity algorithm was employed, revealing numerous links between nodes in the complete MKG. displays a notable connection between the lung cancer node and the graphs for COVID-19 and influenza. This suggests an increased likelihood of lung cancer due to influenza exposure, which could be worsened by recurrent exposure, as described in [Citation62]. However, unreliable data on smoking may introduce confounding factors, necessitating more research to definitively establish the link between influenza and lung cancer. Moreover, it is possible that SARS-CoV-2 shares pathophysiological traits similar to an oncovirus found in the lung. The authors of [Citation63] summarized three potential cancer-causing mechanisms of SARS-CoV-2 that could contribute to the occurrence of lung cancer.
Figure 9. Exploring the possibility of lung cancer in the MKG.
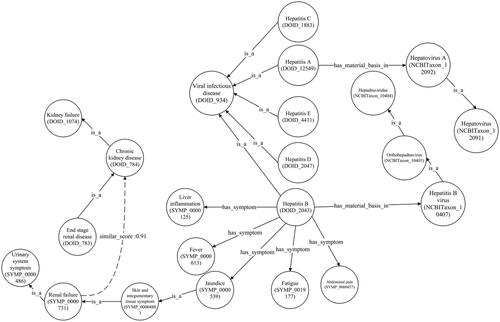
illustrates a newly discovered correlation between renal failure and chronic kidney disease. This profound connection was unearthed from the hepatitis B node in the hepatitis graph with the disease in the anatomical entity graph. Furthermore, this connection has been substantiated [Citation64], showing renal failure as a possible outcome of advanced chronic kidney disease stages.
Figure 10. Chronic kidney disease and hepatitis B relation.
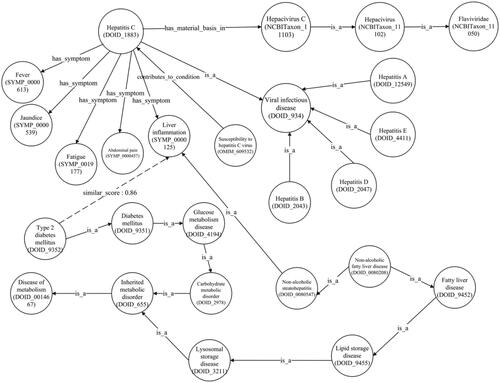
illustrates a newly established correlation between hepatitis C and type 2 diabetes mellitus, as proven in the MKG [Citation65]. The liver plays an indispensable role in glucose metabolism and insulin regulation. Nonetheless, a hepatitis C infection can interfere with these metabolic processes, triggering insulin resistance and flawed glucose management.
Figure 11. Type 2 diabetes mellitus disease and hepatitis C relation.
displays an additional segment of the influenza graph. While most individuals recover from influenza within days, some may develop serious complications like bacterial pneumonia. Certain complications, including myocarditis (heart inflammation), myositis and rhabdomyolysis (muscle tissue inflammation), encephalitis (brain inflammation) and multiorgan failure, such as respiratory and kidney failures, can be fatal. Medications such as Xofluza (baloxavir marboxil), Tamiflu (oseltamivir phosphate), Relenza (zanamivir) and Rapivab (peramivir) are used for treating types A and B of influenza. shows classified patient nodes for both influenza and hepatitis diseases.
Figure 12. Part of influenza graph for different treatment medicine.
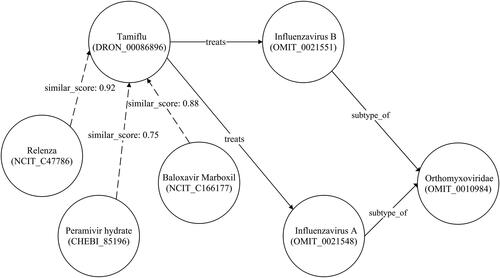
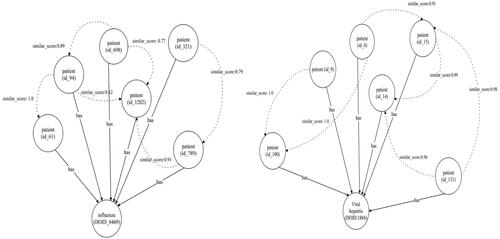
Figure 13. Classified nodes infected with influenza and hepatitis diseases.
Discussion
Comparison between machine-learning algorithms
We evaluated nine ML algorithms: K-nearest neighbors (KNN), decision tree (DT), SVM, stochastic gradient descent (SGD), RF, MLP, naive Bayes, logistic regression (LR) and AdaBoost. The comparison of these ML algorithms’ performance on the influenza and hepatitis datasets is presented in and . Because the MLP and RF models outperformed the others, we chose them.
Table 9. Comparison between detection performances of various ML algorithms for the influenza dataset.
Table 10. Comparison between detection performances of various ML algorithms for the hepatitis dataset.
Feature extraction process
In this study, we analysed features selected for the influenza and hepatitis datasets. Additionally, we included crucial features obtained through the FastRP and scale properties algorithms.
Fast Random Projection algorithm
The performance of graph ML can be improved using the FastRP method. This method efficiently reduces the graph data’s dimensions while preserving the essential structural information. Even with sparse datasets such as those of influenza and hepatitis, the FastRP algorithm proves to be highly efficient. It excellently reduces network data dimensions while retaining key structural details. Thus, the use of the FastRP algorithm enables enhanced performance in graph ML.
To apply the FastRP algorithm [Citation66], we first calculated node similarity. This algorithm assesses a group of nodes in reference to the connected nodes within a graph. We measured pairwise similarities using the Jaccard metric, which calculates the similarity by dividing the intersection size of two node sets by the size of their union, as per the given formula:
(1)
(1)
The FastRP was obtained through the following steps:
The Jaccard similarity results were used to obtain node similarity matrix
Dimensionality reduction (random projection matrix) was performed through:
The final matrix was obtained by multiplying the transition, normalization and random projection matrices. The end result was a combination of random projection matrices from all stages, each enhanced by a specific factor to determine its individual strength.
Scale properties algorithm
We used a scale properties algorithm to preprocess node features prior to model training. This determined the range and distribution of the processed data. This is particularly relevant when dealing with datasets featuring a wide range of values, such as the ‘age’ feature in the influenza dataset, or those skewed towards specific values, like the ‘albumin’ and ‘bilirubin’ features in the hepatitis dataset used for our study. These features are scaled using the MinMaxScaler.
(4)
(4)
The vector ‘p’ holds all the feature values for a single feature across all nodes in a graph. This method normalizes the data to a specific range, typically 0–1, by subtracting the minimum value from each data point and dividing the result by the range. The MinMaxScaler is particularly useful for normalizing features on different scales. It ensures uniform minimum and maximum values across all features, keeping the data tidy and well-organized. The MinMaxScaler offers several advantages; it maintains consistent feature values and handles outliers more effectively than standard methods. By setting the lowest and highest data points as 0 and 1, it diminishes the impact of extreme values on scaling. Furthermore, the MinMaxScaler preserves the original data range, making the scaled features easier to understand.
In this study, we implemented a MinMaxScaler for our proposed graph-based ML model. This is to retain the structure of the original distribution and interpret the scaled features’ impact on the target variable. It is also necessary for eliminating bias, achieving balanced, normalized presentations and enhancing the model’s performance. These scaled features influence the model’s efficacy based on dataset attributes and activation functions.
In our graph-based ML model, the magnitude of the input features affects the network’s weights and biases. If features vary in size, larger ones may disrupt the learning process, leading to subpar performance. By normalizing features to a consistent range, we ensure equal learning impact across the board.
Multi-layer perception model
The MLP model is a feedforward neural network employed for classifying or labelling nodes in a graph. It consists of multiple interconnected layers that modify incoming data. The first layer, known as the input layer, integrates the features from the graph. The following hidden layers perform non-linear transformations to extract significant features from the input data. The final layer, or the output layer, creates a probability distribution for each node across all possible labels. The MLP is a supervised learning method that learns the following functions:
(5)
(5)
where x is the input neuron, w is the weight and b is the bias. The sigmoid function is an activation function and is expressed as:
(6)
(6)
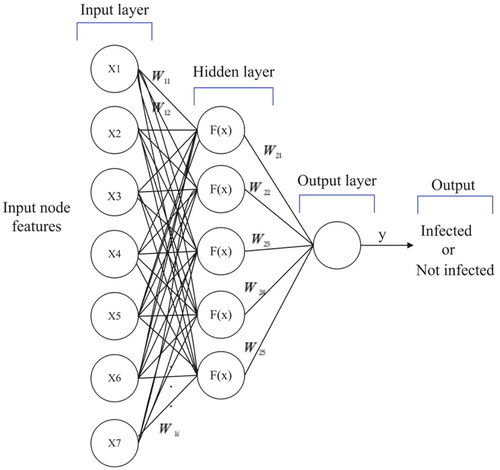
illustrates the structure of our uncomplicated graph-based MLP model implemented in this research. For classifying nodes, the model uses seven node features (age, malaise, chills, runny nose and cough) and two additional features (FastRP and scaled age) as inputs. It has one hidden layer with five neurons. The model identifies each class – infected or uninfected – via an output layer with a single neuron and utilizes a sigmoid activation function.
Figure 14. The architecture of the proposed graph MLP model for binary classification.
Random forest model
The Ensemble Learning RF model is a widely used, supervised ML method. This method integrates multiple predictors, deploying numerous DTs that are individually trained on unique sections of the training data. Each tree’s prediction is then collected into a single, unified forecast. Importantly, training each DT independently aids in preventing overfitting. Classification using the RF model is presented in EquationEquation (7)(7)
(7) .
(7)
(7)
EquationEquation (7)(7)
(7) begins with a random selection of a bootstrap sample from the training dataset. These bootstrap data are then analysed using an RF tree. Each tree’s final node is assigned a random variable. Subsequently, the ideal variable for splitting is chosen, dividing the node into two. This procedure is repeated for all terminal nodes in the tree until their size is minimized. Finally, the ensemble of trees and the predicted class of the RF tree are generated as outputs. In the RF model for graphs, we have several hyperparameters that need adjustment to balance training speed and memory utilization, as well as bias and variance.
Predicting relationships in the proposed MKG
After importing all the data, we use a KNN graph algorithm to identify key features for each node in the graph, and then we write these values back into the proposed MKG.
K-Nearest neighbors algorithm
The similarity algorithm proposed by Dong et al. [Citation67] calculates distance values for all paired nodes in a graph, establishing new connections between each node and its closest neighbors. In our study, we used the FastRP feature to determine the similarity measure for the KNN algorithm.
Cosine similarity
We used cosine similarity to identify similar nodes in the MKG due to the FastRP feature being a floating-point number. Calculated by determining the cosine of the angle between two vectors, it establishes whether the vectors point in the same direction, as shown in the following equation:
(8)
(8)
EquationEquation (8)(8)
(8) shows the vectors’ dot product divided by the product of their lengths. The above algorithm yields a score between [–1]. Score = (score + 1)/2 is used to standardize the score into the range [0, 1].
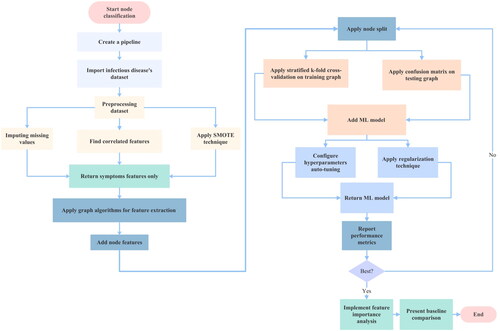
The flowchart in illustrates the research process used to mitigate overfitting and demonstrate the generalizability of the graph-based ML model by handling the dataset effectively. The node classification process begins with pipeline creation. We first import and preprocess an infectious diseases dataset, then manually apply graph algorithms. FastRP is used in this study because our dataset graphs are sparse, and we use scaled properties to prevent biased results from certain features. Next, we add node features and split the nodes into training and testing graphs. The training graph is further divided into training and validation graphs, on which we perform stratified k-fold cross-validation. For testing graphs, we utilize a confusion matrix. Automatic hyperparameter tuning and regularization techniques like L1, L2, and the dropout method are implemented. The necessary performance metrics and feature importance analysis are generated for the optimal graph ML model. Finally, we compare our results with other related studies.
Figure 15. Flowchart of the proposed method.
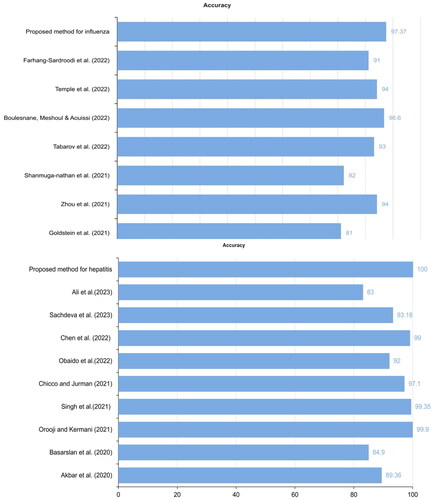
illustrates that our proposed graph MLP and RF models surpassed other models from related studies in accuracy. It is evident from that we achieved better accuracy in influenza detection compared to previous best model [Citation11]. Moreover, we achieved superior accuracy for hepatitis detection than [Citation18], as they achieved 99.9% with the RF model and the same dataset.
Figure 16. Comparison between the graph-based ML models and other related studies.
Strengths and limitations
Our study boasts several advantages. First, it uses graph algorithms for node embedding (FastRP) and scale properties to obtain additional features. These extracted features aptly represent the nodes as vectors while preserving the graph’s structure. The use of vertex embeddings simplifies the task of classifying similar patients. The graph ML model achieves convergence considerably quicker with feature scaling than without it, preventing premature saturation. Moreover, the study incorporates an automatic hyperparameter tuning procedure, requiring mere milliseconds to present all results. The employment of graph-based ML allows the fusion of heterogeneous data, enhancing the performance of ML models. We ensure the inclusion of all crucial features in the datasets.
However, our research does have certain limitations. First, medical practitioners could further this field by adopting our graph model in conjunction with large and live datasets. Second, although the primary features in our datasets are signs and symptoms, incorporating more features from diverse sources could yield higher effectiveness. Notably, laboratory data and radiology reports comprise valuable data in EHRs that can enhance the reliability of diagnoses in clinical settings. Furthermore, our research is confined to viral infectious diseases, warranting trials for bacterial, fungal and parasitic diseases. Lastly, handling large graphs presents a challenge but can be overcome by using a large-scale distributed graph data method.
Conclusions
This study enhanced the detection of influenza and hepatitis diseases using graph ML models. The proposed MKG was built using a variety of data sources, including HDO, KEGG, Wikidata, COVID-19, influenza ontology and hepatitis ontology. These diverse data sources aid in understanding various relationships within the MKG, such as infectious agents, hosts, treatments, complications and other key aspects. To extract additional features from the influenza and hepatitis datasets, we employed graph algorithms. The graph ML models we proposed outperformed other ML algorithms tested on the same dataset. We used cosine similarity algorithms to discover relationships.
Future studies could explore different graph algorithms and data collection techniques. We aim to create a link prediction ML model that will identify key relationships from the MKG using diverse graph algorithms. Furthermore, we plan on developing a graph-based ML model that can differentiate between infectious diseases with similar symptoms. This study enhances research that combines graph theory and artificial intelligence for early detection of infectious diseases.
Author contributions
The conceptualization and design were done by Eman Alqaissi, Fahd Alotaibi and Muhammad Sher Ramzan. The manuscript was initially drafted by Eman Alqaissi and afterward revised by Fahd Alotaibi, Muhammad Sher Ramzan and Abdulmohsen Algarni to ensure intellectual content. All authors of this article have provided approval for the final version to be published and agreed to take accountability for all parts of the work.
Disclosure statement
No potential conflict of interest was reported by the author(s).
Data availability statement
Influenza Dataset is available at Dryad: https://datadryad.org/stash/dataset/doi:10.5061/dryad.t7n48
Hepatitis dataset is available at UC Irvine: https://archive.ics.uci.edu/dataset/46/hepatitis
Code data available at: https://github.com/EMANaLQAISSI/MKG.git
Additional information
Funding
References
- World Health Organization. The top 10 causes of death; 2020; [cited 2023 May 3]. Available from: https://www.who.int/news-room/fact-sheets/detail/the-top-10-causes-of-death
- Centers for Diseases Control and Prevention (CDC). Epidemic and pandemic, 2022; 2022; [cited 2022 Aug 1]. Available from: https://www.cdc.gov/
- Mosharaf MP, Reza MS, Kibria MK, et al. Computational identification of host genomic biomarkers highlighting their functions, pathways and regulators that influence SARS-CoV-2 infections and drug repurposing. Sci Rep. 2022;12(1):1. doi: 10.1038/s41598-022-08073-8.
- Krammer F, Smith GJD, Fouchier RAM, et al. Influenza. Nat Rev Dis Primers. 2018;4(1):3. doi: 10.1038/s41572-018-0002-y.
- Ali Pambuk CI. Viral hepatitis: implication of viral types from A to E. Am J Biomed Sci Res. 2019;4(6):442–20. doi: 10.34297/AJBSR.2019.04.000852.
- Dai S, Han L. Influenza surveillance with Baidu index and attention-based long short-term memory model. PLOS One. 2023;18(1):e0280834. doi: 10.1371/journal.pone.0280834.
- Shanmuganathan V, Yesudhas HR, Madasamy K, et al. AI based forecasting of influenza patterns from twitter information using random forest algorithm. Hum Cent Comput Inform Sci. 2021;11:33. doi: 10.22967/HCIS.2021.11.033.
- Kolbeinsson A, Gade P, Kainkaryam R, et al. Self-supervision of wearable sensors time-series data for influenza detection; 2021. Available from: http://arxiv.org/abs/2112.13755
- Goldstein N, Eisenkraft A, Arguello CJ, et al. Exploring early pre-symptomatic detection of influenza using continuous monitoring of advanced physiological parameters during a randomized controlled trial. J Clin Med. 2021;10(21):5202. doi: 10.3390/jcm10215202.
- Temple DS, Hegarty-Craver M, Furberg RD, et al. Wearable sensor-based detection of influenza in presymptomatic and asymptomatic individuals. J Infect Dis. 2022;227(7):864–872. doi: 10.1093/infdis/jiac262.
- Boulesnane A, Meshoul S, Aouissi K. Influenza-like illness detection from Arabic Facebook posts based on sentiment analysis and 1D convolutional neural network. Mathematics. 2022;10(21):4089. doi: 10.3390/math10214089.
- Farhang-Sardroodi S, Ghaemi MS, Craig M, et al. A machine learning approach to differentiate between COVID-19 and influenza infection using synthetic infection and immune response data. Math Biosci Eng. 2022;19(6):5813–5831. doi: 10.3934/mbe.2022272.
- Zhou X, Wang Z, Li S, et al. Machine learning-based decision model to distinguish between covid-19 and influenza: a retrospective, two-centered, diagnostic study. Risk Manag Healthc Policy. 2021;14:595–604. doi: 10.2147/RMHP.S291498.
- Dong G, Cai L, Datta D, et al. Influenza-like symptom recognition using mobile sensing and graph neural networks. In: Ghassemi M, Naumann T, Pierson E, editors. ACM CHIL 2021 – Proceedings of the 2021 ACM Conference on Health, Inference, and Learning; 2021 Apr 8–10; Virtual event; New York; Association for Computing Machinery, Inc; 2021. p. 291–300. doi: 10.1145/3450439.3451880.
- Basarslan MS, Bakir H, Yücedağ I. Fuzzy logic and correlation-based hybrid classification on hepatitis disease data set. In: Xhafa F, editor. Lecture notes on data engineering and communications technologies. Berlin (Germany): Springer Science and Business Media Deutschland GmbH; 2020. p. 787–800. doi: 10.1007/978-3-030-36178-5_68.
- Akbar W, Wu WP, Saleem S, et al. Development of hepatitis disease detection system by exploiting sparsity in linear support vector machine to improve strength of AdaBoost ensemble model. Mob Inform Syst. 2020;2020(3):1–9. doi: 10.1155/2020/8870240.
- Singh A, Mehta JC, Anand D, et al. An intelligent hybrid approach for hepatitis disease diagnosis: combining enhanced k-means clustering and improved ensemble learning. Expert Syst. 2021;38:e12526. doi: 10.1111/exsy.12526.
- Orooji A, Kermani F. Machine learning based methods for handling imbalanced data in hepatitis diagnosis. Front Health Inform. 2021;10(1):57. doi: 10.30699/fhi.v10i1.259.
- Chicco D, Jurman G. An ensemble learning approach for enhanced classification of patients with hepatitis and cirrhosis. IEEE Access. 2021;9:24485–24498. doi: 10.1109/ACCESS.2021.3057196.
- Obaido G, Ogbuokiri B, Swart TG, et al. An interpretable machine learning approach for hepatitis B diagnosis. Appl Sci. 2022;12(21):11127. doi: 10.3390/app122111127.
- Chen L, Ji P, Ma Y. Machine learning model for hepatitis C diagnosis customized to each patient. IEEE Access. 2022;10:106655–106672. doi: 10.1109/ACCESS.2022.3210347.
- Sachdeva RK, Bathla P, Rani P, et al. A systematic method for diagnosis of hepatitis disease using machine learning. Innov Syst Softw Eng. 2023;19(1):71–80. doi: 10.1007/s11334-022-00509-8.
- Ali AM, Hassan MR, Aburub F, et al. Explainable machine learning approach for hepatitis C diagnosis using SFS feature selection. Machines. 2023;11(3):391. doi: 10.3390/machines11030391.
- Taheri G, Habibi M. Comprehensive analysis of pathways in coronavirus 2019 (COVID-19) using an unsupervised machine learning method. Appl Soft Comput. 2022;128:109510. doi: 10.1016/j.asoc.2022.109510.
- Habibi M, Taheri G. Topological network based drug repurposing for coronavirus 2019. PLOS One. 2021;16(7):e0255270. doi: 10.1371/journal.pone.0255270.
- Yu T, Li J, Yu Q, et al. Knowledge graph for TCM health preservation: design, construction, and applications. Artif Intell Med. 2017;77:48–52. doi: 10.1016/j.artmed.2017.04.001.
- Kamdar MR, Stanley CE, Carroll M, et al. Text snippets to corroborate medical relations: an unsupervised approach using a knowledge graph and embeddings. AMIA Jt Summits Transl Sci Proc. 2020;2020:288–297.
- Michel F, Gandon F, Ah-Kane V, et al. Covid-on-the-web: knowledge graph and services to advance COVID-19 research. In: Pan JZ, Tamma V, d’Amato C, et al., editors. The semantic web – ISWC 2020. Cham: Springer International Publishing; 2020. p. 294–310.
- Liu P, Wang X, Sun X, et al. HKDP: a hybrid knowledge graph based pediatric disease prediction system. In: Xing C, Zhang Y, Liang Y, editors. International Conference on Smart Health; 2016 Dec 24–25; Haikou, China. Cham (Switzerland): Springer; 2016. doi: 10.1007/978-3-319-59858-1_8
- Li X, Wang Y, Wang D, et al. Improving rare disease classification using imperfect knowledge graph. In: Lu Z, Yang C, editors. 2019 IEEE International Conference on Healthcare Informatics (ICHI); June 10–13; Xi’an, China. New York:IEEE; 2019. p. 1–2. doi: 10.1109/ICHI.2019.8904588.
- Feng S, Ning H, Yang S, et al. Geriatric disease reasoning based on knowledge graph. Commun Comput Inform Sci. 2019;2019:452–465.
- Heilig N, Kirchhoff J, Stumpe F, et al. Refining diagnosis paths for medical diagnosis based on an augmented knowledge graph. arXiv; abs/2204.1; 2022.
- Wang L, Xie H, Han W, et al. Construction of a knowledge graph for diabetes complications from expert-reviewed clinical evidences. Comput Assist Surg. 2020;25(1):29–35. doi: 10.1080/24699322.2020.1850866.
- Li Q, Li L, Zhong J, et al. Real-time sepsis severity prediction on knowledge graph deep learning networks for the intensive care unit. J Vis Commun Image Represent. 2020;72:102901. doi: 10.1016/j.jvcir.2020.102901.
- Jiang J, Wang H, Xie J, et al. Medical knowledge embedding based on recursive neural network for multi-disease diagnosis. Artif Intell Med. 2020;103:101772. doi: 10.1016/j.artmed.2019.101772.
- Dai Y, Guo C, Guo W, et al. Drug–drug interaction prediction with Wasserstein adversarial autoencoder-based knowledge graph embeddings. Brief Bioinform. 2021;22(4):e2. doi: 10.1093/bib/bbaa256.
- Mohamed SK, Nováček V, Nounu A. Discovering protein drug targets using knowledge graph embeddings. Bioinformatics. 2020;36(2):603–610. doi: 10.1093/bioinformatics/btz600.
- Han L, Li L, Wen F, et al. Graph-Guided Multi-Task Sparse Learning model: a method for identifying antigenic variants of influenza A (H3N2) virus. Bioinformatics. 2019;35(1):77–87. doi: 10.1093/bioinformatics/bty457.
- Taheri G, Habibi M. Identification of essential genes associated with SARS-CoV-2 infection as potential drug target candidates with machine learning algorithms. Sci Rep. 2023;13(1):15141. doi: 10.1038/s41598-023-42127-9.
- Gao M, Lu J, Chen F. Medical knowledge graph completion based on word embeddings. Information. 2022;13(4):205. doi: 10.3390/info13040205.
- Chen C, Ross KE, Gavali S, et al. COVID-19 knowledge graph from semantic integration of biomedical literature and databases. Bioinformatics. 2021;37(23):4597–4598. doi: 10.1093/bioinformatics/btab694.
- Schriml LM, Munro JB, Schor M, et al. The human disease ontology 2022 update. Nucleic Acids Res. 2022;50(D1):D1255–D1261. doi: 10.1093/nar/gkab1063.
- Bioportal. Influenza ontology; 2015 [updated 2015 Aug 20; cited 2023 Feb 28]. Available from: https://bioportal.bioontology.org/ontologies/FLU
- Bioportal. Hepatitis ontology; 2022 [updated 2022 Nov 30; cited 2023 Nov 25]. Available from: https://bioportal.bioontology.org/ontologies/SYMP?p=summary
- Kanehisa M, Furumichi M, Sato Y, et al. KEGG: integrating viruses and cellular organisms. Nucleic Acids Res. 2021;49(D1):D545–D551. doi: 10.1093/nar/gkaa970.
- Waagmeester A, Stupp G, Burgstaller-Muehlbacher S, et al. Wikidata as a knowledge graph for the life sciences. Elife. 2020;9:e52614. doi: 10.7554/eLife.52614.
- Chen Q, Allot A, Lu Z. LitCovid: an open database of COVID-19 literature. Nucleic Acids Res. 2020;49(D1):D1534–D1540. doi: 10.1093/nar/gkaa952.
- Wang LL, Lo K, Chandrasekhar Y, et al. CORD-19: the covid-19 open research dataset. arXiv; 2020. Available from: http://www.ncbi.nlm.nih.gov/pubmed/32510522%0Ahttp://www.pubmedcentral.nih.gov/articlerender.fcgi?artid=PMC7251955
- Raybould MIJ, Kovaltsuk A, Marks C, et al. CoV-AbDab: the coronavirus antibody database. Bioinformatics. 2021;37(5):734–735. doi: 10.1093/bioinformatics/btaa739.
- Szklarczyk D, Gable AL, Lyon D, et al. STRING v11: protein–protein association networks with increased coverage, supporting functional discovery in genome-wide experimental datasets. Nucleic Acids Res. 2019;47(D1):D607–D613. doi: 10.1093/nar/gky1131.
- Apweiler R, Bairoch A, Wu CH, et al. UniProt: the universal protein knowledgebase. Nucleic Acids Res. 2004;32(Database issue):D115–D119. doi: 10.1093/nar/gkh131.
- Wishart DS, Feunang YD, Guo AC, et al. DrugBank 5.0: a major update to the DrugBank database for 2018. Nucleic Acids Res. 2018;46(D1):D1074–D1082. doi: 10.1093/nar/gkx1037.
- Wei C-H, Allot A, Leaman R, et al. PubTator central: automated concept annotation for biomedical full text articles. Nucleic Acids Res. 2019;47(W1):W587–W593. doi: 10.1093/nar/gkz389.
- Ren J, Li G, Ross K, et al. iTextMine: integrated text-mining system for large-scale knowledge extraction from the literature. Database. 2018;2018:bay128. doi: 10.1093/database/bay128.
- Rosemblat G, Shin D, Kilicoglu H, et al. A methodology for extending domain coverage in SemRep. J Biomed Inform. 2013;46(6):1099–1107. doi: 10.1016/j.jbi.2013.08.005.
- Huang H, Arighi CN, Ross KE, et al. iPTMnet: an integrated resource for protein post-translational modification network discovery. Nucleic Acids Res. 2018;46(D1):D542–D550. doi: 10.1093/nar/gkx1104.
- Anderson KB, Simasathien S, Watanaveeradej V, et al. Clinical and laboratory predictors of influenza infection among individuals with influenza-like illness presenting to an urban Thai hospital over a five-year period. PLOS One. 2018;13(3):e0193050. doi: 10.1371/journal.pone.0193050.
- Blake CL, Merz CJ. Hepatitis dataset; 1998. Available from: https://Archive.Ics.Uci.Edu/Ml/Datasets/Hepatitis
- Rudd JM. Application of support vector machine modeling and graph theory metrics for disease classification. Mod Assist Stat Appl. 2018;13(4):341–349. doi: 10.3233/MAS-180444.
- Jalili M. Graph theoretical analysis of Alzheimer’s disease: discrimination of AD patients from healthy subjects. Inf Sci. 2017;384:145–156. doi: 10.1016/j.ins.2016.08.047.
- Alqaissi E, Alotaibi F, Ramzan MS. Graph data science and machine learning for the detection of COVID-19 infection from symptoms. PeerJ Comput Sci. 2023;9:e1333. doi: 10.7717/peerj-cs.1333.
- Weng C-F, Chen L-J, Lin C-W, et al. Association between the risk of lung cancer and influenza: a population-based nested case-control study. Int J Infect Dis. 2019;88:8–13. doi: 10.1016/j.ijid.2019.07.030.
- Khiali S, Rezagholizadeh A, Entezari-Maleki T. SARS-CoV-2 and probable lung cancer risk. Bioimpacts. 2022;12(3):291–292. doi: 10.34172/bi.2022.23266.
- Du Y, Zhang S, Hu M, et al. Association between hepatitis B virus infection and chronic kidney disease: a cross-sectional study from 3 million population aged 20 to 49 years in rural China. Medicine. 2019;98(5):e14262. doi: 10.1097/MD.0000000000014262.
- Hum J, Jou JH. The link between hepatitis C virus and diabetes mellitus: improvement in insulin resistance after eradication of hepatitis C virus. Clin Liver Dis. 2018;11(3):73–76. doi: 10.1002/cld.694.
- Chen H, Sultan SF, Tian Y, et al. Fast and accurate network embeddings via very sparse random projection. In: Cui P, Rundensteiner E, Carmel D, et al., editors. International Conference on Information and Knowledge Management, Proceedings, Association for Computing Machinery; Nov 3–7; Beijing, China. New York (NY): Association for Computing Machinery; 2019. p. 399–408. doi: 10.1145/3357384.3357879.
- Dong W, Moses C, Li K. Efficient K-nearest neighbor graph construction for generic similarity measures. In: Bertino E, Kumar R, editors. Proceedings of the 20th International Conference on World Wide Web; Mar 28 – Apr 1; Hyderabad, India. New York (NY): Association for Computing Machinery; 2011. p. 577–586. doi: 10.1145/1963405.1963487.