
Abstract
Purpose: To determine the prevalence of hypertension and predictors of blood pressure (BP) in a population based survey of Australian children.
Subjects and methods: We analysed cross-sectional data for 2071 children, aged 5–17 years, from the Australian Health Survey 2011–13. Hypertension and high-normal BP were defined by a systolic or diastolic BP greater than the 95th and 90th centiles respectively, using the National High Blood Pressure Education Program fourth report reference data. We also examined the association of several predictor variables (age, sex, remoteness, socioeconomic status, body mass index) with BP as a continuous variable.
Results: A total of 5.8% (95%CI 4.4–7.2) of children had hypertension, and a further 6.8% (95%CI 5.4–8.3) had high-normal BP. The strongest predictor of BP was body mass index. After adjustment, children in the overweight and obese categories had a BP that was on average 4 (95%CI 2–6) and 8 mmHg (95%CI 6–11) higher than those of normal weight. Socio-economic status was a statistically significant predictor of BP, but the effect size was more modest (2 mmHg [95%CI 0–4] between the highest and lowest tertile).
Conclusions: Hypertension or high-normal BP is present in 12.6% of Australian children. Body mass index is the most important predictor of BP, followed by low socioeconomic status. These at-risk children may be suitable for screening and intervention studies.
Background
Hypertension is an important risk factor for chronic disease globally [Citation1]. As one of only a few modifiable risk factors for chronic disease, it is an important target in reducing the frequency of secondary diseases, such as cardiovascular and kidney disease.
There is a growing body of evidence demonstrating that hypertension tracks well from childhood into adulthood, because of early lifecourse risk factors such as birth weight, the persistence of acquired risk factors such as obesity, and a genetic contribution to BP [Citation2]. Despite the importance of hypertension, and the likelihood of effective modification through early intervention, there are limited population-level data on the prevalence and risk factors of hypertension. The blood pressure of Australian children has been infrequently considered at the level of the general population and nothing published to date that extends across state boundaries. Internationally, the National Health and Nutrition Examination Survey in the United States has demonstrated an increasing prevalence of hypertension following an increase in the prevalence of obesity [Citation3]. In Europe the prevalence of hypertension varies from less than 5% in central Europe to between 9 and 13% in southern Europe [Citation4].
The aim of this study was to determine the prevalence of hypertension among Australian children, using data from the Australian Health Survey 2011–13 (AHS). In addition, we sought to examine the relationship between BP and age, sex, obesity, socioeconomic status, and remoteness.
Methods
About the Australian Health Survey
The AHS is the largest, most comprehensive survey into the health of the Australian population, and was last conducted by the Australian Bureau of Statistics (ABS) in 2011–13. It provides an important opportunity to study the prevalence and associations of disease among the general population. The AHS is designed using a stratified, multistage area design such that each person in any given state or territory has an equal likelihood of being sampled [Citation5]. Households were initially approached by mail to inform them of the survey and confidentiality provisions, prior to being contacted by an interviewer from the ABS. Ethics approval for the AHS was obtained from Australian Government Department of Health and Ageing Departmental Ethics Committee (#2/2011). This study was conducted in accordance with the Helsinki Declaration.
Outcome measurement
BP was measured in participants older than 5 years of age. Automated oscillometric devices were used on the upper arm, with the child resting, in the sitting position and the palm facing upwards. Two measurements were taken for each child. If the difference between the first and second (systolic or diastolic) measurements was greater than 10 mmHg then a computer assisted interview instrument prompted a third BP to be taken. Where only two measurements were required, the values from the second reading only were used. Where three measurements were taken, an average of the values from the second and third were used. If the variation across all readings was greater than or equal to 20 mmHg then the final value was recorded as invalid. As compared to auscultatory methods, oscillometric devices have been shown to on average read 2.5 mmHg higher for systolic blood pressure (SBP) and are not significantly different for diastolic blood pressure (DBP) [Citation6]. Hence, while it is useful in individual patients to confirm readings manually, for population studies automated methods are adequate.
Because BP in children is known to vary by age, sex and height, we normalized BP according to these variables using the fourth report recommendations from the National High Blood Pressure Education Program Working Group on Children and Adolescents [Citation7]. This allowed for the comparison of BP across these groups and also the identification of hypertension against the international standard. Consistent with the fourth report we first calculated z-scores for height according to the 2000 Centre for Disease Control and Prevention reference growth charts, and then using the polynomial formulas provided calculated BP z-scores [Citation7,Citation8]. Given the increasing evidence base that BP and cardiovascular risk are related in a continuous, linear fashion we examined BP as a continuous variable where possible [Citation9]. For descriptive purposes, we also described BP as a categorical variable (normal, high-normal BP and hypertension categories). Hypertension was considered to be a BP ≥95th centile, and high-normal BP ≥90th and <95th centile [Citation7]. We chose to analyse the results for both SBP and DBP, with the assumption that an observed relationship between both SBP and DBP, and any given predictor variable, was less likely to be a chance observation. However, the primary focus was on SBP because it is more strongly associated with adverse outcomes and has less variance than DBP among children [Citation3,Citation10].
Predictor measurement
Weight was measured using digital scales. Height was measured in the standing position using a stadiometer. From these the body mass index (BMI) was calculated as the weight in kilograms divided by the height in meters squared. BMI was then categorised according to the International Obesity Task Force recommendations, in which overweight and obesity are defined by centile curves passing through the established adult cut-offs of 25 kg/m2 and 30 kg/m2 respectively at 18 years of age [Citation11].
Remoteness category is a geographical measure based on the Australian Statistical Geography Standard produced by the ABS [Citation12]. This standard has been constructed to best suit Australian conditions, and is based on the nearest distance by road to surrounding towns and infrastructure. We used the Index of Relative Socio-Economic Disadvantage provided by the ABS to quantify socio-economic status [Citation13]. This is a composite measure that summarises relative disadvantage using information across multiple domains; such as education, employment, occupation and housing. These data are then aggregated at the level of the smallest statistical area produced by the ABS (statistical area level 1, 200 to 800 people per unit).
Statistical analysis
Simple and multiple linear regressions were used to examine the association between predictors and the continuous outcomes SBP and DBP. The outcome and predictor variables were all contained within the person-level stratum of the AHS. Primary and replicate weights constructed using the leave-one-out jackknife method were used to adjust for survey design. Sensitivity analyses included the addition of state or territory as a categorical variable. We considered two-way interaction terms between sex and age, sex and BMI, remoteness and socio-economic status, and age and socio-economic status. Diagnostic testing for linear regression models included graphical assessment of homoscedasticity, normality of residuals, and linearity for continuous covariates. STATA version 13 (StataCorp, College Station, TX) was used to conduct all analyses. A nominal two-sided alpha level of 0.05 was considered to indicate statistical significance.
Results
Participant characteristics
In total, 2071 children had a valid blood pressure recorded as part of the AHS. This is after 15565 of 18355 (84.8%) approached dwellings consented and children lacking a height or BP were excluded (n = 1305, 38.7%; consistent with similar large, national health surveys). The baseline characteristics of included patients according to the defined predictor variables are displayed in . The mean age of children included in our analysis was 12.1 years (jackknife standard error 0.08). Their distribution by remoteness, sex, socioeconomic status and BMI was reflective of the Australian population.
Table 1. Socio-demographic characteristics of the 2071 children participating in the Australian Health Survey, with blood pressure measurement.
The proportion of children with hypertension was 5.8% (95% confidence interval [CI] 4.4 to 7.2), and a further 6.8% had a BP in the pre-hypertensive category (95% CI 5.4 to 8.3). Systolic (3.9%; 95% CI 1.8 to 6.0) and diastolic hypertension (3.4%; 95% CI 2.4 to 4.4) were equally common. Diastolic high-normal BP (4.9%; 95% CI 3.7 to 6.0) was more common than systolic high-normal BP (2.7%; 95% CI 1.8 to 3.6).
Simple linear regression
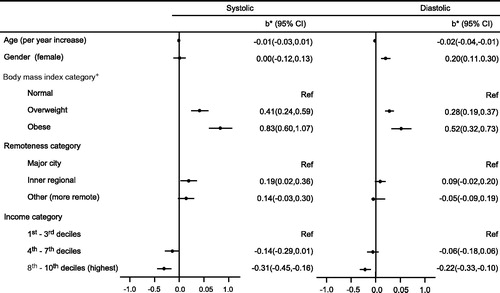
The relationships observed between BP and the predictor variables using simple linear regression are displayed in . The strongest predictor of BP was the BMI category (p < .001). Following BMI, socio-economic status was the next most important predictor, with the most affluent tertile having a lower BP on average (p = .001). Socio-economic status was examined as tertiles for simplicity because the raw data was not linearly related to BP. Remoteness was also associated with BP, although the relationship was not as strong (p = .04).
Figure 1. Univariate associations, using simple linear regressions, between BP z-score and socio-demographic variables for the 2071 children participating in the Australian Health Survey. *b – estimated regression coefficient indicating the average increase in the blood pressure z-score per unit of the continuous covariates and mean difference to the reference category in the categorical covariates; CI – confidence interval.
Multiple linear regression
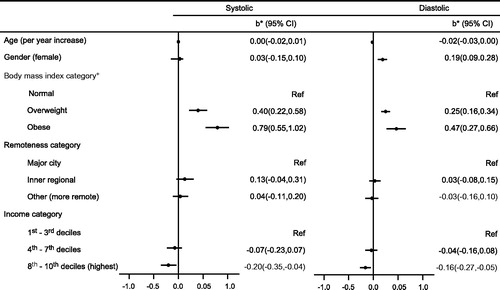
All variables were included in the multiple regression model (age, gender, body mass index category, remoteness category, income category). After adjustment, compared to the normal weight category, the overweight category had a SBP z-score that was 0.40 higher (95% CI 0.22 to 0.58, p < .001) and the obese category were 0.79 higher (95% CI 0.55 to 1.02, p < .001) (). This corresponds to a 4 mmHg average increase in BP for the overweight category and an 8 mmHg average increase for the obese category at any given age. Socio-economic status was also an important predictor of BP. On average, after adjustment, those in the highest income tertile had a SBP z-score that was 0.20 less than those in the lowest income tertile (95% CI 0.04 to 0.35, p = .02). This corresponds to a 2 mmHg lower SBP on average.
Figure 2. Adjusted associations, using a multiple linear regression, to predict BP z-score, between BP z-score and socio-demographic variables for the 2071 children participating in the Australian Health Survey. *b – estimated regression coefficient indicating the average increase in the blood pressure z-score per unit of the continuous covariates and mean difference to the reference category in the categorical covariates, adjusted for all the other variables in the model; CI – confidence interval.
After adjustment, remoteness was no longer a significant predictor of BP (p = .3). There was no important colinearity (largest variance inflation factor 1.4), consistent with this change from the univariable analysis being the result of confounding. Both BMI and socio-economic status were positively associated with remoteness and also BP. Further investigation revealed that the greatest change in the BP estimate for remoteness occurred following adjustment for socio-economic status (38% and 66% change in the correlation coefficients for SBP and DBP following adjustment for socio-economic status, versus a 4% and 24% change following adjustment for BMI). Thus, socio-economic status was the most important confounder in the relationship between remoteness and BP.
There was evidence of an association for DBP with age and sex (p = .3 and p < .001). No such relationship was observed between these covariates and SBP.
Sensitivity analysis and data validation
Within the person-level stratum of AHS, BP was more frequently missing than easily collected variables such as sex or age. To assess the validity of the survey weights we compared adjusted estimates using only those participants with a valid BP, to estimates derived using all patients in the dataset. We found no important differences when restricting the analysis to only those patients with BP, and thus concluded that the survey design was respected using this approach (see supplementary material for more information).
A number of analyses were performed to confirm the robustness of the results presented. We considered state of residence as an additional covariate in the multiple regression model. We also performed regression analyses without survey weighting, and when missing data were accounted for using a predictive mean matching, multiple imputation model for SBP and DBP. While patients with missing data tended to be younger and were more likely to be overweight or obese, the regression results were not materially different from those presented.
Discussion
In this nationally representative survey of 2071 children, hypertension and high-normal BP were present in 5.8 and 6.8% of the cohort respectively. This means that 12.6% of Australian children in total have an elevated BP. This is significant because there is an expanding evidence base confirming that this group continues to have an elevated BP into adulthood, and that this risk converts to damage at an early point in life, as demonstrated by a variety of different outcome measures including left ventricular hypertrophy, carotid intima-media thickness, and retinal arteriolar changes [Citation14–17].
We also examined several important risk factors for hypertension in childhood. The strongest predictor was BMI, with an average increase in SBP of 4 mmHg among overweight children and 8 mmHg among obese children. This magnitude of effect is comparable with other paediatric data [Citation18]. The relationship between BP and BMI was unchanged by adjustment for age, sex, remoteness and socio-economic status. It is difficult to translate this to an estimate of long-term disease risk, as the data required to derive such values in children are limited. However, the absolute increase in lifetime cardiovascular risk associated with a 20 mmHg increase in SBP attained at age 30 years is estimated to be 17.2% [Citation10]. It follows then, that the lifetime risk attributable to children with elevated blood pressure in the AHS, at a mean age of 12.5 years, is likely to be substantial.
The prevalence of hypertension in our cohort was slightly higher than in other population-based studies, which may be related to the use of multiple measurements at one time point compared with repeated measurements spread over multiple time points in other studies [Citation19]. Although the prevalence of elevated BP (hypertension and high-normal BP combined) may be similar regardless [Citation20]. There are limited comparable Australian data available. The 18 to 24-year group in the 2011/13 AHS had a 6.0% prevalence of hypertension using the relevant adult definitions. The closest study to a population-based survey was performed in 1980/81, with 9851 5 to 13-year New South Wales children sampled at random schools across the state [Citation21]. The tables of normal BP values produced are very close to those of the fourth report, albeit slightly lower in older males. The Raine birth cohort from Western Australia has provided important data on early lifecourse predictors of BP, but is again restricted to a single state [Citation22].
The next most important predictor of BP was socio-economic status, although the magnitude of the effect was more modest (2 mmHg difference between the highest and lowest tertiles). This difference persisted after adjustment, and thus represents an additional impact of socio-economic status on BP beyond that of increased BMI. Multiple different mechanisms linking BP and socio-economic status have been postulated, including low birth weight, barriers to healthcare access, and stress [Citation23]. While this difference in BP sounds modest, it is enough to produce a significant difference in cardiovascular event rates over time [Citation24]. As with any risk factor that stratifies by disadvantage, BP has the potential to exacerbate and perpetuate inequality.
Female sex, and to a lesser extent a younger age, were associated with increased DBP but not SBP. These findings are difficult to interpret in light of a BP normalized to age and sex. They were not present in the sensitivity analyses unadjusted for survey design, and the inconsistency suggests that they may represent a chance finding. Otherwise they might indicate that the relationship between BP, age and sex in our population differs to that from which the reference data were derived. Another explanation is that there is some unmeasured confounder specific to our population.
There were some potential limitations. Most fundamentally, we are limited by the current definition of hypertension in children as established by the fourth report using a normative approach. However, we believe that continued use of this reference is appropriate and useful. Appropriate because much of the evidence base that ties hypertension to outcomes in children uses fourth report thresholds. Useful because geographic, racial and temporal discrepancies mean that it is not a foregone conclusion that the prevalence of hypertension in a contemporaneous population-based cohort will equal that of the fourth report (most of the data used for the fourth report was collected in the 1970s and 80s, and only from children in the United States). Another approach to using a large, population-based dataset such as the AHS would be to develop normal values specific to the Australian population. A normative approach, however, requires a population that is on average representative of physiological good-health. We would argue that the Australian population is no longer suitable, with 27% of children overweight or obese [Citation25]. We were unable to adjust for birth weight, which is a modest but established predictor of blood pressure [Citation26]. Birth weight is positively associated with both BP and socio-economic status, and so might have confounded our assessment of the relationship between these two variables. Similarly, we were unable to adjust for parental BP in this analysis. An important limitation of the AHS was to exclude Aboriginal children from the health measures component, in consultation with Aboriginal and Torres Strait Islander groups because of the need to adopt culturally sensitive methods in that setting [Citation27]. This limits the applicability of these data to Aboriginal children and is likely to bias our estimates of prevalence downwards by a small amount (Aboriginal children comprise 6% of the childhood population in Australia) [Citation28,Citation29]. The methods used to derive a BP value from multiple BP measurements vary between studies, and our use of the second measurement only should be considered when comparing these results with other studies. The greater fraction of missing data among younger and overweight or obese patients may have impacted our estimates of prevalence. Another approach to adjust BP for age, sex and height would have been to incorporate our own fractional polynomial terms into the multivariable model. The usual caveats to cross-sectional data apply, in that we are unable to exclude residual confounding or determine causality.
In summary, this recent, large-scale representative survey found that 12.6% of Australian children have an elevated BP. This is likely to lead downstream to important health consequences for affected children. BMI is a particularly strong risk factor for hypertension, and this at-risk group of children may benefit from routine screening, particularly in those who are socio-economically disadvantaged.
Appendix_AHS.docx
Download MS Word (20.8 KB)Disclosure statement
The authors report no conflicts of interest.
Additional information
Funding
Related Research Data
References
- Lim SS, Vos T, Flaxman AD, et al. A comparative risk assessment of burden of disease and injury attributable to 67 risk factors and risk factor clusters in 21 regions, 1990–2010: a systematic analysis for the Global Burden of Disease Study 2010. Lancet. 2012;380:2224–2260.
- Olsen MH, Angell SY, Asma S, et al. A call to action and a lifecourse strategy to address the global burden of raised blood pressure on current and future generations: the Lancet Commission on hypertension. Lancet. 2016;388:2665–2712.
- Rosner B, Cook NR, Daniels S, et al. Childhood blood pressure trends and risk factors for high blood pressure: the NHANES experience 1988–2008. Hypertension. 2013;62:247–254.
- Lurbe E, Agabiti-Rosei E, Cruickshank JK, et al. 2016 European Society of Hypertension guidelines for the management of high blood pressure in children and adolescents. J Hypertens. 2016;34:1887–1920.
- Australian Bureau of Statistics. Australian Health Survey: Users’ Guide, 2011-13. 2013; ABS cat. no. 4363.0.55.001. Available from: http://www.abs.gov.au/ausstats/[email protected]/mf/4363.0.55.001
- Duncombe SL, Voss C, Harris KC. Oscillometric and auscultatory blood pressure measurement methods in children: a systematic review and meta-analysis. J Hypertens. 2017;35:213–224.
- Village EG, Falkner B, Daniels SR, et al. The fourth report on the diagnosis, evaluation, and treatment of high blood pressure in children and adolescents. Pediatrics. 2004;114:555–576.
- Ogden CL, Kuczmarski RJ, Flegal KM, et al. Centers for disease control and prevention 2000 growth charts for the United States: improvements to the 1977 National Center for Health Statistics version. Pediatrics. 2002;109:45–60.
- Vasan RS, Larson MG, Leip EP, et al. Impact of high-normal blood pressure on the risk of cardiovascular disease. N Engl J Med. 2001;345:1291–1297.
- Rapsomaniki E, Timmis A, George J, et al. Blood pressure and incidence of twelve cardiovascular diseases: lifetime risks, healthy life-years lost, and age-specific associations in 1·25 million people. Lancet. 2014;383:1899–1911.
- Cole TJ, Bellizzi MC, Flegal KM, et al. Establishing a standard definition for child overweight and obesity worldwide: international survey. BMJ. 2000;320:1–6.
- Australian Bureau of Statistics. ASGC remoteness classification: purpose and use. 2001; Census Geography Paper 03/01. Available from: http://www.abs.gov.au/websitedbs/D3110122.NSF/0/f9c96fb635cce780ca256d420005dc02?OpenDocument
- Australian Bureau of Statistics. Socio-Economic Indexes for Areas (SEIFA) 2011. 2011; ABS cat. No. 2033.0.55.001. Available from: http://www.abs.gov.au/ausstats/[email protected]/mf/2033.0.55.001
- Theodore RF, Broadbent J, Nagin D, et al. Childhood to early-midlife systolic blood pressure trajectories: early-life predictors, effect modifiers, and adult cardiovascular outcomes. Hypertension. 2015;66:1108–1115.
- Drukteinis JS, Roman MJ, Fabsitz RR, et al. Cardiac and systemic hemodynamic characteristics of hypertension and prehypertension in adolescents and young adults: the Strong Heart Study. Circulation. 2007;115:221–227.
- Li S, Chen W, Srinivasan SR, et al. Childhood cardiovascular risk factors and carotid vascular changes in adulthood: the Bogalusa Heart Study. JAMA. 2003;290:2271–2277.
- Mitchell P, Cheung N, De Haseth K, et al. Blood pressure and retinal arteriolar narrowing in children. Hypertension. 2007;49:1156–1162.
- Burke V, Beilin LJ, Simmer K, et al. Predictors of body mass index and associations with cardiovascular risk factors in Australian children: a prospective cohort study. Int J Obes (Lond). 2005;29:15–23.
- Wirix AJG, Nauta J, Groothoff JW, et al. Is the prevalence of hypertension in overweight children overestimated? Arch Dis Child. 2016;101:998–1003.
- McNiece KL, Poffenbarger TS, Turner JL, et al. Prevalence of hypertension and pre-hypertension among adolescents. J Pediatr. 2007;150:640–644.
- Roy LP, Tiller DJ, Jones DL. The range of blood pressures in Australian children. Med J Aust. 1984;141:9–12.
- McKnight CM, Newnham JP, Stanley FJ, et al. Birth of a cohort-the first 20 years of the Raine study. Med J Aust. 2012;197:608–610.
- Grotto I, Huerta M, Sharabi Y. Hypertension and socioeconomic status. Curr Opin Cardiol. 2008;23:335–339.
- Lewington S, Clarke R, Qizilbash N, et al. Age-specific relevance of usual blood pressure to vascular mortality: a meta-analysis of individual data for one million adults in 61 prospective studies. Lancet. 2002;360:1903–1913.
- Australian Bureau of Statistics. National Health Survey: first results, 2014–15. 2015; ABS cat. no. 4364.0.55.001. Available from: http://www.abs.gov.au/ausstats/[email protected]/mf/4364.0.55.001
- Mu M, Wang SF, Sheng J, et al. Birth weight and subsequent blood pressure: a meta-analysis. Arch Cardiovasc Dis. 2012;105:99–113.
- Hoy W. Research, information and consent for the Australian Health Survey: a separate standard for Indigenous people? Med J Aust 2011;194:509–510.
- Larkins N, Teixeira-Pinto A, Banks E, et al. Blood pressure among Australian Aboriginal children. J Hypertens. 2017;35:1801–1807.
- Australian Bureau of Statistics. Census of Population and Housing: Reflecting Australia: Stories from the Census, 2016. 2017; ABS cat. no. 2071.0. Available from: http://www.abs.gov.au/ausstats/[email protected]/mf/2071.0