
Abstract
Objective
Ethyltoluenes are isolated during crude oil refinement for use in gasoline and commercial products and are ubiquitous in the environment. However, minimal toxicity data are available. Previously, we identified 2-ethyltoluene (2-ET) as the most potent isomer via nose-only inhalation exposure in rodents. Here, we expanded the hazard characterization of 2-ET in two rodent models using whole-body inhalation exposure and evaluated the role of prenatal exposure.
Methods
Time-mated Hsd:Sprague Dawley® SD® rats were exposed to 0, 150, 300, 600, 900, or 1200 ppm 2-ET via inhalation starting on gestation day 6 until parturition. Rat offspring (n = 8/exposure/sex) were exposed to the same concentrations as the respective dams for 2 weeks after weaning. Adult male and female B6C3F1/N mice (n = 5/exposure/sex) were exposed to the same concentrations for 2 weeks.
Results and Discussion
Exposure to ≥600 ppm 2-ET produced acute toxicity in rats and mice characterized by large decreases in survival, body weight, adverse clinical observations, and diffuse nasal olfactory epithelium degeneration (rats) or necrosis (mice). Due to the early removal of groups ≥600 ppm, most endpoint evaluations focused on lower exposure groups. In 150 and 300 ppm exposure groups, reproductive performance and littering were not significantly changed and body weights in exposed rats and mice were 9–18% lower than controls. Atrophy of the olfactory epithelium and nerves was observed in all animals exposed to 150 and 300 ppm. These lesions were more severe in mice than in rats.
Conclusion
Nasal lesions were observed in all animals after whole-body exposure up to 600 ppm 2-ET for 2 weeks. Future studies should focus on 2-ET metabolism and distribution to better understand species differences and refine hazard characterization of this understudied environmental contaminant.
Introduction
Isolated during the refining process of crude oil, the C9 aromatic fraction of Naphtha consists of various volatile monoaromatic alkylbenzenes containing 8–10 carbons. C9 alkylbenzenes such as ethylbenzenes, cumene, trimethylbenzenes, ethyltoluenes, and xylenes are structurally similar, containing an aromatic ring with alkyl side chains. The estimated production of Naphtha (CAS 64742-95-6) in the US was 5–10 billion pounds per year from 2012 to 2015 (EPA Citation2016a), making many C9 alkylbenzenes high production volume chemicals. Despite prevalence in the environment, some of these C9 alkylbenzenes have not been thoroughly evaluated for toxicity.
Human exposure to C9 alkylbenzenes can occur occupationally and in the general population. The C9 aromatic fraction of Naphtha is primarily used as an additive for gasoline blending as well as a solvent for industrial coatings, sealants, paints, and automotive products (ICCA Citation2012). As these C9 alkylbenzenes are volatile, they are ubiquitous in the atmosphere due to automobile emissions, tobacco smoke, combustion processes, off-gassing of gasoline or solvent-containing products, and industrial release (Hellén et al. Citation2002; ATSDR Citation2005; EPA Citation2010; ICCA Citation2012; Shi et al. Citation2015; Wang et al. Citation2016; Zhang et al. Citation2017; McMullin et al. Citation2018). Occupational exposure to C9 alkylbenzenes occurs primarily through inhalation and dermal absorption with exposures ranging from 0 to 3 ppm (15 mg/m3) depending on the industry (ICCA Citation2012). In the general population, exposure is most likely via inhalation and is typically an order of magnitude lower than occupational exposures (ATSDR Citation2005; Danish EPA Citation2016; McMullin et al. Citation2018). Oral exposure via consumption of contaminated drinking water or dermal exposure through the handling of gasoline or consumer products is also possible.
The toxicity of some C9 alkylbenzenes and related isomers is understudied. While inhalation of some C9 alkylbenzenes has been reported to be carcinogenic in rodent studies (cumene and ethylbenzene: NTP Citation2009, Citation2013; IARC Citation2000; NTP Citation1999) or have reproductive and neurobehavioral effects (trimethyl benzenes: Gralewicz and Wiaderna Citation2001; Korsak and Rydzyński Citation1996; EPA Citation2016b, xylenes: ATSDR Citation2007), there is little safety data on ethyltoluene (ET) isomers which make up 25–35% of the C9 aromatic fraction of Naphtha (ICCA Citation2012). The available literature on ethyltoluene isomers is limited to studies of 4-ET. Oral gavage studies of animals with 4-ET show developmental toxicity at doses ≤200 mg/kg and significant changes in liver weight, leukocyte differentials, and clinical pathology at doses ≥100 mg/kg (IRDC Citation1980, Citation1981; Borriston Citation1983; Hazleton Citation1983). 4-ET was found to cause mild skin and eye irritancy and changes in leukocyte number in bronchiolar lavage with inhalation exposure (Swiercz et al. Citation2000).
Previously, the inhalation toxicity of various ET isomers was compared and 2-ET was identified as the more potent isomer compared to 3-ET and 4-ET, due to lower survival and higher incidences of lesions in the nose, lung, and liver of animals (Roberts et al. Citation2017). Specifically, there was squamous metaplasia and neutrophilic inflammation in the respiratory epithelium, necrosis and atrophy of the olfactory epithelium, hyperplasia, and cytoplasmic vacuolation of the bronchiolar and bronchial epithelium, and hepatocellular hypertrophy and necrosis in animals exposed to 2-ET. In Roberts et al., exposure was via daily nose-only inhalation for 2 weeks at 1000 or 2000 ppm. As there was high morbidity in the 2000 ppm exposure group, additional studies were needed to characterize the dose-response relationship of 2-ethyltoluene. Here, a whole-body inhalation exposure study was conducted in both rats and mice, and an expanded exposure range was evaluated. Given the ubiquitous presence of ET in the air and thus potential exposure of pregnant women to ET, the rat study included prenatal exposure.
Materials and methods
Chemicals
Sarchem Laboratories, Inc (Farmingdale, NJ) provided us with 2-ET (CAS no. 611-14-3; Lot No. SL-0197). Characterization of the test material was performed by Battelle Columbus (Columbus, OH). Chemical identity was confirmed by Fourier Transform Infrared (FTIR) spectroscopy, proton and carbon-13 nuclear magnetic resonance (NMR) spectroscopy, elemental analysis, and mass spectrometry. Purity was determined by gas chromatography with flame ionization detection (GC-FID) and also in comparison to a purchased high purity standard (Sigma-Aldrich, St. Louis, MO). Water content by Karl Fischer titration was also performed.
FTIR and proton and carbon-13 NMR spectra of the sample were consistent with the available reference spectrum (KnowItAll® Library, No. HIX 14061, Bio-Rad, Hercules, CA) and the structure of 2-ET. Elemental analysis and the mass spectrum of the major peak from the GC analysis were consistent with the structure and identity of 2-ET. Karl Fischer’s analysis indicated the presence of less than 2.8% water. The purity of the lot was ∼99.3%. The purity in comparison to the purchased standard was 100.8%. The lot contained four reportable impurities with areas greater than or equal to 0.1% of the total chromatographic peak area. Three of the impurities were identified by retention time matching with standards and mass spectrometry as ethylbenzene, 3-ET, and 4-ET. The spectral matching for the fourth impurity was not definitive, although it suggests an aldehyde derivative of an alkyl-substituted aromatic compound (such as ethyltoluene). 2-ET was stored at ambient temperature and was shown to be stable during the 2-week study.
Vapor generation and exposure system
Inhalation exposures were conducted at the Battelle Columbus test site (West Jefferson, OH). 2-ET was pumped from the original reservoir into a heated (∼380 °F) vaporizer glass column and vaporized with pre-heated (∼370 °F) nitrogen. The nitrogen-chemical mixture was diluted with heated (∼225 °F) and conditioned air (a mix of air derived from each exposure chamber’s wet and dry air duct supplies) to achieve the desired exposure concentration. These heated lines facilitated 2-ET vaporization and prevented condensation in the delivery lines. Using Antoine constants and equation, the 2-ET saturated vapor concentration at ∼225 °F is ∼174 000 ppm, which is well above the maximum 2-ET concentration in the delivery system of ∼20 000 ppm. The temperature of the resultant mixture of air was adjusted by passage over a temperature-controlled radiator with filters.
Buildup and decay times for chamber concentrations were assessed and ranged from 9 to 13 min. The time to achieve 90% of the target concentration after the beginning of vapor generation (T90) used for the study was 12 min. Chamber concentrations of 2-ET were determined using an online GC-FID system. This analytical method met all acceptance criteria for linearity, precision, accuracy, sensitivity, recovery, and specificity and was considered suitable for the analysis of chamber samples between 14 and 990 µg/mL. Analysis of the exposure chamber atmosphere indicated the purity of 2-ET in the exposure chambers reflected the purity of the bulk test material and no degradation products or exogenous contaminants were detected in the exposure system. During normal monitoring conditions, all exposure and control chambers were monitored at least twice per hour. Uniformity of the vapor in the exposure chamber was maintained and mean 2-ET concentrations were within 4% of target values in all chambers. Mass balance of actual concentration vs nominal concentration was performed. Based on the 2-ET usage rate and dilution flows the measured vapor concentrations in the exposure chambers were within 4% of these expected concentrations. Using a condensation particle counter (Model 3022 A; TSI Incorporated, St. Paul, MN), particles were detected in only the 900 and 1200 ppm chambers, but the amount of these particles were determined not to make a significant contribution to the exposure atmosphere. Using an aerodynamic particle sizer (APS Model 3321; TSI Inc, MN) the particles in the 900 and 1200 ppm chambers were determined to have a mass median aerodynamic diameter of approximately 0.7 µm. The mass contribution of these particles to the chamber atmosphere was calculated to be less than 0.003%.
Animals and maintenance
Time-mated Hsd:Sprague Dawley® SD® (SD) rats were obtained from Envigo (Haslett, MI). B6C3F1/N mice were obtained from the National Toxicology Program’s colony at Taconic (Germantown, NY). Rats were approximately 13 weeks old and mice were approximately 4 weeks old upon arrival. Following quarantine, animals were randomly assigned to the exposure groups by body weight such that each group had a similar average weight as the mean body weight of all animals (per species) selected for the study. Animals were housed individually, except for rats during lactation when F0 dams were housed with their litters. Mice were housed in the inhalation chambers; rats were housed in polycarbonate cages during non-exposure periods. Inhalation chambers, racks, and cages were changed weekly, and cages were rotated weekly. Chambers and cages were maintained at a temperature of 72 ± 3 °F, relative humidity of 50 ± 15%, a 12-h light-dark cycle, and a minimum of 10 air changes per hour. NTP-2000 irradiated pelleted feed (Zeigler Brothers, Inc., Gardners, PA; F1 rats after weaning and mice) or NIH-07 irradiated pelleted feed (Zeigler Brothers, Inc., Gardners, PA; rats during gestation and lactation) were provided ad libitum during non-exposure periods; no feed was available during exposure periods. Water (Village of West Jefferson, OH) was provided ad libitum during all periods.
Animal use was in accordance with the United States Public Health Service policy on humane care and use of laboratory animals and the Guide for the Care and Use of Laboratory Animals. These studies were conducted in compliance with the United States Code of Federal Regulations, Title 21, Part 58: Good Laboratory Practice for Nonclinical Laboratory Studies.
Experimental design
Rats and mice were exposed via whole-body inhalation for 6 h per day, 7 days per week to the following concentrations of 2-ET: 0 (air control), 150, 300, 600, 900, and 1200 ppm. Prior to the first day of exposure, animals were acclimatized to the exposure chambers for 3 days. Six additional mice and rats per sex in the control and 600 ppm group were designated as biosample animals for a preliminary assessment of 2-ET concentration in blood.
Pregnant rats (12/exposure group) were exposed to 2-ET from gestation day (GD) 6 to GD 20. Dam body weight was monitored on GD 2 and every 3 days until scheduled removal. Formal out-of-cage clinical observations were conducted twice daily, at least 6 h apart. Gestation length was recorded, and sex ratio and live litter size were monitored throughout lactation. There was no dam or pup exposure to 2-ET during lactation. Litters were culled to 8 pups per litter (4 per sex when possible) on a postnatal day (PND) 4.
After weaning on PND 21, F1 offspring were acclimated to the exposure chambers for 3 days prior to the start of F1 exposure. Starting on PND 24, F1 animals (8/sex/group) and biosample animals (6/sex/group) were exposed via whole-body inhalation for 6 h per day for 15 days at the same concentrations as their dams. F1 animal body weights were recorded on the first day of exposure, on PND 24, twice weekly thereafter, and at study termination. Formal clinical observations were conducted daily.
Male and female B6C3F1/N mice (5/sex/exposure group) and biosample animals (6/sex/exposure group) were exposed to 2-ET for 15 days and were approximately 6 weeks old at study start. Body weights were recorded on the first day of exposure, twice-weekly thereafter, and at study termination. Clinical observations were recorded daily.
Blood for 2-ET analysis was collected 24 hr after the last exposure. Due to toxicity observed in the 600 ppm group, blood was collected from all animals in the 300 ppm group (n = 8) and from the designated control biosample animals (n = 6). Animals were placed under CO2/O2 anesthesia and blood was collected via cardiac puncture and placed into tripotassium ethylene diamine tetraacetic acid (K3EDTA)-coated tubes. After collection, whole blood was aliquoted using a positive displacement pipet into headspace vials and spiked with internal standard.
Dams found dead or moribund were subjected to gross necropsy and uterine examination. Dams that failed to deliver by GD 24 ± 1 day were humanely terminated and uterine contents examined. Complete necropsies were conducted for all F1 rat offspring and mice, including ones found dead or moribund. Animals were deeply anesthetized (70% CO2/30% O2) and death was confirmed by exsanguination. Organ weights for liver, thymus, left and right kidney, left and right testis, left and right epididymis, left and right ovary, heart, and lungs were recorded.
Tissues collected for histopathological evaluation at necropsy were selected based on findings from Roberts et al. (Roberts et al. Citation2017). Collected tissues (brain, gross lesions, kidneys, larynx, liver, lungs, lymph nodes, nasal cavity, pharynx, and trachea) were preserved in 10% neutral buffered formalin (NBF). Three sections were taken of the nasal cavity were collected (https://ntp.niehs.nih.gov/nnl/respiratory/nose/index.htm). Level I sections, the most rostral sections, were taken immediately posterior to the upper incisor teeth; Level II sections were taken through the incisive papilla rostral to the first palatal ridge; Level III sections were taken at the middle of the second molar teeth. Histopathological evaluation was conducted on controls and in exposed groups to a no-observed effect level.
Determination of 2-ET concentrations in blood
A headspace gas chromatography/mass spectrometry (head space GC/MS) method was developed to quantitate 2-ET concentration in B6C3F1/N mouse blood and SD rat blood. The method included calibration standards, blanks, and quality control (QC) standards prepared in blood for assessment of linearity, precision (estimated as percent relative standard deviation, RSD), accuracy (estimated as percent relative error, RE), limits of quantitation (LOQ), and detection (LOD).
Stock solutions of 2-ET were prepared in ethanol and further diluted in ethanol to generate concentrations of standards in the working range (20 to 10 000 ng/mL). A solution of d5-2-ET (internal standard) was prepared in ethanol and diluted in deionized water to generate an internal standard solution (10 ng/mL). A nine-point matrix calibration curve was prepared by spiking 2-ET analyte in male SD rat blood, using alternate stock solutions to achieve final concentrations of 2-ET in the range of 1 to 500 ng/mL. QC standards to cover the low (3 and 7.5 ng/mL), mid (200 ng/mL), and high (400 ng/mL) end of the matrix calibration curve were prepared similar to the standards by using an independent stock solution.
One hundred (100) µL of each calibration standard, QC standard, study samples, and blank were transferred to individual 2-mL headspace vials containing 150 µL of internal standard solution to all samples except the blanks without an internal standard to which 150 µL of ASTM Type 1 water was added. The vials were capped with crimp caps, vortexed briefly, and were analyzed by headspace GC/MS using Agilent G1530A gas chromatograph coupled with a G2589A mass spectrometer (Santa Clara, CA) operated in electron ionization mode. The vials were incubated at 90 °C for 20 minutes following which a 200 µL volume was sampled from the headspace and injected into the gas chromatograph. A Restek RTX-VMS (60 m × 0.25 mm (ID) × 1.4-µm film thickness) column was used with the oven temperature program: 75 °C (1 min), to 180 °C at 5 °C/min, to 245 °C at 20 °C/min, and held for 10 min. The ions used for quantitation were m/z at 105 and m/z 107 for 2-ET and d5-2-ET, respectively. The retention time was ∼19.5 min for both analyte and internal standards.
Linear regression with 1/x weighting was used to relate the peak area response ratio of 2-ET to the internal standard and corresponding concentration. The concentration of 2-ET was calculated using the response ratio and the regression equation. All concentrations above the LOD of the assay were reported.
Statistical methods
Data was collected using Provantis (Instem Life Sciences Systems, Ltd., Staffordshire, UK). For body weights and organ weights endpoints, extreme values were identified by the outlier test of Dixon and Massey (Dixon and Massey Citation1957). To identify outliers for F1 pup weights, all observations across exposure groups were fit to a linear mixed-effects model with a random litter effect, and the residuals were tested by exposure group for outliers using Tukey’s outer fences method (Tukey Citation1977). All flagged outliers were examined, and implausible values were eliminated from the final analyses.
Statistical analyses were performed using SAS software version 9.4 (SAS Institute, Cary, North Carolina). Body weights and organ weights were analyzed using Jonckheere’s trend test (Jonckheere Citation1954) and Williams’ or Dunnett’s (pairwise) test depending on detection of a significant trend at 0.01 level (Dunnett Citation1955; Williams Citation1971, Citation1972). Gestational length, litter size, and survival endpoints were analyzed using the nonparametric multiple comparison methods of Shirley (Shirley Citation1977) as modified by Williams (Citation1986) and Dunn (Citation1964). Jonckheere’s trend test was used to assess the significance of exposure-related trends.
For reproductive performance, non-neoplastic lesions, and gross pathology endpoints, statistical analysis was performed by Cochran-Armitage (trend) and Fisher Exact (pairwise) 2-sided tests (Gart et al. Citation1979). F1 pup weights were first adjusted for litter size and then analyzed with mixed-effects linear models with a random litter effect, and the Dunnett-Hsu procedure (Hsu Citation1992) was used to adjust for multiple comparisons. Adjustment of pup weights by litter size was performed by fitting a linear model to pup weights as a function of exposure and litter size. The estimated coefficient of litter size was then used to adjust each pup’s body weight based on the difference between its litter size and the mean litter size. Pup weights measured from PND 1 to PND 4 (litter standardization) were adjusted relative to live litter size on PND 1, and post-standardization pup weights were adjusted based on the number of post-standardization live pups. Exposed groups different from control at p ≤ 0.05 were considered statistically significant.
Results
All data from this study are available at the Chemical Effects in Biological Systems database at this link: https://doi.org/10.22427/NTP-DATA-002-03356-0005-0000-4.
Prenatal and two-week exposure study in SD rats
Dam survival and clinical observations
All dams in the 1200 ppm group and 4 of 12 dams in the 900 ppm group were found dead or euthanized due to moribund conditions between GD 8 and GD 10 (CEBS I01, I02). Gross necropsy of early-death dams in the 900 and 1200 ppm groups found stomach discoloration, thoracic cavity fluid, and pale livers (CEBS PA46). Clinical signs observed in these animals included ataxia, slow breathing, ruffled coat, cold to touch, clear/red eye discharge, red nose/snout discharge, red/brown vaginal discharge, discolored urine, soft feces, and hunched posture (CEBS I05).
All dams exposed to ≤600 ppm survived until scheduled euthanasia. Clinical observations similar to those noted in the 900 and 1200 ppm groups were observed in exposure groups ≤600 ppm, though often at lower incidences and manifesting later in the study (CEBS I05). No exposure-related clinical observations in these dams during lactation were noted (CEBS I05).
Dam body weight
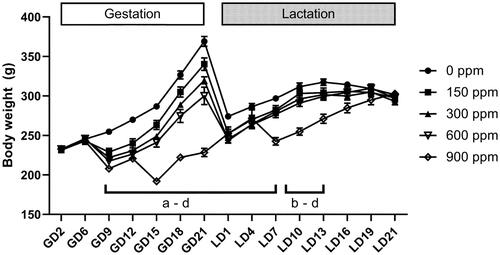
Starting on GD 9, mean body weight of dams in all exposed groups was 10–14% lower than that of controls dams (); this difference was statistically significant throughout the remainder of gestation (CEBS I04). Dams in the 900 and 1200 ppm groups lost on average 25 and 22 g body weight (∼10% of starting body weight), respectively, during the first few days of exposure. Bodyweight remained around 10–14% lower than controls in the 150 and 300 ppm group through gestation. Dams in the 600 and 900 ppm groups experienced greater reductions in body weight over the course of gestation. Specifically, body weight in the 600 ppm group was 16% lower than controls on GD 12 and 18% lower on GD 21. In the 900 ppm group, dam body weights were 17% lower than controls on GD 12 and 26% lower than controls on GD 21.
Figure 1. Body weight during gestation and lactation of Hsd:Sprague Dawley® SD® dams exposed to 2-ethyltoluene via whole-body inhalation. Dams were exposed to 2-ethyltoluene for 6 h per day, 7 days per week in inhalation chambers from gestation day (GD) 6 to GD 20. No exposure occurred during lactation. Dams in the 1200 ppm group were terminated due to excessive toxicity between GD 8 and GD 10 and data are not shown in the graph. Letters indicate significantly (p < 0.05) lower body weights compared to controls for an exposure group (a: 150 ppm, b: 300 ppm, c: 600 ppm, d: 900 ppm). Data shown as mean ± SEM (n = 11–12 for all groups except 900 ppm with n = 6–8 for 900 ppm). GD: gestation day; LD: lactation day.
Bodyweight gain was significantly less in the 900 ppm group throughout gestation (24–60% less than controls) and sporadically different in other exposed groups between GD 9 to 18 (CEBS I04G). Bodyweight gain between GD 18 and 21 was significantly lower in all exposed dams compared to controls. Over the entire exposure period, body weight gain was significantly less in all 2-ET exposed groups and ranged from 21% less than control in the 150 ppm group to 63% less than controls in the 900 ppm group (CEBS I04G).
During lactation, dams and litters were not exposed to 2-ET. However, the bodyweight of exposed animals remained less than controls. From lactation day (LD) 1 to LD 7, body weights of all exposed dams were 4–12% lower than controls; this difference was statistically significant in all exposure groups (; CEBS I04). Between LD 7 and LD 16, bodyweight remained significantly lower (5–11% lower than controls) in all exposed groups except the lowest exposure group, 150 ppm. From LD 16 until LD 21, bodyweight differences were minimal (1–3% lower than control) and not statistically significant. There were no statistically significant treatment-related differences in body weight gain during lactation (CEBS I04G).
Reproductive performance and litter data
In the 600 and 900 ppm groups, gestation length was significantly longer (by 0.6 and 0.8 days, respectively) compared to controls (; R02). There was a significant decreasing trend in fecundity and in total and live pups per litter throughout lactation. The number of live pups per litter on PND 0 was 13 and 12% smaller, respectively, in the 300 and 600 ppm groups and 30% lower in the 900 ppm group; pairwise differences were not statistically significant on PND 0. The percent of live male pups was less than controls in the 900 ppm group on PND 0 and throughout lactation, which may be related to smaller litter size. Starting on PND 4 and continuing throughout the lactation period, live litter size was significantly lower in the 900 ppm group. For the remainder of the lactation period, survival was not significantly different in exposed versus control litters ().
Table 1. Reproductive performance, litter data, and pup parameters of Hsd:Sprague Dawley® SD® rats after exposure to 2-ethyltoluene.
Pup body weight during lactation
Male and female pups in the 900 ppm group had 13–18% lower body weight compared to controls throughout lactation (CEBS R19). Bodyweight gain in 900 ppm pups was significantly lower than controls initially; this difference became smaller over time (CEBS R19G). For example, male pup body weight gain from PND 1 to PND 4 was 35% lower than control but was only 18% less than control from PND 19 to PND 21.
Body weights of pups in groups exposed to ≤600 ppm were not significantly different from control throughout lactation (PND 1 to PND 21) (CEBS R19). Accordingly, body weight gain was similar across pups from control and groups exposed to ≤600 ppm during lactation (CEBS R19G). No treatment-related clinical observations in pups during lactation were noted (CEBS I05P).
Due to the clinical observations and toxicity observed in the perinatal period, pups in the 900 ppm group were not included in the postweaning portion of the study and were humanely terminated on PND 21 without further observation.
Postweaning F1 offspring survival and body weight after 2-weeks of 2-ET exposure
There were no deaths or remarkable clinical observations in F1 offspring exposed to 150 or 300 ppm after weaning (CEBS I01, I02, I05). High mortality was observed in F1 rats exposed to 600 ppm within the first few days of exposure. Seven out of 14 rats (core and biosample animals combined) were found dead or euthanized moribund in male and female 600 ppm groups on either PND 26 or 27 (i.e. 2–4 exposures). The remaining F1 rats in the 600 ppm group had higher incidences of ruffled coat, distended abdomen, pale, lethargic, soft feces, and eye/nose/snout discharge observed than controls and groups with lower exposures (CEBS I05). Due to the high mortality and observed toxicity, the remaining F1 rats in the 600 ppm group were humanely terminated.
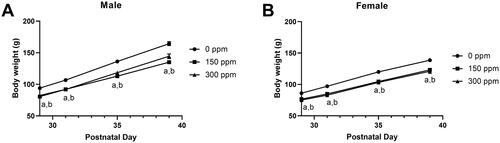
In the remaining exposure groups, 150 and 300 ppm, body weights of exposed F1 rats were generally lower than that of controls (11–18%) and these differences were statistically significant (, CEBS I04); there was also lower body weight gain (CEBS I04G). The largest difference in body weight gain in exposed animals compared to controls (50–75% lower) occurred within the first three days. For the remainder of the study, body weight gain was 7–28% lower than controls in males and 0–29% lower than controls in females.
Figure 2. Body weight of male and female Hsd:Sprague Dawley® SD® rats exposed to 2-ethyltoluene prenatally and for 2 weeks via whole-body inhalation. Male (A) and female (B) F1 offspring were exposed to 2-ethyltoluene for 6 h per day, 7 days per week in inhalation chambers at the same concentrations as their respective dams for 2 weeks after weaning on postnatal day 21. Animals in the 600, 900, and 1200 ppm exposure groups were terminated early due to excessive toxicity within the first few days of exposure and data are not shown. Letters indicate significantly (p < 0.05) lower body weights compared to controls for an exposure group (a: 150 ppm, b: 300 ppm). Data shown as mean ± SEM (n = 14 for control, n = 8 for exposed).
F1 offspring terminal body weights and organ weights
Terminal body weights in both sexes in the 150 and 300 ppm groups were 11–18 and 11–12% lower than controls, respectively (CEBS PA06). In males, mean absolute weights of heart, kidneys, liver, testes, and thymus were generally lower in exposed males compared to controls (CEBS PA06). Relative organ weight was only significantly different for the testes (higher in 150 ppm group only), lung (higher in the 300 ppm group), and thymus (lower in the 300 ppm group) compared to controls. In females, exposed groups had significantly lower absolute heart, kidney, liver, lung, ovary, and thymus weights (CEBS PA06) compared to controls. These changes were largely attributable to lower terminal body weight, as no changes in relative organ weights were significantly different.
Two-week exposure study in B6C3F1/N mice
Survival
Exposure groups ≥600 ppm were terminated due to toxicity following the first few exposures. All mice in the 900 ppm and 1200 ppm groups were euthanized moribund after the first exposure. Mice in the 600 ppm group were euthanized moribund by the end of Study Day 2 (i.e. after 3 total exposures). Clinical observations included shallow/slow breathing, lethargic, cold to touch, hunched, and prone in both males and females (CEBS I05). There were no deaths or remarkable clinical observations in mice exposed to ≤300 ppm (CEBS I01, I02, I05).
Body weight and body weight gain
Body weights of exposed mice in the 150 and 300 ppm groups were generally lower than controls. In male mice, the difference in body weight was up to 8% lower than controls and was statistically significant from Study Day 4 to 14 (; CEBS I04). Body weights of exposed female mice were not significantly different from control (; CEBS I04).
Figure 3. Body weight of male and female B6C3F1/N mice exposed to 2-ethyltoluene via whole-body inhalation for 2 weeks. Male (A) and female (B) mice at 6 weeks of age were exposed to 2-ethyltoluene for 6 h per day, 7 days per week in inhalation chambers for 2 weeks. The 600, 900, and 1200 ppm exposure groups were terminated early due to excessive toxicity within the first few days of exposure and data are not shown. Letters indicate significantly (p < 0.05) lower body weights compared to controls for an exposure group (a: 150 ppm, b: 300 ppm). Data shown as mean ± SEM (n = 11 for control, n = 8 for exposed).
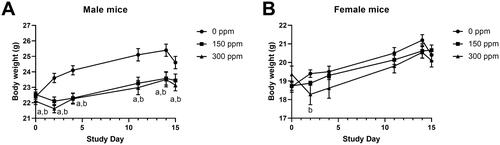
Lower body weight gain was also observed in male mice. There was approximately a 50% difference in body weight gain between Study Day 0 and 15 compared to controls in all exposed male mice; these differences were statistically significant only in the 150 ppm males (CEBS I04G).
Terminal body weights and organ weights
There were no significant differences in terminal body weight in both male and female mice (CEBS PA06). Significant decreases in absolute and relative heart, kidney, and liver weights were observed in male mice. In females, absolute and relative heart and thymus weights were significantly lower. Ovary weight tended to be lower in exposed mice (CEBS PA06).
Pathology findings in mice and rats in exposure groups terminated before study end
There were exposure-related microscopic lesions in rats and mice that died or were euthanized early. The severity of histopathologic lesions was graded subjectively on a 4-point scale: minimal, mild, moderate, and severe. In the F1 rats, microscopic examination of 600 ppm animals that died or were euthanized on PND 26 or 27 showed exposure-related lesions in the liver in both sexes: centrilobular hemorrhage (3 out of 8 in males and females; mild severity in males and minimal in females) and centrilobular necrosis (7 out of 8 in males with moderate severity,t 8 out of 8 in females with mild to moderate severity). Mild, diffuse degeneration of the olfactory epithelium was also observed in all 600 ppm rats in both sexes. Minimal hemorrhage in the glandular stomach was observed in 3 out of 5 male and 3 out of 7 female F1 rats (CEBS PA18).
Microscopic evaluations of 600 ppm mice that died or were euthanized by Study Day 2 found lesions in the liver: moderate, multifocal hemorrhage and centrilobular degeneration in all-male mice and minimal, diffuse cytoplasmic vacuolation in female mice (7 out of 10) (CEBS PA18). Moderate, diffuse necrosis of the olfactory epithelium was observed in all 600 ppm mice in both sexes (CEBS PA18).
Pathology findings in mice and rats after 2-week exposure
Tissues from F1 rat offspring and mice in the control, 150 ppm, and 300 ppm exposure groups were evaluated grossly and select tissues were evaluated microscopically at necropsy after the 2-week exposure. Gross lesions were not observed in animals exposed to ≤300 ppm in both rats and mice. In both rats and mice, histological lesions determined to be exposure-related were found in the nose of all animals from the 150 and 300 ppm groups and none in controls (; CEBS PA46, PA18). No exposure-related histological lesions were present in the brain or other tissues examined in the 150 and 300 ppm groups. In the nose, lesions included atrophy of the respiratory epithelium in mice and atrophy of the olfactory epithelium and associated nerves in rats and mice.
Table 2. Incidences and average severities for histopathological nasal lesions in male and female Hsd:Sprague Dawley® SD® rats and B6C3F1/N mice after 2-week whole-body inhalation exposure to 2-ethyltoluene.
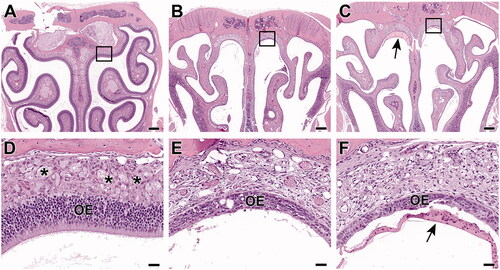
Olfactory epithelium atrophy (in Levels II and III sections of the nose) in rats and mice was seen as thinning and decreased cellularity along the dorsal meatus and along the dorsal nasal septum ( and ). At higher severities (i.e. in mice), there was more thinning (down to a single cell layer in some areas) over a greater extent, including areas lining the ethmoid turbinates in Level III sections. Olfactory epithelium atrophy also encompassed changes such as rare individual cell death, rare erosions, low numbers of inflammatory cells within the epithelium, and low amounts of inflammatory exudate in the lumen. In both species, lesion severities were similar between the 150 and 300 ppm exposure groups. However, lesions in the mice were of higher severity (marked in both males and females) compared to those in rats (minimal to mild in both males and females) at the same level of exposure.
Figure 4. Level III sections of the nose from Hsd:Sprague Dawley® SD® rats exposed to 2-ethyltoluene prenatally and for 2 weeks via whole-body inhalation. In the control female rat (A, D), a uniformly thick olfactory epithelium (OE) lines all surfaces. In a higher magnification section at the dorsal meatus (area within the box), the olfactory nerves (*) are prominent in the lamina propria underlying the OE. In female rats from 150 ppm (B, E) and 300 ppm (C, F), there is mild atrophy of the both the olfactory epithelium and of the underlying olfactory nerves. (A, B, C: 4× original magnification, scale bar = 250 µm. D, E, F: 40× original magnification, scale bar = 25 µm). H&E.
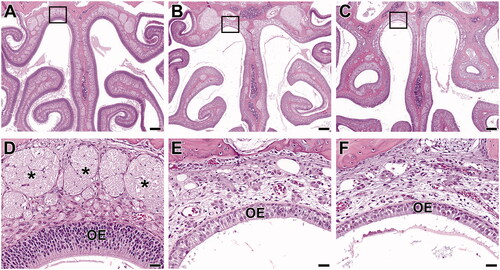
Figure 5. Level III sections of the nose from B6C3F1/N mice exposed to 2-ethyltoluene via whole-body inhalation for 2 weeks. In the control female mouse (A, D), a uniformly thick olfactory epithelium (OE) lines all surfaces. In a higher magnification section at the dorsal meatus (area within the box), the olfactory nerves (*) are prominent in the lamina propria underlying the OE. In female mice from 150 ppm (B, E) and 300 ppm (C, F), there is marked atrophy of the both the olfactory epithelium (OE) and of the olfactory nerves (*). The olfactory nerves are readily observable in the control animal (see asterisks in D), but they are inapparent in the animals from 150 ppm (E) and 300 ppm (F). There is also inflammatory exudate present (arrow). (A, B, C: 4× original magnification, scale bar = 250 µm. D, E, F: 40× original magnification, scale bar = 25 µm). H&E.
Nerve atrophy (Level II and III sections of the nose) was seen as decreased size and number, or even loss, of the olfactory nerves in the lamina propria subjacent to the olfactory epithelium ( and ). This lesion was concomitant with atrophy of the overlying olfactory epithelium, which is common since atrophy of the olfactory nerves can be secondary to loss of olfactory nerve cells from the olfactory epithelium. Similar to the lesion of olfactory epithelium atrophy, olfactory nerve atrophy was more severe in mice (marked in both males and females at 150 and 300 ppm) than in rats (minimal to mild in males and females at 150 ppm and mild at 300 ppm).
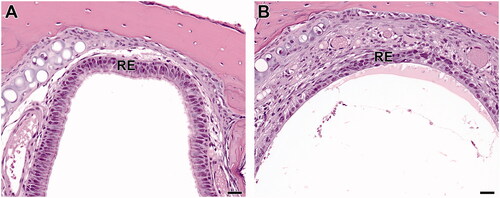
Respiratory epithelium atrophy (Level I sections of the nose) in mice was seen microscopically as thinning (down to a single cell layer in some areas), decreased cellularity, and loss of cilia along the dorsal meatus and dorsal nasal septum (). This was accompanied by evidence of single-cell death (apoptosis and/or necrosis). There were low amounts of mixed inflammatory cells in the respiratory epithelium and inflammatory exudate seen in the dorsal meatus in the Level I sections in mice, down to 150 ppm. Though respiratory epithelium atrophy was not diagnosed in rats, there were rare instances of decreased numbers of goblet cells, loss of cilia, and apoptotic cells in the respiratory epithelium in some rats.
Figure 6. Level I sections of the nose from B6C3F1/N mice exposed to 2-ethyltoluene for 2 weeks via whole-body inhalation. In the control female mouse (A), the dorsal meatus of Level I is lined with respiratory epithelium (RE). In a female mouse exposed to 150 ppm 2-ethyltoluene (B), the respiratory epithelium atrophy is seen as attenuation and thinning of the respiratory epithelium (RE) in a Level I section of the nose. 40× original magnification, scale bar = 25 µm. H&E.
Evaluation of blood concentrations of 2-ET
A preliminary evaluation measured 2-ET in blood obtained at study termination from the 0 and 300 ppm groups approximately 24 h after the end of the final exposure. The goal of this sample analysis was to determine feasibility and inform method development for analyzing blood after exposure to a volatile chemical. The study samples were analyzed in two runs; the first run contained the mouse samples and the second run contained the rat samples. The calibration curves were linear (≥0.991), with %RE ≤ ±14.0 and %RSD ≤ 13.9. The %RE and %RSD based on QC standards were ≤ ±18.8 and ≤5.7, respectively, in the first run (mouse samples). In the second run (rat samples), %RSD was ≤9.2, %RE was high and ranged between 44.0 and 261.6 although the reason(s) remain unclear. The LOQ and LOD were 1 ng/mL and 0.195 ng/mL, respectively.
Measurable concentrations of 2-ET above the LOD were found in mouse and rat blood samples in the 300 ppm group and were not detected in any of the control samples (). The average 2-ET concentration in rats was 13.3 ± 1.89 ng/mL and 14.6 ± 2.12 ng/mL in males and females, respectively. In 300 ppm mice, the average 2-ET concentration was 9.65 ± 2.75 ng/mL in males and 9.50 ± 3.41 ng/mL in females.
Table 3. Concentrations (ng/mL) of 2-ethyltolutene in blood from Hsd:Sprague Dawley® SD® rats and B6C3F1N mice after 2-week whole-body inhalation exposure to 2-ethyltoluene.
Discussion
C9 alkylbenzenes are common environmental contaminants produced as a byproduct of crude oil refining. Minimal toxicity data exists for ET isomers, despite ET constituting a third of the C9 aromatic Naphtha fraction. This knowledge gap precludes not only risk assessment of ET but also hazard evaluation of mixtures of C9 alkylbenzenes, to which the general population is more likely to be exposed. The study presented here builds on our previous work on ET toxicity (Roberts et al. Citation2017), showing that whole-body inhalation of 2-ET produces acute toxicity at exposures ≥600 ppm and microscopic nasal lesions in both rats and mice after 2 weeks of exposure to ≤300 ppm.
Given that volatile C9 alkylbenzenes are ubiquitous in the air and thus have widespread exposure through all stages of life, we examined the effects of 2-ET exposure during pregnancy in the rat study. Reproductive toxicity may be associated with exposure to 2-ET, evidenced as longer gestation length in the 600 and 900 ppm groups and statistically significant exposure-related decreasing trends in fecundity and total and live pups per litter. The toxicity associated with 2-ET appeared to affect the dam primarily as pup body weight was not significantly different from controls in groups exposed to ≤600 ppm and only 13–18% lower in the 900 ppm group compared to controls. Pup survival and pup body weight gain were also generally not affected by gestational 2-ET exposure. Notably, dams exposed to 2-ET during gestation regained body weight during lactation when there was no 2-ET exposure, suggesting reversibility of acute 2-ET toxicity, possibly due to elimination of 2-ET from the body over time.
During the 2-week exposure period, overt toxicity was observed in F1 rat offspring and mice exposed to 600 ppm 2-ET after the first few exposures, including major decreases in body weight and adverse clinical observations in rats and mice. These acute toxicities presented quickly after the first exposure and indicate that exposures ≥600 ppm would not be feasible for evaluating long-term inhalation toxicity of 2-ET. In contrast, in the 150 and 300 ppm groups, the body weights of exposed rats and mice were within 15% of control body weights. Organ weight changes in the liver, kidney, thymus, and lungs were not correlated with microscopic findings and thus were not considered evidence of organ-specific toxicity. Rather, these organ weight changes may be exposure-related decreases in body weight. Further investigation could be conducted on reproductive organs and the thymus, which were not histologically evaluated in the present study but had significant differences in organ weight.
The primary target organ of inhaled 2-ET exposure in the 150 and 300 ppm groups of the tissues examined was the nose, with microscopic lesions of atrophy of the olfactory epithelium and olfactory nerves in both species. Animals that died early that were exposed to 600 ppm had either olfactory epithelium degeneration (rats) or more severe injury of necrosis (mice). This suggests that the thinning and decreased cellularity of the olfactory epithelium and nerve atrophy seen at 150 or 300 ppm is secondary to or arises from ongoing damage to the olfactory epithelium (either degeneration or necrosis). The nasal lesions in mice were often more severe than those observed in the rats, suggesting a species difference in susceptibility. Similar pathologies were observed in our previous study of 2-ET with nose-only inhalation: mild to marked olfactory epithelium atrophy was observed in mice and rats exposed to 1000 ppm and moderate to marked olfactory epithelium necrosis was observed in female mice exposed to 2000 ppm (Roberts et al. Citation2017). In our previous study, increased squamous metaplasia and neutrophilic inflammation were also observed in the respiratory epithelium of mice exposed to 1000 ppm (Roberts et al. Citation2017). Interestingly, these nasal lesions were not seen following 3-ET or 4-ET exposure (Roberts et al. Citation2017) or reported in studies of other C9 alkylbenzenes. Given the lack of a no-observed-effect exposure concentration in this study, lower exposure concentrations and/or longer exposure paradigms could be probed to better characterize the 2-ET dose-response curve to provide data for risk assessment.
Atrophy of the olfactory epithelium and olfactory nerves after only 2 weeks of exposure may have implications for longer studies of 2-ET. As many animals rely on odors to locate and discriminate food (Aimé et al. Citation2007), impaired olfaction in rodents could potentially lead to reduced feed consumption and subsequently lower body weight. On the other hand, the olfactory epithelium can have regenerative capacity even during exposures to toxicants as long as enough regenerating cells remain unharmed (Hurtt et al. Citation1988; Upadhyay and Holbrook Citation2004). Furthermore, rodents exhibit normal olfactory-mediated behaviors even with large reductions in olfactory nerves and epithelium. For instance, social interactions and maternal behaviors were maintained in unilaterally bulbectomized rodents (Devor and Murphy Citation1973; Fleming and Rosenblatt Citation1974) and food-finding behavior was unaffected in mice with only 10% of normal receptor cells in the olfactory epithelium (Harding et al. Citation1978). Thus, the implications of these nasal lesions for feed consumption and other aspects of animal behavior after chronic exposures to 2-ET will depend on the balance of toxicant damage and regenerative capacity of the olfactory epithelium and nerves.
The specificity of these nasal lesions to the olfactory epithelium may be due to the presence of metabolizing enzymes in that particular region of the nasal cavity, whereby metabolic activation leads to cellular toxicity. Indeed, the olfactory epithelium has a higher concentration of metabolic enzymes, including cytochrome P450s, compared to other regions of the nasal cavity (Reed Citation1993; Thornton-Manning and Dahl Citation1997; Upadhyay and Holbrook Citation2004). Other studies of inhaled or systemically administered chemicals have also suggested that the distribution of metabolic enzymes in the nasal mucosa likely dictates the location of observed lesions (Brittebo Citation1993; Genter et al. Citation1995; Upadhyay and Holbrook Citation2004). Furthermore, the distribution of metabolizing enzymes may explain differences in toxicity across species. For example, inhaled styrene produced olfactory epithelium atrophy and degeneration in rats and mice, with mice being markedly more sensitive (Green et al. Citation2001). Pretreatment of mice with inhibitors of CYP2F2 and CYP2E1 prevented the development of the nasal lesions, indicating a role for metabolic activation in styrene nasal toxicity and suggesting low predicted human toxicity due to low levels of styrene metabolism in human nasal tissues (Green et al. Citation2001).
However, knowledge about ET metabolism and kinetics is currently limited. Other C9 alkylbenzenes such as xylenes and trimethylbenzenes are known to be oxidized via cytochrome P450 enzymes but many of these metabolites are presumed to be less toxic than the parent compound (EPA Citation2003, Citation2016b). However, ethylbenzene and xylene have been shown to produce toxic metabolites, albeit at low concentrations (Patel et al. Citation1978; Smith et al. Citation1982; Elovaara et al. Citation1987; Saghir et al. Citation2009). Investigation into the potential generation of toxic metabolites following ET exposure will be important for clarifying mechanisms of toxicity and for understanding species differences and human relevance.
In our previous study, centrilobular necrosis in the liver was observed in animals exposed to 1000 and 2000 ppm 2-ET for 2 weeks (Roberts et al. Citation2017). Here, centrilobular liver hemorrhage and necrosis were observed only in F1 offspring rats and mice in the 600 ppm group where there was clear acute toxicity. These microscopic lesions were not observed in 150 or 300 ppm groups. The liver may be a relevant target organ as C9 alkylbenzenes are known to be metabolized by P450 enzymes in the liver. For instance, 95% of absorbed xylene is metabolized in the liver (Langman Citation1994). However, hepatotoxicity is varied across other C9 alkylbenzenes, where some show indications of hepatotoxicity caused by oxidative stress (ethylbenzene, Zhang et al. Citation2015) while others show mild, potentially adaptive, effects (xylene, ATSDR Citation2007; trimethyl benzenes, EPA Citation2016b) or none (toluene, Brautbar and Williams Citation2002).
During whole-body inhalation exposures, oral and dermal exposures can also occur (Cheng et al. Citation2010). Thus, assessment of 2-ET internal exposure is important for comparing across studies, exposure routes, and species. Based on our preliminary assessment of 2-ET in blood samples collected in this study, the detection of 2-ET indicates that there was systemic exposure to 2-ET after whole-body inhalation exposure. Given the rapid initial metabolism of other inhaled C9 alkylbenzenes in rodents (xylenes: 1–2 h elimination half-life in blood (Tardif et al. Citation1996); trimethyl benzenes: 2–5 h elimination half-life (EPA Citation2016b)), understanding the kinetics of 2-ET will be of value for improved study design and to inform internal dosimetry. Additional kinetic studies on 2-ET would also clarify potential species differences, given that mice are more able to adapt inhaled irritants via reflex-bradypnea (Pauluhn and Mohr Citation2000), thus reducing exposure, and can have different rates of xenobiotic metabolism. While there are some measures of ET in the environment (primarily in the air), internal exposures in humans, which would provide context for the applicability of animal studies, have not been well documented.
Conclusion
Exposure to 2-ET via whole-body inhalation for 2 weeks produced nasal lesions in rats and mice. It is unclear if the pathology observed in the nose would be a limiting consideration in the design of longer studies of 2-ET inhalation toxicity. A no adverse effect level was not able to be determined from this study. Further investigation of mechanisms and toxicokinetics of ET are needed for cross-species translation and for understanding the toxicity of C9 alkylbenzenes mixtures.
Acknowledgments
The authors would like to thank Dr. Shannah Witchey, Dr. Doug Snider, and Dr. Suramya Waidyanatha for their review of the manuscript.
Disclosure statement
No potential conflict of interest was reported by the authors.
Additional information
Funding
References
- Aimé P, Duchamp-Viret P, Chaput MA, Savigner A, Mahfouz M, Julliard AK. 2007. Fasting increases and satiation decreases olfactory detection for a neutral odor in rats. Behav Brain Res. 179(2):258–264.
- ATSDR. 2005. Health consultation: Cooper’s Poynt Elementary School, Camden, Camden County, New Jersey. Atlanta (GA): CDC.
- ATSDR. 2007. Toxicological profile for xylene. Atlanta (GA): CDC.
- Borriston. 1983. Thirteen week gavage administration of PET (MEHSL sample No. 700811) to rats. Washington (DC): USEPA.
- Brautbar N, Williams J, 2nd. 2002. Industrial solvents and liver toxicity: risk assessment, risk factors and mechanisms. Int J Hyg Environ Health. 205(6):479–491.
- Brittebo EB. 1993. Metabolism of xenobiotics in the nasal olfactory mucosa: implications for local toxicity. Pharmacol Toxicol. 72(3):50–52.
- Cheng YS, Bowen L, Rando RJ, Postlethwait EM, Squadrito GL, Matalon S. 2010. Exposing animals to oxidant gases: nose only vs. whole body. Proc Am Thorac Soc. 7(4):264–268.
- Danish EPA. 2016. Survey and risk assessment of toluene and other neurotoxic substances in children’s rooms. København (Denmark): Danish EPA.
- Devor M, Murphy MR. 1973. The effect of peripheral olfactory blockade on the social behavior of the male golden hamster. Behav Biol. 9(1):31–42.
- Dixon WJ, Massey FJ. 1957. Introduction to statistical analysis. 2nd ed. New York (NY): McGraw-Hill Book Company, Inc.
- Dunn OJ. 1964. Multiple comparisons using rank sums. Technometrics. 6(3):241–252.
- Dunnett CW. 1955. A multiple comparison procedure for comparing several treatments with a control. J Am Stat Assoc. 50(272):1096–1122.
- Elovaara E, Zitting A, Nickels J, Aitio A. 1987. m-Xylene inhalation destroys cytochrome P-450 in rat lung at low exposure. Arch Toxicol. 61(1):21–26.
- EPA. 2003. Toxicological review of xylenes. Washington (DC): USEPA.
- EPA. 2010. Hydrocarbon composition of gasoline vapor emissions from enclosed fuel tanks. Washington (DC): USEPA.
- EPA. 2016a. Chemical data reporting for benzene, ethylmethyl. Washington (DC): USEPA.
- EPA. 2016b. Toxicological review of trimethylbenzenes. Washington (DC): USEPA.
- Fleming AS, Rosenblatt JS. 1974. Olfactory regulation of maternal behavior in rats. I. Effects of olfactory bulb removal in experienced and inexperienced lactating and cycling females. J Comp Physiol Psychol. 86(2):221–232.
- Gart JJ, Chu KC, Tarone RE. 1979. Statistical issues in interpretation of chronic bioassay tests for carcinogenicity. J Natl Cancer Inst. 62(4):957–974.
- Genter MB, Owens DM, Deamer NJ. 1995. Distribution of microsomal epoxide hydrolase and glutathione S-transferase in the rat olfactory mucosa: relevance to distribution of lesions caused by systemically-administered olfactory toxicants. Chem Senses. 20(4):385–392.
- Gralewicz S, Wiaderna D. 2001. Behavioral effects following subacute inhalation exposure to m-xylene or trimethylbenzene in the rat: a comparative study. Neurotoxicology. 22(1):79–89.
- Green T, Lee R, Toghill A, Meadowcroft S, Lund V, Foster J. 2001. The toxicity of styrene to the nasal epithelium of mice and rats: studies on the mode of action and relevance to humans. Chem Biol Interact. 137(2):185–202.
- Harding JW, Getchell TV, Margolis FL. 1978. Denervation of the primary olfactory pathway in mice. V. Long-term effect of intranasal ZnSO4 irrigation on behavior, biochemistry and morphology. Brain Res. 140(2):271–285.
- Hazleton Labs. 1983. Two-week gavage administration of PET to rats- final report. Microfiche No. OTS 0206422. Obtained from the U.S. Environmental Protection Agency, Office of Pollution, Prevention and Toxic Substances.
- Hellén H, Hakola H, Laurila T, Hiltunen V, Koskentalo T. 2002. Aromatic hydrocarbon and methyl tert-butyl ether measurements in ambient air of Helsinki (Finland) using diffusive samplers. Sci Total Environ. 298(1–3):55–64.
- Hsu JC. 1992. The factor analytic approach to simultaneous inference in the general linear models. J Comp Graph Stat. 1:151–168.
- Hurtt ME, Thomas DA, Working PK, Monticello TM, Morgan KT. 1988. Degeneration and regeneration of the olfactory epithelium following inhalation exposure to methyl bromide: Pathology, cell kinetics, and olfactory function. Toxicol Appl Pharmacol. 94(2):311–328.
- IARC. 2000. Ethylbenzene. IARC monographs on the evaluation of carcinogenic risks to humans. Lyon (France): IARC.
- ICCA. 2012. Initial assessment profile for C9 aromatic hydrocarbon solvents category (screening initial data set [SIDS]). Amsterdam (The Netherlands): ICCA.
- IRDC. 1980. Pilot teratology study in rats (final report) with attachments and cover letter containing information from four other reports dated 022592. Indianapolis (IN): International Research and Development Corporation.
- IRDC. 1981. Teratology study in rabbits dosed with p-ethyl toluene by oral gavage with attachments. Indianapolis (IN): International Research and Development Corporation.
- Jonckheere AR. 1954. A test of significance for the relation between m rankings and k ranked categories. Br J Stat Psychol. 7(2):93–100.
- Korsak Z, Rydzyński K. 1996. Neurotoxic effects of acute and subchronic inhalation exposure to trimethylbenzene isomers (pseudocumene, mesitylene, hemimellitene) in rats. Int J Occup Med Environ Health. 9(4):341–349.
- Langman J. 1994. Xylene: its toxicity, measurement of exposure levels, absorption, metabolism and clearance. Pathology. 26(3):301–309.
- McMullin TS, Bamber AM, Bon D, Vigil DI, Van Dyke M. 2018. Exposures and health risks from volatile organic compounds in communities located near oil and gas exploration and production activities in Colorado (U.S.A.). Int J Env Res Public Health. 15(7):1500.
- NTP. 1999. Toxicology and carcinogenesis studies of ethylbenzene (CAS No.100-41-4) in F344/N rats and B6C3F1 mice. Research Triangle Park (NC): US Department of Health and Human Services, Public Health Service, National Institutes of Health.
- NTP. 2009. Toxicology and carcinogenesis studies of cumene (CAS No. 98-82-8) in F344/N rats and B6C3F1 mice. Research Triangle Park (NC): US Department of Health and Human Services, Public Health Service, National Institutes of Health.
- NTP. 2013. N.T.P. report on carcinogens: monograph on cumene. Research Triangle Park (NC): US Department of Health and Human Services, Public Health Service, National Institutes of Health.
- Patel JM, Harper C, Drew RT. 1978. The biotransformation of p-xylene to a toxic aldehyde. Drug Metabol Disp. 6(4):368–374.
- Pauluhn J, Mohr U. 2000. Inhalation studies in laboratory animals-current concepts and alternatives. Toxicol Pathol. 28(5):734–753.
- Reed CJ. 1993. Drug metabolism in the nasal cavity: relevance to toxicology. Drug Metab Rev. 25(1–2):173–205.
- Roberts GK, Willson CJ, Olivera DS, Malarkey DE, Morgan DL. 2017. Comparative inhalation toxicity of ethyltoluene isomers in rats and mice. Inhal Toxicol. 29(12–14):577–585.
- Saghir SA, Rick DL, McClymont EL, Zhang F, Bartels MJ, Bus JS. 2009. Mechanism of ethylbenzene-induced mouse-specific lung tumor: metabolism of ethylbenzene by rat, mouse, and human liver and lung microsomes. Toxicol Sci. 107(2):352–366.
- Shi J, Deng H, Bai Z, Kong S, Wang X, Hao J, Han X, Ning P. 2015. Emission and profile characteristic of volatile organic compounds emitted from coke production, iron smelt, heating station and power plant in Liaoning Province, China. Sci Total Environ. 515–516:101–108.
- Shirley E. 1977. A non-parametric equivalent of Williams’ test for contrasting increasing dose levels of a treatment. Biometrics. 33(2):386–389.
- Smith BR, Plummer JL, Wolf CR, Philpot RM, Bend JR. 1982. p-Xylene metabolism by rabbit lung and liver and its relationship to the selective destruction of pulmonary cytochrome P-450. J Pharmacol Exp Ther. 223(3):736–742.
- Swiercz R, Rydzyński K, Jajte J, Stetkiewicz J, Majcherek W. 2000. Studies on dermal, ocular and respiratory effects of 4-ethyltoluene in experimental animals. Int J Occup Med Environ Health. 13(4):307–315.
- Tardif R, Charest-Tardif G, Brodeur J. 1996. Comparison of the influence of binary mixtures versus a ternary mixture of inhaled aromatic hydrocarbons on their blood kinetics in the rat. Arch Toxicol. 70(7):405–413.
- Thornton-Manning JR, Dahl AR. 1997. Metabolic capacity of nasal tissue: interspecies comparisons of xenobiotic-metabolizing enzymes. Mutat Res. 380(1–2):43–59.
- Tukey JW. 1977. Exploratory data analysis. Reading (MA): Addison-Wesley.
- Upadhyay UD, Holbrook EH. 2004. Olfactory loss as a result of toxic exposure. Otolaryngol Clin North Am. 37(6):1185–1207.
- Wang G, Cheng S, Lang J, Li S, Tian L. 2016. On-board measurements of gaseous pollutant emission characteristics under real driving conditions from light-duty diesel vehicles in Chinese cities. J Environ Sci. 46:28–37.
- Williams DA. 1971. A test for differences between treatment means when several dose levels are compared with a zero dose control. Biometrics. 27(1):103–117.
- Williams DA. 1972. The comparison of several dose levels with a zero dose control. Biometrics. 28(2):519–531.
- Williams DA. 1986. A note on Shirley’s nonparametric test for comparing several dose levels with a zero-dose control. Biometrics. 42(1):183–186.
- Zhang M, Wang Y, Yang D, Zhang J, Gu Q. 2015. Roles of oxidative damage and mitochondria-mediated apoptosis in ethylbenzene-induced hepatotoxic effects in rat. Inhal Toxicol. 27(1):64–73.
- Zhang Z, Wang H, Chen D, Li Q, Thai P, Gong D, Li Y, Zhang C, Gu Y, Zhou L, et al. 2017. Emission characteristics of volatile organic compounds and their secondary organic aerosol formation potentials from a petroleum refinery in Pearl River Delta, China. Sci Total Environ. 584–585:1162–1174.