
ABSTRACT
The study was conducted to determine how biochar as a soil amendment maintained the microbial community in pesticide contaminated soils. Alfisol (Adenta series – Typic Kandiustalf) and Vertisol (Akuse series – Typic Calciustert) were amended with biochar (0 t/ha biochar, 10 t/ha cocoa husk biochar (CHB), 10 t/ha rice husk biochar (RHB)) and pesticides (atrazine and paraquat at two rates each namely 0 kg/ha pesticide and 10 times the normal recommended rate of pesticide) were applied. The CHB-amended soils stimulated microbial activities such as ammonia and nitrate release more than the RHB-amended soils. Basal respiration was significantly higher in the atrazine polluted soils than in paraquat polluted soil. Significant interaction occurred between soil type and biochar and high microbial biomass carbon was recorded for vertisol amended with CHB. Metabolic quotient was lower in soils amended with biochar and polluted with atrazine than in the un-amended soil. The use of CHB in soil of high clay content (47.5%, i.e. the vertisol) was a more effective management tool in maintaining the microbial community in a pesticide-polluted environment than in soil of lower clay content (22.5%). Soils of high clay content amended with biochar can sustain the soil microbial community even in a disturbed environment.
Introduction
Biochar has been an ideal soil management tool in recent times due to its long-term stability and recalcitrant nature with soil sequestration capabilities for economic and environmental benefits (Winsley Citation2007; Lehmann & Joseph Citation2009; Ippolito et al. Citation2012). Although biochar is highly recalcitrant, it is possible to be degraded by microorganisms co-metabolically (Hamer et al. Citation2004). The labile part of biochar is degradable microbiologically within months of application whilst the stable fraction consists of recalcitrant compounds that remain years after application of biochar (Mašek et al. Citation2013). Increases in nutrients and labile C will result from biochar additions to soil, and the net effect on biochar mineralization will depend on the proportion of labile C and the nutrient contents in the biochar applied as well as inorganic nutrients available from the soil. Amendment of soil with biochar stimulates microbial activities such that nitrification was increased in forest soils (DeLuca et al. Citation2002; Berglund et al. Citation2004; Gundale & DeLuca Citation2006; MacKenzie & DeLuca Citation2006; Ball et al. Citation2010). Gross nitrification was stimulated in agricultural soils (Nelissen et al. Citation2012) and the author reasoned that it was due to increased mineralization of from the recalcitrant soil N pool. On the other hand, biochar additions to agricultural and grassland soils have shown lower N availability for plants (Lehmann et al. Citation2003), which could be likely as a result of N immobilization during mineralization of a labile fraction of the biochar bearing a high C/N ratio (Deenik et al. Citation2010). The method of pyrolysis during biochar preparation has an influence on the mineralization–immobilization of soil N, thus soil application of fresh fast pyrolysis biochar, 43% of the N was immobilized during a 65-day incubation experiment (Bruun et al. Citation2012). A similar observation was made by Zheng et al. (Citation2013).
Yao et al. (Citation2012) noted that some high temperature biochars (600°C) were able to remove nitrate from solution and that increase in pyrolysis temperature may improve the sorption ability of biochars to aqueous nitrate. Also, bamboo biochar made at 900°C had relatively higher nitrate adsorption capacity (Mizuta et al. Citation2004). Biochar may not only affect soil ion exchange capacity but also provide refugia for soil microbes to influence the binding of nutritive cations and anions when applied to soils (Liang et al. Citation2006; Atkinson et al. Citation2010).
Experimental results have indicated a lower metabolic quotient (Liang et al. Citation2010), but also a lower absolute amount of respired C or C turnover (Murage et al. Citation2007; Kuzyakov et al. Citation2009; Spokas et al. Citation2009; Kimetu & Lehmann Citation2010; Liang et al. Citation2010) or no change (Zackrisson et al. Citation1996; Haefele et al. Citation2009; Steiner et al. Citation2009; Van Zwieten et al. Citation2010) in biochar amended soils. Disturbances caused by pesticidal chemicals applied to soil increased the metabolic quotient resulting from microbes utilizing large part of their energy budget for maintenance than cell synthesis (Anderson & Domsch Citation1990) in soils un-amended with biochar. Undesirable, insignificant or positive impact of biochar on soil microbial community have been reported depending on the biochar employed and type of soil (Steinbeiss et al. Citation2009) with the knowledge that no two biochars are the same. Phenolics and polyphenolics may be present in biochar (these are organic pyrolytic products) and these negatively affect soil microorganisms (Warnock et al. Citation2010).
Little study has been done to elucidate the changes that occur in the microbial community with the application of biochars of different feed stocks in soils with different quantities and types of clay. Strong correlations have been observed between the percentages of clay content and bacterial population (Girvan et al. Citation2003; Fang et al. Citation2007; Zhang et al. Citation2007; Mohammad Citation2015), suggesting that soil texture is of importance in contributing to soil microbial population. One possible explanation was that the finer particle fractions provided a protective habitat for microorganisms (especially bacteria) through pore size exclusion of predators (Elliot et al. Citation1980; Postma & Veen Citation1990; Zhang et al. Citation2007).
We therefore hypothesized that soil of high clay content and amended with biochar will sustain and maintain microbial community better when contaminated with pesticides than soil of low clay content and un-amended with biochar.
Soils of different clay types and different clay quantities are extensively used in growing vegetables in some countries in West Africa. Atrazine and paraquat are used by farmers growing vegetables on these soil types and some farmers apply more than the recommended rate of pesticide as an insurance that the pest will be well controlled. Biochar can be used to prevent the microbial community from toxic effect of the pesticide application if any.
The objective of the study was to determine the influence of biochars from different feed stocks on the microbial communities in an alfisol and vertisol that have been contaminated with pesticides.
Materials and methods
Soils, sampling and soil preparation
The soils used in this study were alfisol and vertisol. The alfisol was sampled from the University of Ghana Experimental Farm, Legon where there has been no previous history of atrazine nor paraquat application. The site is located on latitude 05°39′03″N and longitude 00°11′13″W. The vertisol was collected from a pristine site at the Akuse Junction in the Eastern Region of Ghana at latitude 6°09′N, longitude 00°04′E and at an altitude of 22 m above mean sea level. With a soil corer, soil samples were taken at a particular site from 0 to 20 cm depth from the surface of the soil along a transect. Many core samples were taken with the corer and bagged in sacs and brought to the Laboratory of the Department of Soil Science, University of Ghana. The soil samples were then mixed thoroughly to form a composite sample. Some of the soil sample was sieved through a 2 mm sieve and weighed into pots for greenhouse studies. Part of the sieved soil samples were air-dried for physical and chemical analyses.
The undisturbed clod samples were collected for bulk density analysis.
Bulk density was determined by the clod method for the vertisol and that for the alfisol was determined using the core method by Blake and Hartge (Citation1965). The particle size analysis of the soil was determined using the Bouyoucos hydrometer method modified by Day (Citation1965). The pH of the soil was determined in distilled water at soil to water ratio of 1:1 and 1:2 in 0.01 M CaCl2 using a HANNA pH 213 microprocessor pH meter. The wet combustion method of Walkley and Black (Citation1934) was used to determine the organic carbon (OC). The Kjeldahl digestion procedure as outlined by Anderson and Ingram (Citation1993) was used in the determination of total nitrogen.
The available P of the vertisol was extracted by the method of Olsen et al. method (Citation1954) and that of the alfisol was extracted using Bray 1 method (Bray & Kurtz Citation1945). The concentration of P in the extracts was then determined using the method of Murphy and Riley (Citation1962). The intensity of the colour at a wavelength of 712 nm was measured with the spectrophotometer and recorded. The cation exchange capacity (CEC) of the soils was determined using the ammonium-acetate method.
The characteristics of the soil used are presented in .
Table 1. Some physico-chemical properties of the soils and biochar used for the greenhouse incubation study.
Preparation of biochar
The feedstocks used for biochar production were cocoa pod husk and rice husk that have been conventionally grown in the fields of farmers. The collected samples were air-dried, oven-dried overnight at 80°C and the cocoa pod husk was subsequently cut into small pieces. A kiln at the Soil Research Institute of the Council for Scientific and Industrial Research, Kwadaso, Kumasi, Ghana was used for biochar production at a temperature of 350°C. After pyrolysis, biochar in the kiln was allowed to cool overnight to room temperature and washed to remove the ash, dried, crushed, sieved through <2 mm sieve and sealed in sack for use.
The bulk density of the biochar was determined by an amount of the air-dried biochar sample being carefully packed amidst intermittent tapping on the laboratory bench (to ensure good packing) into a measuring cylinder to a pre-determined volume (Vt). The quantity of sample packed was then transferred into a moisture can and put in an oven at 105°C to dry for 24 h after which its mass (Ms) was recorded.
pH of the biochar was determined by weighing 1 g of each biochar (i.e. cocoa husk biochar (CHB) and rice husk biochar (RHB)) into a beaker and 10 ml of distilled water added, to give biochar water ratio of 1:10. The pH values were determined using a glass electrode pH meter-CG818, Schott Great. The determination of pH of the samples was repeated using 1 M KCl solution according to the protocol outlined.
OC of the biochar was determined by the wet combustion method of Walkley and Black (Citation1934) as described previously above.
Available phosphorus in the biochar samples was extracted by the Olsen et al. method (Citation1954). The concentration of the P in each sample was then determined after colour development using the method of Murphy and Riley (Citation1962).
Total phosphorous in the biochar was determined by digesting 0.2 g of biochar with 25 ml of a mixture of concentrated HNO3 and 60% HClO4 in the ratio of 2:3. Distilled water was added to the digest, filtered and made up to volume in a 100 ml volumetric flask. Phosphorus in the digest was then determined as described by Murphy and Riley (Citation1962) method.
Total nitrogen in the biochar was determined by a modified Kjeldahl digestion method (Bremner Citation1965). The nitrogen in the sample was converted to ammonium by digestion with concentrated sulphuric acid using selenium as catalyst and addition of K2SO4 to raise the boiling point of the mixture. The ammonium formed was determined by distilling the digest with a strong alkali (40% NaOH) and titrating with a standard acid.
CEC of the CHB and RHB was determined by weighing 10 g of each biochar into an extraction bottle and 100 ml of 1 M ammonium-acetate solution added. The CEC of the material was then determined using the method outlined previously for soil CEC.
The two biochar types were ground into fine powder in a mortar ensuring that there was no cross-contamination in order to identify the minerals that may be present in the biochar. An Empyrean X-ray diffractometer was used for the X-ray analysis. A Cu K-alpha and beta radiations were produced using 40 mA and 45 kV power source. The ground samples were mounted on a divergence slit and diffraction patterns of the biochar samples were obtained by scanning the samples at a starting position of 1°/min between 3° and 60°. The X-ray diffraction (XRD) patterns were acquired with a computer controlled Panalytical Empyrean X-ray powder diffractometer to determine the type of minerals present.
Incubation study to assess the microbial community in biochar amended soil contaminated with pesticides
The study was conducted in a greenhouse at the University of Ghana, Legon. Daytime temperatures in the greenhouse ranged from 32°C to 35°C. The relative humidity of the greenhouse was between 63% and 84% during the day time and 93% at night time. Eight kilograms of the vertisol and 9.7 kg of the alfisol were weighed into plastic buckets with perforated bottoms (a saucer plate was underneath each pot) to a pre-determined height to attain the field bulk density of the two soils. Biochar was added to both soil samples such that the alfisol had 0.381% (w/w) and the vertisol 0.36% (w/w) biochar and mixed thoroughly with soil sample. The packed mixed soils were left undisturbed for three weeks prior to the application of treatments to allow for stabilization of microbial activity. The soil moisture content was kept constant at 80% field water capacity during the period of incubation. At the end of the three weeks, the following experimental treatments were applied:
Four levels of herbicides were used:
0× the normal recommended rate of atrazine (AT0)
0× the normal recommended rate of paraquat (PQ0)
10× the normal recommended rate for atrazine (AT10)
10× the normal recommended rate for paraquat (PQ10)
Three biochar treatments used were as follows (treatments were applied to soil previously and incubated for three weeks as indicated above):
RHB at 10 t/ha
CHB at 10 t/ha
No biochar at 0 t/ha (CN – control)
The experimental design was the 2 × 3 × 4 factorial treatments in a completely randomized design pot experiment. Thus, two types of soil, three levels of biochar and four pesticide levels were used. The number of replicate was 3.
Ten times the normal application rate of atrazine was 35 kg active ingredient/ha whilst that for paraquat was 360 g active ingredient/ha. The incubation period lasted 90 days. Sampling of soil for analysis was done at days 0, 10, 20, 30, 40 up to 90 to determine the microbial biomass carbon, microbial respiration and available nitrogen.
The gas entrapment method by Hutchinson and Mosier (Citation1981) and Sullivan et al. (Citation2010) was used to measure the soil microbial respiration. Measurements were taken from day 3 to day 90, i.e. at three days intervals. A 10 ml solution of 1 M NaOH was dispensed into a vial and placed under a plastic chamber to trap CO2 evolved from soil contained in the pot experiment. Another vial containing 10 ml of 1 M NaOH with the lid on to exclude CO2 evolved from the soil served as control to account for the CO2 trapped from the atmosphere. This vial was placed in a similar plastic chamber. The trapping solutions in the vials were changed every 72 h. The vials were then removed, covered with lids (air tight seal) immediately and taken to the laboratory for analysis. For 30 min, the whole system was aerated and fresh sodium hydroxide (1 M) in a new vial was placed on the soil surface and covered with the plastic chamber. A similar thing was done for the control treatment. Barium chloride (1 M BaCl2) was added to the solutions in the vials from the experimental pots to precipitate the carbonates to facilitate determination of CO2 evolved from the soil. The evolved CO2 was then determined by titration. Excess NaOH in solution was titrated against 1.0 M HCl using phenolphthalein indicator after precipitating the carbonate formed with 1.0 M BaCl2.
Microbial biomass carbon was determined by the method of chloroform fumigation and extraction as described by Ladd and Amato (Citation1989). Ten grams of soil sample from the experimental pots on a particular sampling day was taken with a sterilized spatula. Cross-contamination was avoided by washing the spatula with distilled water and cleaned with clean tissue paper between each sampling. The soil was put into a beaker and placed in a desiccator. Another beaker containing 80 ml of alcohol –free chloroform with boiling chips was placed by the soil sample and chloroform fumigation carried out. Another beaker containing soil sample (10 g) was placed in a separate desiccator without chloroform representing the un-fumigated control soil sample. The desiccators were covered with black polythene bag (darkness prevents the chloroform from breaking down) and allowed to stand at room temperature for five days (Anderson & Ingram Citation1993). Immediately after fumigation, 50 ml of 0.5 M K2SO4 solution was added to the soil samples to extract microbial carbon from the lysed microorganisms. The amount of microbial carbon in the extract was determined using the colourimetric method.
To an aliquot (5 ml) of the extract, were added 5 ml of potassium dichromate (0.1667 M) and 10 ml concentrated sulphuric acid. The resulting solution was allowed to cool for 30 min after which 10 ml of distilled water was added.
A standard series was developed concurrently with anhydrous dexterous serving as carbon source with concentrations ranging from 0, 2.5, 5.0, 7.5, 10.0 mg/ml. Potassium dichromate (0.1667 M) and 10 ml concentrated sulphuric acid were added to the anhydrous dexterous serving as the standard carbon source.
The absorbances of the standard and sample solutions were read on a quant-Lambda 850 spectrophotometer at a wavelength of 600 nm. A standard curve was obtained by plotting absorbance values of the standard solutions against their corresponding concentrations. Extracted carbon concentration of the samples was determined from the standard curve. For biomass C, a k-factor of 0.35 (Sparling et al. Citation1990) was used.
The following equation according to Sparling and West (Citation1998) was used to estimate the microbial C from the extracted C:
where EC is the chloroform–labile C pool (EC), and is proportional to microbial biomass C, FC is the C from the fumigated sample, UFC is the C from the un-fumigated sample and k is the fraction of the killed microbial biomass extracted as carbon under standardized conditions.
For the determination of the available nitrogen, 5 g of the soil was taken from the experimental pot in the greenhouse with a clean spatula and weighed into a centrifuge bottle and 50 ml of 2 M KCl solution added. The contents were shaken for 30 min on a mechanical shaker after which the sample was filtered. Five millilitres of the filtrate was pipetted into a micro Kjeldahl flask and 0.2 g of MgO was added. The flask was connected to a distillation apparatus and about 30 ml of the distillate was collected in 5 ml of 2% boric acid to which three drops of methyl red–methylene blue indicator mixture had been added. The distillate was then back titrated with 0.01 M HCl to a purplish end point for ammonium-N determination.
One millilitre of sulphamic acid and 0.2 g Devarda’s alloy were then added to the contents of the flask and the distillate collected in a new conical flask containing 5 ml of 2% boric acid and three drops of the mixed methyl red and methylene blue indicator. The distillate was then back titrated against 0.01 M HCl from a green to a purplish end point to account for the level of nitrate in the soil. The respective concentrations of and
in the soil were then determined from the number of moles of HCl consumed in the two back titration reactions.
The metabolic quotient was calculated as the ratio of basal respiration to microbial biomass C (Anderson & Domsch Citation1990).
Statistical analysis
The data collected from the various experiments were subjected to analysis of variance using GENSTAT 12th edition software. Microsoft Excel software was used to effectively order and summarize the mean values into tables and graphs. Tests of significance for interactions and main factors were carried out at 5% level of significance.
Results
Some physico-chemical properties of biochars used in the study are presented in . The CHB and RHB had OC content of 260.0 and 291.0 g/kg, respectively, and total nitrogen content were 3.5 and 1.4 g/kg, respectively, giving a carbon to nitrogen ratio (C:N) of 73.14 for CHB and 212.14 for RHB. Biochar pH values were 10.4 and 7.4 for the CHB and RHB. The CHB had high available P (3897.7 mg/kg soil) which was seven times higher than that of the RHB. An XRD examination carried out on both the CHB and RHB to determine the minerals present showed that the diffraction patterns of the two samples had silica (SiO2) the main mineral present (). In addition to the silica, CHB had other main minerals such as potassium hydrogen carbonate (KHCO3), aluminium iron (iii) oxide (AlFeO3) and iron oxide hydroxide (FeOOH). The minor minerals in CHB include periclase (MgO), magnesium oxide (MgO) and magnesium carbonate (MgCO3). The RHB had only magnesium hydroxide (Mg[OH]2) ().
Figure 1. XRD spectra of biochars (CHB and RHB). Note: A = silica (SiO2), F = periclase (MgO), G = magnesium oxide (MgO), H = magnesium carbonate (MgCO3), I = potassium hydrogen carbonate (KHCO3), J = aluminium iron (iii) oxide (AlFeO3), K = iron oxide hydroxide (FeOOH), P = magnesium hydroxide (Mg[OH]2).
![Figure 1. XRD spectra of biochars (CHB and RHB). Note: A = silica (SiO2), F = periclase (MgO), G = magnesium oxide (MgO), H = magnesium carbonate (MgCO3), I = potassium hydrogen carbonate (KHCO3), J = aluminium iron (iii) oxide (AlFeO3), K = iron oxide hydroxide (FeOOH), P = magnesium hydroxide (Mg[OH]2).](/cms/asset/5371b6ab-5099-47b4-a1d9-0814de065f5c/sagb_a_1302504_f0001_c.jpg)
Ammonification of soils amended and un-amended with biochar and contaminated with pesticides
Ammonification was higher in the vertisol than in the alfisol and the effect was significant throughout the period of incubation (p < .001) ((a)). Biochar type influenced ammonification with soils amended with CHB treatments recorded the highest ammonification values followed by the soils amended with RHB and the un-amended soil samples (CN) where no biochar was added ((b)). Atrazine at 10× the normal recommended rate caused high ammonification as compared to 10× the normal application rate of paraquat. Soil samples unpolluted with pesticide recorded low ammonification values and no significant difference existed between them and the paraquat treated soil samples ((c)).
Figure 2. (a) Ammonia released from soils of different clay contents, (b) soils amended with biochar of different feed stocks and (c) soils contaminated with different rates of pesticides (atrazine and paraquat) in a greenhouse incubation study.
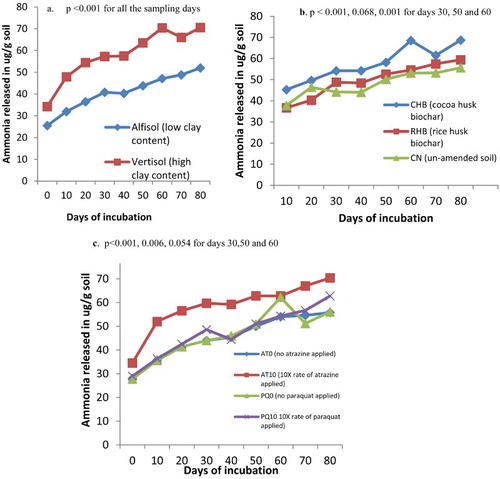
Significant interaction existed between the biochar and the pesticide for most of the incubation days (p = .002, .014, .003 for days 10, 30 and 40). No significant interaction existed between soil × biochar × pesticide for all the days sampled (p < .995).
Nitrification of soils amended with biochar and influenced by pesticide application
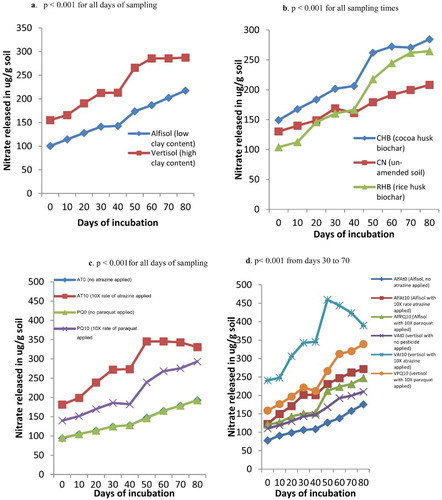
Nitrification was generally high in the vertisol than in the alfisol and the effect was significant (p < .001) throughout the sampling times ((a)). Nitrification was highest in the CHB amended soils followed by the RHB amended soil and the un-amended soil (CN) of low nitrification (p < .001). Initially, for the RHB amended soils, nitrification was lower than the un-amended soil but from day 40, nitrification rose high ((b)). Nitrification was high in treatments where 10× the normal rate of atrazine was applied and the effect was significantly different from the rest of other pesticide treatments (p < .001 for all sampling times) ((c)). Significant interaction occurred between the soil and pesticide treatment such that the vertisol where atrazine was applied at 10 times the recommended rate (VAt10) recorded high nitrification values throughout the sampling times as compared to the other treatments (p < .001 for days 10, 30 to 70) ((d)). Significant interaction also occurred between biochar × pesticide such that soils amended with CHB and contaminated with 10× atrazine recorded high nitrification values (p < .001 for days 0, 10, 50 and 60). High nitrification was observed in day 50 in the soil × pesticide interaction ((d)) and biochar × pesticide interaction.
Figure 3. (a) Nitrate released from soils of different clay contents, (b) soils amended soil with biochar of different feed stocks, (c) soils contaminated with different rates of pesticides (atrazine and paraquat) and (d) soil × pesticide interaction during a greenhouse incubation study.
Ammonification and nitrification rates of soils amended with biochar and pesticides applied
Ammonification rate was generally three times higher in the vertisol than in the alfisol () and the differences in treatments were significant (p < .001). All the un-amended soils had low rate of ammonification, ammending the soils with biochar (regardless of the biochar type) increased the rate of ammonification in both the alfisol and the vertisol. Also applying pesticides, be it paraquat or atrazine to the un-amended soil increased the rate of ammonification. Alfisol ammended with CHB and uncontaminated with pesticide, immobilistion of ammonium-N was observed such that the ammonification rate was negative (). The highest ammonification rate was observed for the vertisol amended with RHB and uncontaminated with pesticide (ammonification rate was 1.0 μg/g soil/day).
Table 2. Ammonification, nitrification and carbon mineralization rates of soils amended with biochar of different feed stocks and contaminated with pesticides (atrazine and paraquat) of various rates.
Nitrification rates were generally higher than the ammonification rates () because as the ammonium ion was released through ammonification, the nitrifiers used the ion by converting it to nitrite and nitrate. Also, the nitrification rates were higher in the vertisol than in the alfisol (p < .001). Ammending the soil with biochar increased nitrification rate especially with RHB more than with CHB. Both pesticides in the amended soil (be it CHB or RHB amended soils) increased nitrification. Un-amended soils polluted with pesticides also recorded high nitrification rates. Nitrification rates were higher with atrazine contaminated soil than with paraquat contaminated soil. For the alfisol, the highest nitrification rate of 2.438 μg/g soil/day was obtained when that soil was amended with RHB and contaminated with atrazine. The highest nitirification rate of 4.312 μg/g soil/day was obtained when the vertisol was amended with RHB and atrazine applied, followed by CHB amended vertisol with nitrification rate of 3.982 μg/g soil/day ().
Microbial biomass carbon of soils amended and un-amended with biochar and pesticide applied
Microbial biomass carbon generally increased with the incubation of various treatments, peaking around day 60 and from then, there was a decrease in the microbial biomass carbon ().
Figure 4. (a) Microbial biomass carbon of soils of different clay content, (b) soils amended with biochar of different feed stocks, (c) soils contaminated with different rates of pesticides (namely atrazine and paraquat) and (d) soil × biochar interaction during an incubation study in the greenhouse.
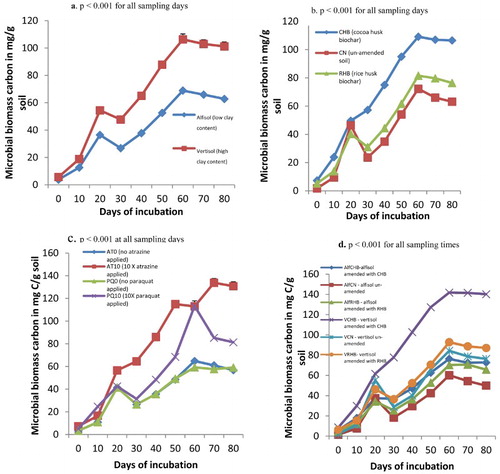
Microbial biomass carbon was significantly high in the vertisol than in the alfisol for all sampling times (p < .001) ((a)).
Amending soils with CHB biochar increased the microbial biomass carbon as compared to soils amended with RHB and the un-amended soil that had low microbial biomass carbon (p < .001) ((b)). When pesticides were applied, atrazine at 10 times normal application rate caused high microbial biomass carbon for most of the days (suggesting that components of atrazine served as source of carbon and nitrogen for the microbes in soil) followed by paraquat at 10 times the normal application rate (PQ10) followed by the treatment with no pesticide applied (AT0 and PQ0) that had low microbial biomass carbon. At day 60 of incubation, there was no significant difference between treatments AT10 and PQ10 ((c)).
Significant interaction occurred between the soil type and biochar and high microbial biomass carbon was recorded for the treatment where vertisol was amended with CHB as compared to the rest of the other treatments ((d)). Even after days 60–80, high microbial biomass carbon was maintained in that treatment and the effect was highly significant than the other treatments.
Significant interaction also existed between the soil and the pesticide (p < .001 from days 30 to 80). Thus, microbial biomass carbon was high in vertisol where 10 times the normal rate of atrazine had been applied followed by similar treatments where 10 times the normal rate of paraquat had been applied. Also significant interaction existed between the biochar type and pesticide (p < .001 for all sampling days except day 10 where p = .010).
Basal respiration and carbon mineralization of soils amended and un-amended with biochar and pesticides applied
Basal respiration was the carbon dioxide evolved from sample treatments every 10 days during the incubation period and it was significantly higher in the vertisol than in the alfisol at any point in time (p < .001) and on day 80 there was no significant differences in treatment (p = .543) ((a)). Basal respiration was also high in CHB amended soil sample than RHB and the un-amended (CN samples) ((b)). The use of atrazine at 10 times the recommended rate stimulated high basal respiration values than the other pesticide levels for all sampling times ((c)) suggesting the ease soil microbes degraded atrazine as compared to paraquat. Significant interaction existed between the soil and pesticide such that from day 30 to day 50 of incubation, significantly high values of basal respiration values were recorded for soil samples treated with 10× the normal rate of pesticide application especially for the VAt10 treatment, i.e. vertisol contaminated with atrazine at 10 times the normal rate of recommendation ((d)). Such an observation was not made for the soil samples not treated with pesticide.
Figure 5. (a) Basal respiration as measured as carbon dioxide carbon evolved from soils of different clay contents, (b) soils amended with biochar of different feed stocks, (c) soils contaminated with pesticides (atrazine and paraquat) at different rates and (d) soil × pesticide interaction during an incubation study in the greenhouse.
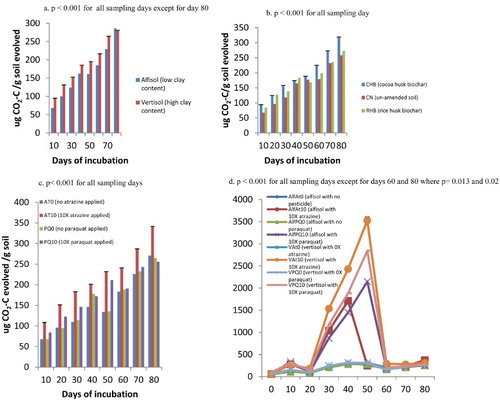
Carbon mineralization increased with time for both the alfisol and vertisol that no pesticide had been applied ((a,b)). High carbon mineralization was observed when the vertisol and alfisol were amended with CHB compared to RHB amendment. The un-amended soils had the low carbon mineralization values ((a,b)).
When the soils were contaminated with pesticides, carbon mineralization increased with time in all treatments ((c,d)). The highest carbon mineralization was observed in vertisol amended with CHB and contaminated with atrazine (VCHBAt) followed by vertisols amended with RHB and also contaminated with atrazine ((d)). The pattern of the carbon mineralization for the treatment VCHBAt was significantly higher than all the other treatments for all the days sampled (p < .001). The steep ascendency suggests that had the incubation period been prolonged, more CO2 would have evolved.
Figure 6. (a and b) Carbon mineralization in the alfisol and vertisol when no has been pesticide applied (i.e. 0 kg a.i/ha atrazine and paraquat applied), (c) carbon mineralization in the alfisol contaminated with 10× the normal rate of atrazine and paraquat and (d) carbon mineralization in the vertisol contaminated with 10× the normal rate of atrazine and paraquat during a greenhouse incubation study.
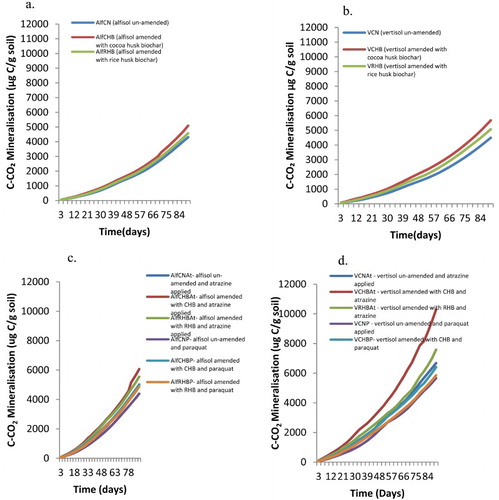
Carbon mineralized from CHB was 72% more than that from the RHB suggesting that CHB had more labile carbon than RHB. Mineralization of biochar carbon was calculated as the difference between carbon dioxide evolved from the biochar amended soil minus the carbon dioxide evolved from the un-amended soil.
Carbon mineralization rates were generally higher for vertisol than the alfisol even for similar treatments and the effect was significant (p < .001) (). Amending the soil with biochar increased the carbon mineralization rate regardless of the type of biochar used. For the alfisol, the highest carbon mineralization rate was obtained when it was amended with CHB and atrazine was applied at 10 times the recommended rate. Similarly for the vertisol, the highest mineralization rate was recorded when it was amended with CHB and atrazine was applied at 10 times the recommended rate.
Metabolic quotient assessing microbial community in soils amended with biochar
Metabolic quotient was generally lower in the vertisol compared to the alfisol. The metabolic quotient decreased with time and by days 50 and 60, low values were recorded for both the vertisol and the alfisol. From day 70 onwards the values rose with time ((a)).
Figure 7. (a) Metabolic quotient of soils of different clay content, (b) soils amended with biochar of different feed stocks and (c) soils contaminated with different rates of pesticides (atrazine and paraquat) during an incubation study in the greenhouse.
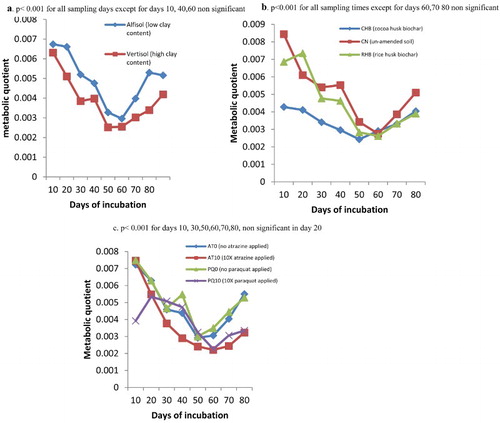
Soil samples amended with the CHB had the lowest metabolic quotient followed by the RHB and the CN or the un-amended soils that had high metabolic quotient values. Metabolic quotient decreased with all the treatments with time and low values were obtained for days 50 and 60 ((b)).
The lowest metabolic quotient was obtained for samples treated with atrazine at 10 times the recommended rate ((c)). No significant interaction was observed for all the parameters for the days sampled. Thus, no significant interaction was observed between the soil × biochar, soil × pesticide, biochar × pesticide and soil × pesticide × biochar.
Discussion
Ammonification and nitrification of soils amended and un-amended with biochar and contaminated with pesticides
Ammonification and nitrification were higher in the vertisol than the alfisol ((a) and (a)). The higher soil pH of the vertisol than the alfisol favoured nitrification more than the pH of 5.4 in the alfisol (). According to Paul and Clark (Citation1996) the optimum pH for nitrification was between 6.6 and 8.0 and nitrification markedly decreased below pH 6.0. Ammonification on the other hand is generally insensitive to pH and can be measured at significant rates over broad pH ranges (Dance et al. Citation1973). Amending the soils with biochar increased ammonification and nitrification (Anderson et al. Citation2011; Dempster et al. Citation2012). A similar observation was made in this study especially with the CHB amendments ((b) and (b)) that had liming effect because of the presence of liming materials such as KHCO3 and MgCO3 and small quantities of MgO. CHB with a pH of 10.4 may increase the pH of the acidic soil (alfisol) with a concurrent positive response of soil nitrifiers (Singh et al. Citation2010). However, the pH of the vertisol was slightly alkaline (7.6) and addition of biochar (CHB) even further enhanced ammonification and nitrification than in the alfisol.
Since pesticide application significantly influenced ammonification and nitrification especially when atrazine was applied at 10× the recommended rate ((c) and (c)), being an organic N compound, atrazine could be a source of carbon and energy for heterotrophs in the soil and the mineralization of atrazine would have supplied ammonium for the process of nitrification.
The vertisol had twice higher clay content of 47.5% as compared to the alfisol of clay content of 22.5% (). It is therefore likely that the bacterial population of the vertisol was higher than that in the alfisol (Girvan et al. Citation2003; Fang et al. Citation2007; Zhang et al. Citation2007; Mohammad Citation2015). Thus higher ammonifying and nitrifying populations might occur in the vertisol than in the alfisol and these contributed to the higher microbial activity observed in the vertisol than in the alfisol. Thus, the soil type, biochar effect and the pesticide effect tremendously increased ammonification and nitrification especially in the vertisol amended with CHB and atrazine being applied.
Ammonification and nitrification rates of soils amended with biochar and pesticides applied
Ammonification rate was depressed in the ammended soil when pesticide was applied in both the alfisol and the vertisol suggesting that certain members of the ammonifying community were susceptible to the pesticide addition and their numbers might have been affected ().
On the otherhand, the treatment where the alfisol was amended with CHB and no pesticide was applied, the rate of ammonification was negative and immobilization of N occurred (). Microbes in such amended soil lacked available N in the course of the incubation and had to utilize available N in the soil environment. One would have expected such immobilization to occur in soils amended with RHB of high C/N of 212.4 as compared to CHB of C/N ratio of 73.14, however, no form of immobilization of N was observed when soils were amended with RHB. Bruun et al. (Citation2012) and Zheng et al. (Citation2013) noted that biochar addition increased soil N immobilization. For this present study, immobilization of N was observed at the ammonification stage.
High ammonification and nitrification rates were recorded for RHB amended soils because the microbial activity associated with RHB amended soils was initially low but with incubation especially from day 50, microbial activity rose high thus contributing to high nitrification rates observed ().
Microbial biomass carbon in soils amended with biochar and pesticide applied
Microbial biomass carbon of both soils samples was low at the onset of incubation (1.292 and 0.255 μg C/g soil for both the vertisol and the alfisol) ((a)) but with time, increase in microbial biomass carbon was observed. At 80% moisture holding capacity of the soil and with incubation, the microbial biomass carbon increased with time. It was not surprising that microbial biomass carbon was higher in the vertisol than in the alfisol at all sampling times ((a)). Clay has been found to accommodate more OC, total N and P contents than silt and sand (Jones et al. Citation2006). The higher clay content of the vertisol had comparatively higher OC and available P contents that favoured microbial growth than in the alfisol (). Microbial biomass carbon was higher in soils amended with CHB as compared to the RHB amendment and the un-amended soil ((b)). This was because of the higher level of nutrient composition of total N, P and available phosphorus in the CHB as compared to the RHB ().
Significant interaction between soil and biochar especially with the vertisol and CHB ((d)), maintained very high microbial biomass carbon from day 20 to day 80 compared to all the other treatments. Possible explanation for this observation is that apart from the vertisol providing nutrients for microorganism, it also provided a place of refuge for the microbes, a protective habitat through pore size exclusion of predators (Elliot et al. Citation1980; Postma & Veen Citation1990; Zhang et al. Citation2007). The biochar also provided a place of refuge such that bacteria may sorb to biochar surfaces, rendering them less susceptible to leaching in soil (Pietikäinen et al. Citation2000). Bacterial abundance would likely increase in vertisol amended with CHB.
Luo et al. (Citation2013) reasoned that increased microbial biomass due to biochar amendments of soil was due to the direct stimulation by increased availability of C, N, and micronutrients released, a more favourable microenvironment provided by the charsphere, the decreased toxicity of Al and Mn and increased nutrient solubility due to the pH increase especially in low pH soil.
Significant interaction that occurred between the soil type and biochar ((d)) might mean that the mineral, i.e. the vertisol was attached to biochar during the stabilization process (Nguyen et al. Citation2008). In general, 2:1 minerals offer a bigger contact area for organic matter bonding and create stronger bonds with organic matter than the 1:1 minerals (Kleber et al. Citation2015).
Basal respiration and carbon mineralization of soils amended with biochar and pesticides applied
Higher basal respiration was recorded in the vertisol than in the alfisol suggesting higher microbial activity in the vertisol than the alfisol ((a)).
Soil basal respiration is the steady rate of respiration in soil, which originates from the mineralization of organic matter (Pell et al. Citation2006), and is estimated either on the basis of CO2 evolution or O2 uptake (Dilly & Zyakun Citation2008).
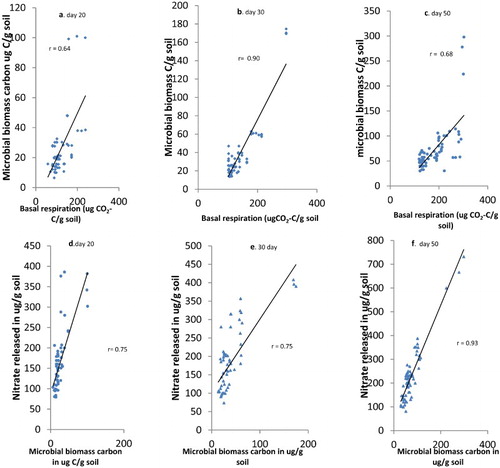
Significant correlation existed between the basal respiration and microbial biomass carbon with r of 0.64, 0.90 and 0.68, for days 20, 30 and 50 of incubation implying that basal respiration accounted for more than half of the biomass of microorganisms in the soil and that of day 30 was most significant (). Other factors contributed to the increases in microbial biomass carbon and that might have come from the type of biochar used, soil organic matter, etc. Similarly, nitrification was correlated with the microbial biomass carbon such that correlation coefficients were 0.75, 0.75 and 0.93 especially for days 20, 30 and 50 (). Thus with increase in the microbial biomass carbon, the microbial activity was also increased.
Figure 8. (a–c) Correlation between micobial biomass carbon and basal respiration at days 20, 30 and 50. (d–f) Correlation between microbial biomass carbon and nitrate released at days 20, 30 and 50 days of incubating soils with different biochar amendments and polluted with pesticides. r is the correlation coefficient.
Of the two pesticides, atrazine applied at 10 times the recommended rate significantly increased the microbial activity more than paraquat at 10 times the recommended rate ((c,d)). Paraquat has binding effect on soil organic matter, thus the paraquat available for the microbes to degrade reduces in soil solution (Bollag & Liu Citation1990). Being cationic in nature, paraquat can directly bind with bacterial cell wall in the soil since the outer membrane of some bacteria is negatively charged. This adsorption may have deleterious effect on the microbe thus inhibiting the growth and preventing the microbe from effectively degrading the pesticide. Generally the microbial biomass carbon of soil contaminated with paraquat was lower than ((c)) that contaminated with atrazine. Paraquat might have killed some of the susceptible microorganisms in soil. Paraquat is immobilized on clay soil fractions shortly after application (Tucker et al. Citation1967) and this renders the herbicide unavailable for microbial degradative attack.
The steep ascendency for the treatment VCHBAt ((d)), i.e. the treatment where vertisol was amended with CHB and polluted with atrazine at 10 times the normal recommended rate suggests that had the incubation period prolonged beyond 90 days, more CO2 would have evolved. The curve had not plateaued suggesting the presence of more labile substances in that treatment. The un-amended vertisol had a carbon mineralization rate of 16.661 μg/g soil/day and when amended with CHB, the carbon mineralization rate increased to 19.652 μg/g soil/day suggesting that CHB had priming effect on the carbon mineralization process in the vertisol (). Carbon mineralization rate almost doubled to 34.44 μg/g soil/day when the vertisol that had been amended with CHB (mineralization rate was 19.652 μg/g soil/day) and atrazine at 10 times the recommended rate was added implying that atrazine was also a labile carbon source that further primed the carbon mineralization process. Such priming effect was also observed by Hamer et al. (Citation2004) and Hamer and Marschner (Citation2005).
Metabolic quotient of soils amended with biochar and pesticides applied
The values obtained for the metabolic quotient in this study were similar to the ones obtained in the literature (). For instance, Wardle and Ghani (Citation1995) had values ranging from 0.0012 (unit less) in undisturbed soil samples to 0.0061 (unit less) in the disturbed soil samples. Domene et al. (Citation2014) had qCO2 values ranging from 0.001 to 0.004. Lower metabolic quotient in the vertisol than in the alfisol ((a)) suggests that the type of soil used had an effect on the metabolic quotient value and that the microbes had a better chance of survival in the vertisol than in the alfisol even in times of pesticidal stress. Lowest metabolic quotient was obtained in days 50 and 60 reflecting very high microbial biomass carbon being obtained for the treatments whilst the corresponding basal respiration was not high. This also shows that the metabolic quotient value varies with time and that it is not a stationery value.
The type of biochar used also had an influence on the metabolic quotient. Almost throughout the experimental period, low qCO2 values were recorded for CHB as compared to the RHB and the un-amended soil ((b)). Even though many feedstocks can be used for the preparation of biochar, one should be mindful of the effect of that biochar on the microbial community. Soils amended with biochar, in general, had lower qCO2 than the un-amended soils thus biochar especially CHB helped microbes to maintain lower metabolic quotient status so that large part of their energy budget was not used for maintenance but for cell synthesis and were able to better utilize substrate for cell growth (Perucci et al. Citation2000) even in the presence of pollutants in the soil. The generally very low qCO2 when the pesticide atrazine at 10 times the recommended rate (AT10) ((c)) was applied to soil further suggests that atrazine encouraged the microbial growth and microbes survived better in that environment.
Acknowledgements
We thank the German Federal Ministry of Education and Research (BMBF) for fundng of this research of the Urban Food Plus Project under the GlobE-initiative (FKZ:031A242-A,B). We also thank Professors Kwadwo Ofori and Mark Abekoe of the Departments of Crop Science and Soil Science, University of Ghana, Legon, who contributed in the shapening of this manuscript.
Disclosure statement
No potential conflict of interest was reported by the authors.
Notes on contributors
Ama Tanoa Sam obtained her B.Sc. degree (Honours) in Agriculture from the University of Ghana, Legon, and also a Master of Philosophy degree in Soil Science from the University of Ghana. Her interest centers on the use of biochar and other soil amendments to improve the soil fertility.
S. Asuming-Brempong is a Senior Research Fellow in the Department of Soil Science, School of Agriculture, University of Ghana, Legon. She holds a B.Sc. degree (Honours) in Agriculture from the University of Ghana, a Master of Science degree majoring in Soil Science and minoring in Agronomy from the University of the Philippines, Los Banos, Philippines, and a Doctor of Philosophy degree in Soil Microbiology from Michigan State University, East Lansing, USA. She lectures in Soil Biochemistry, Soil Microbiology and Soil Biotechnology in the University of Ghana. Her research interests have been analyzing microbial community of soils amended with biochar and other organic substrates using molecular methods and relating that to soil fertility.
E. K. Nartey is a Senior Lecturer in the Department of Soil Science, School of Agriculture, University of Ghana, Legon. He holds a B.Sc. degree Honours in Agriculture and Diploma in Education from the University of Cape-Coast, a Master of Philosophy in Soil Science from the University of Ghana and a Doctor of Philosophy in Soil Science from the United Graduate School, Ehime University, Japan. He is a lecturer in Soil Chemistry and Fertility, Soil Research Methodology and Instrumentation. His research interests have been in the use of natural adsorbents for removal of pollutants from soil and waste water. He is also into organic matter dynamics in soil, landscape processes and land use systems and organic residue management in tropical agriculture. He has supervised and co-supervised about 12 graduate students at the Master of Science level and four Doctor of Philosophy students. Eric Kwesi Nartey has 27 published articles in refereed journals, 1 book chapter and 14 technical reports.
References
- Anderson CR, Condron LM, Clough TJ, Fiers M, Stewart A, Hill RA, Sherlock RR. 2011. Biochar induced soil microbial community change: implications for biogeochemical cycling of carbon, nitrogen and phosphorus. Pedobiologia. 54:309–320. doi: 10.1016/j.pedobi.2011.07.005
- Anderson JM, Ingram JSI, editors. 1993. Tropical soil biology and fertility: a handbook of methods. 2nd ed. Wallingford: CAB International. 238 pp.
- Anderson TH, Domsch KH. 1990. Application of eco-physiological quotients (qCO2 and qD) on microbial biomass from soils of different cropping histories. Soil Biol Biochem. 22:251–255. doi: 10.1016/0038-0717(90)90094-G
- Atkinson CJ, Fitzgerald JD, Hipps NA. 2010. Potential mechanisms for achieving agricultural benefits from biochar application to temperature soils: a review. Plant Soil. 337:1–18. doi: 10.1007/s11104-010-0464-5
- Ball PN, MacKenzie MD, DeLuca TH, Holben WE. 2010. Wildfire and charcoal enhance nitrification and ammonium-oxidizing bacteria abundance in dry montane forest soils. J Environ Qual. 39:1243–1253. doi: 10.2134/jeq2009.0082
- Berglund L, DeLuca T, Zackrisson O. 2004. Activated carbon amendments to soil alters nitrification rates in Scots pine forests. Soil Biol Biochem. 36:2067–2073. doi: 10.1016/j.soilbio.2004.06.005
- Blake GR, Hartge KH. 1965. Bulk density. In: Klute A, editor. Methods of soil analysis, part 1 – physical and mineralogical methods. 2nd ed. Agronomy Monograph 9. Madison, WI: American Society of Agronomy – Soil Science Society of America; p. 363–382.
- Bollag JM, Liu SY. 1990. Biological transformation processes of pesticides. In: Cheng HH, editor. Pesticides in the soil environment: processes, impacts and modelling. Madison, WI: SSSA; p. 169–211.
- Bray RH, Kurtz LT. 1945. Determination of total organic and available forms of phosphorus in soils. Soil Sci. 59:39–46. doi: 10.1097/00010694-194501000-00006
- Bremner JM. 1965. Total nitrogen. In: Black C, editor. Methods of soil analysis, part 2. Monograph No. 9. Madison, WI: America Society of Agronomy; p. 1149–1178.
- Bruun EW, Ambus P, Egsgaard H, Hauggaard-Nielsen H. 2012. Effects of slow and fast pyrolysis biochar on soil C and N turnover dynamics. Soil Biol Biochem. 46:73–79. doi: 10.1016/j.soilbio.2011.11.019
- Dance W, Peterson A, Chester G. 1973. Ammonification and nitrification of N as influenced by soil pH and previous N treatments. Soil Sci Soc Am J. 37:67–69. doi: 10.2136/sssaj1973.03615995003700010024x
- Day PR. 1965. Particle and particle size analysis. In: Black CA, editor. Methods of soil analysis, part I. Madison, WI: Agronomy; p. 545–567.
- Deenik JL, McClellan T, Uehara G, Antal NJ, Campbell S. 2010. Charcoal volatile matter content influences plant growth and soil nitrogen transformations. Soil Sci Soc Am J. 74:1259–1270. doi: 10.2136/sssaj2009.0115
- DeLuca T, Nilsson MC, Zackrisson O. 2002. Nitrogen mineralization and phenol accumulation along a fire chronosequence in northern Sweden. Oecologia. 133:206–214. doi: 10.1007/s00442-002-1025-2
- Dempster DN, Jones DL, Murphy DV. 2012. Organic nitrogen mineralization in two contrasting agro-ecosystems is unchanged by biochar addition. Soil Biol Biochem. 48:47–50. doi: 10.1016/j.soilbio.2012.01.013
- Dilly O, Zyakun A. 2008. Priming effect and respiratory quotient in a forest soil amended with glucose. Geomicrobiol J. 25:425–431. doi: 10.1080/01490450802403099
- Domene X, Mattam S, Hanley K, Enders A, Lehmann J. 2014. Medium-term effects of corn biochar addition on soil biota activities and functions in a temperate soil cropped to corn. Soil Biol Biochem. 72:152–162. doi: 10.1016/j.soilbio.2014.01.035
- Elliot ET, Anderson RV, Coleman DC, Cole CV. 1980. Habitable pore space and microbial trophic interactions. Oikos. 35:327–335. doi: 10.2307/3544648
- Fang M, Motavalli P, Kremer R, Nelson K. 2007. Assessing changes in soil microbial communities and carbon mineralization in Bt and non-Bt corn residue-amended soils. Appl Soil Ecol. 37(1–2):150–160. doi: 10.1016/j.apsoil.2007.06.001
- Girvan MS, Bullimore J, Pretty JN, Osborn AM, Ball AS. 2003. Soil type is the primary determinant of the composition of the total and active bacterial communities in arable soils. Appl Environ Microbiol. 69(3):1800–1809. doi: 10.1128/AEM.69.3.1800-1809.2003
- Gundale MJ, DeLuca TH. 2006. Temperature and substrate influence the chemical properties of charcoal in the ponderosa pine/douglas-fir ecosystem. For Ecol Manag. 231:86–93. doi: 10.1016/j.foreco.2006.05.004
- Haefele SM, Knoblauch C, Gummert M, Konboon Y, Koyama S. 2009. Black carbon (biochar) in rice-based systems: characteristics and opportunities. In: Woods WI, Teixeira WG, Lehmann J, Steiner C, WinklerPrins AMGA, Rebellato L, editors. Amazonian dark earths: Wim Sombroek’s vision. Berlin: Springer; p. 445–463.
- Hamer U, Marschner B. 2005. Priming effects in soils after combined and repeated substrate additions. Geoderma. 128:38–51. doi: 10.1016/j.geoderma.2004.12.014
- Hamer U, Marschner B, Brodowski S, Amelung W. 2004. Interactive priming of black carbon and glucose mineralization. Org Geochem. 35:823–830. doi: 10.1016/j.orggeochem.2004.03.003
- Hutchinson GL, Mosier AR. 1981. Improved soil cover method for field measurement of nitrous oxide fluxes. Soil Sci Soc Am J. 45:311–316. doi: 10.2136/sssaj1981.03615995004500020017x
- Ippolito JA, Laird DA, Busscher WJ. 2012. Environmental benefits of biochar. J Environ Qual. 41:967–972. doi: 10.2134/jeq2012.0151
- Jones JW, Koo J, Naab JB, Bostick WM, Traore S, Graham T. 2006. Integrating stochastic models and in situ sampling for monitoring soil carbon sequestration. Agric Syst. 94:52–62. doi: 10.1016/j.agsy.2005.06.023
- Kimetu JM, Lehmann J. 2010. Stability and stabilization of biochar and green manure in soil with different organic carbon contents. Aust J Soil Res. 48:577–585. doi: 10.1071/SR10036
- Kleber M, Eusterhues K, Keiluweit M, Mikutta C, Mikutta R, Nico PS. 2015. Mineral–organic associations: formation, properties, and relevance in soil environments. Adv Agron. 130:1–140. doi: 10.1016/bs.agron.2014.10.005
- Kuzyakov Y, Subbotina I, Chen H, Bogomolova I, Xu X. 2009. Black carbon decomposition and incorporation into microbial biomass estimated by 14C labeling. Soil Biol Biochem. 41:210–219. doi: 10.1016/j.soilbio.2008.10.016
- Ladd JN, Amato M. 1989. Relationship between microbial biomass carbon in soils and absorbance of extracts of fumigated soils. Soil Biol Biochem. 21:457–459. doi: 10.1016/0038-0717(89)90160-0
- Lehmann J, da Silva Jr JP, Steiner C, Nehls T, Zech W, Glaser B. 2003. Nutrient availability and leaching in an archaeological anthrosol and a ferralsol of the central Amazon basin: fertilizer, manure and charcoal amendments. Plant Soil. 249:343–357. doi: 10.1023/A:1022833116184
- Lehmann J, Joseph S. 2009. Biochar for environmental management: an introduction. In: Lehmann J, Joseph S, editors. Biochar for environmental management, science and technology. London: Earthscan; p. 1–12.
- Liang B, Lehmann J, Solomon D, Kinyangi J, Grossman J, O’Neill B, Skjemstad JO, Thies J, Luizão FJ, Petersen J, Neves EG. 2006. Black carbon increases cation exchange capacity in soils. Soil Sci Soc Am J. 70:1719–1730. doi: 10.2136/sssaj2005.0383
- Liang BQ, Lehmann J, Sohi SP, Thies JE, O’Neill B, Trujillo L, Gaunt J, Solomon D, Grossman J, Neves EG, Luizao FJ. 2010. Black carbon affects the cycling of nonblack carbon in soil. Org Geochem. 41:206–213. doi: 10.1016/j.orggeochem.2009.09.007
- Luo Y, Durenkamp M, De Nobili M, Lin Q, Devonshire BJ, Brookes PC. 2013. Microbial biomass growth, following incorporation of biochars produced at 350°C or 700°C, in a silty-clay loam soil of high and low pH. Soil Biol Biochem. 57:513–523. doi: 10.1016/j.soilbio.2012.10.033
- MacKenzie MD, DeLuca TH. 2006. Charcoal and shrubs modify soil processes in ponderosa pine forests of western Montana. Plant Soil. 287:257–266. doi: 10.1007/s11104-006-9074-7
- Mašek O, Budarin V, Gronnow M, Crombie K, Brownsort P, Fitzpatrick E, Hurst P. 2013. Microwave and slow pyrolysis biochar – comparison of physical and functional properties. J Anal Appl Pyrol. 100:41–48. doi: 10.1016/j.jaap.2012.11.015
- Mizuta K, Matsumoto T, Hatate Y, Nishiihara K, Nakanishi. 2004. Removal of nitrate-nitrogen from drinking water using bamboo powder charcoal. Bioresour Technol. 95: 255–257. doi: 10.1016/j.biortech.2004.02.015
- Mohammad AO. 2015. Assessing changes in soil microbial populations with some soil physical and chemical properties. Int J Plant Animal Environ Sci. 5(3):117–123.
- Murage EW, Voroney P, Beyaert RP. 2007. Turnover of carbon in the free light fraction with and without charcoal as determined using the 13C natural abundance method. Geoderma. 138:133–143. doi: 10.1016/j.geoderma.2006.11.002
- Murphy J, Riley JP. 1962. A modified method single solution for determination of phosphate in natural water. Acta J Anal Chem. 27:31–36. doi: 10.1016/S0003-2670(00)88444-5
- Nelissen V, Rutting T, Huygens D, Staelens J, Ruysschaert G, Boeckx P. 2012. Maize biochars accelerate short-term soil nitrogen dynamics in a loamy sand soil. Soil Biol Biochem. 55:20–27. doi:10.1016/j.soilbio.2012.05.019
- Nguyen B, Lehmann J, Kinyangi J, Smernik R, Riha SJ, Engelhard MH. 2008. Long-term black carbon dynamics in cultivated soil. Biogeochemistry. 89:295–308. doi: 10.1007/s10533-008-9220-9
- Olsen SR, Cole CV, Watanabe FS, Dean LA. 1954. Estimation of available phosphorus in soils by extraction with sodium bicarbonate. U.S.Department of Agriculture Circular 939.
- Paul EA, Clark FE. 1996. Soil microbiology and biochemistry. 2nd ed. San Diego (CA): Academic Press. 340 pp.
- Pell M, Stenström J, Granhall U. 2006. Soil respiration. In: Bloem J, Hopkins DW, Benedetti A, editors. Microbial methods for assessing soil quality. Wallingford: CABInternational; p. 114–126.
- Perucci P, Dumontet S, Bufo SA, Mazzatura A, Casucci C. 2000. Effects of organic amendment and herbicide treatment on soil microbial biomass. Biol Fertil Soils. 32:17–23. doi: 10.1007/s003740000207
- Pietikäinen J, Kiikkilä O, Fritze H. 2000. Charcoal as a habitat for microbes and its effects on the microbial community of the underlying humus. Oikos. 89:231–242. doi: 10.1034/j.1600-0706.2000.890203.x
- Postma J, Veen JA. 1990. Habitable pore space and survival of Rhizobium leguminosarum biovar trifolii introduced into soil. Microbial Ecol. 19(2):149–161. doi: 10.1007/BF02012096
- Singh B, Singh BP, Cowie AL. 2010. Characterisation and evaluation of biochars for their application as a soil amendment. Aust J Soil Res. 48:516–525. doi: 10.1071/SR10058
- Sparling GP, Feltham CW, Reynolds J, West AW, Singleton P. 1990. Estimation of soil microbial carbon by fumigation – extraction method: use on soils of high organic matter content, and a reassessment of the kEC-factors. Soil Biol Biochem. 22:301–307. doi: 10.1016/0038-0717(90)90104-8
- Sparling GP, West AW. 1998. A direct extraction method to estimate soil microbial carbon: calibration in situ using microbial respiration and 14C-labelled cells. Soil Biol Biochem. 20:337–343. doi: 10.1016/0038-0717(88)90014-4
- Spokas KA, Koskinen WC, Baker JM, Reicosky DC. 2009. Impacts of woodchip biochar additions on greenhouse gas production and sorption/degradation of two herbicides in a Minnesota soil. Chemosphere. 77:574–581. doi: 10.1016/j.chemosphere.2009.06.053
- Steinbeiss S, Gleixner G, Antonietti M. 2009. Effect of biochar amendment on soil carbon balance and soil microbial activity. Soil Biol Biochem. 41:1301–1310. doi: 10.1016/j.soilbio.2009.03.016
- Steiner C, Garcia M, Zech W. 2009. Effects of charcoal as slow release nutrient carrier on NPK dynamics and soil microbial population: pot experiments with ferralsol substrate. In: Woods WI, Teixeira WG, Lehmann J, Steiner C, WinklerPrins AMGA, Rebellato L, editors. Amazonian dark earths: Wim Sombroek’s vision. Berlin: Springer; p. 325–338.
- Sullivan BW, Dore S, Kolb TE, Hart SC, Montes-Helu C. 2010. Evaluation of methods for estimating carbon dioxide efflux across a gradient of forest disturbance. Global Clim Biol. 16:2449–2460.
- Tucker BV, Pack DE, Ospenson JN. 1967. Adsorption of bipyridylium herbicides in soil. J Agric Food Chem. 15:1005–1008. doi: 10.1021/jf60154a017
- Van Zwieten L, Kimber S, Morris S, Downie A, Berger E, Rust J, Scheer C. 2010. Influence of biochars on flux of N2O and CO2 from ferrosol. Aust J Soil Res. 48:555–568. doi: 10.1071/SR10004
- Walkley A, Black IA. 1934. An examination of the degtjareff method for determining soil organic matter, and proposed modification of the chromic acid titration method. Soil Sci. 37:29–38. doi: 10.1097/00010694-193401000-00003
- Wardle DA, Ghani A. 1995. A critique of the microbial metabolic quotient (qCO2) as a bioindicator of disturbance and ecosystem development. Soil Biol Biochem. 27:1601–1610. doi: 10.1016/0038-0717(95)00093-T
- Warnock DD, Mummey DL, McBride B, Major J, Lehmann J, Rillig MC. 2010. Influences of non-herbaceous biochar on arbuscular mycorrhizal fungal abundances in roots and soils: results from growth-chamber and field experiments. Appl Soil Ecol. 46:450–456. doi: 10.1016/j.apsoil.2010.09.002
- Winsley P. 2007. Biochar and bioenergy production for climate change mitigation. N Z Sci Rev. 64:5–10.
- Yao Y, Gao B, Zhing M, Inyang M, Zimmerman AB. 2012. Effect of biochar amendment on sorption and leaching of nitrate, ammonium and phosphate in a sandy soil. Chemosphere. 89:1467–1471. doi: 10.1016/j.chemosphere.2012.06.002
- Zackrisson O, Nilsson MC, Wardle DA. 1996. Key ecological function of charcoal from wildfire in the boreal forest. Oikos. 77:10–19. doi: 10.2307/3545580
- Zhang P, Zheng J, Pan G, Zhang X, Li L, Rolf T. 2007. Changes in microbial community structure and function within particle size fractions of a paddy soil under different long-term fertilization treatments from the Tai lake region, China. Colloids Surf B: Biointerfaces. 58(2):264–270. doi: 10.1016/j.colsurfb.2007.03.018
- Zheng H, Wang Z, Deng X, Herbert S, Xing BS. 2013. Impacts of adding biochar on nitrogen retention and bioavailability in agricultural soil. Geoderma. 206:32–39. doi: 10.1016/j.geoderma.2013.04.018