
ABSTRACT
Liming before cultivation of sugar beets is favourable even on alkaline soils but knowledge of response in other crops is lacking. Therefore, effects of ground limestone (GL) and structure lime (SL1 slaked lime or SL2 mix of ground limestone and slaked lime) were evaluated in southern Sweden on soil structure, growth and nutrient concentration in barley under four fertilisation strategies 1.5–2 years after application. All lime products increased aggregate stability, but with variations between locations. A lower proportion of large aggregates was found in both limed treatments, and a higher proportion of small aggregates in SL. In barley, grain yield was unaffected while shoot numbers and biomass in first node stage increased for GL and biomass increased further for SL. Structure lime increased potassium concentration in plants in first node stage, due to more potassium in the product. Both lime types increased molybdenum concentration. Ground limestone reduced zinc concentration compared with no liming. Finer seedbed tilth and increased aggregate stability may explain increased biomass for GL. Higher potassium content in SL might be a further explanation. No interactions between liming and fertilisation were found. In conclusion, on the soil types studied, no change of fertilisation strategy is needed due to liming.
Introduction
Liming can have effects on both soil and crops in terms of soil structure, plant nutrition and plant pathology (literature review by Holland et al. Citation2018). Olsson et al. (Citation2019) showed that liming soils with a clay content >20% with ground limestone before a sugar beet crop gave greater yield increases on soils with already elevated pH(H2O) (>7.0) than on soils with lower pH. Suggested explanations for the positive response were improved aggregate size distribution in the seedbed, as shown previously by Ledin (Citation1981), less slaking and crusting under unfavourable weather conditions (Stenberg et al. Citation2000) or reduced infection with Aphanomyces (Olsson et al. Citation2011). In the period 2010–2021, approximately 65,000 hectares of clay soils in Sweden were limed with blends of ground limestone (calcium carbonate, CaCO3) and slaked lime (calcium hydroxide, Ca(OH)2) referred to as ‘structure lime’. The aim with this type of liming is primarily to increase aggregate stability and thereby reduce phosphorus (P) losses (Ulén and Etana Citation2014; Blomquist et al. Citation2018).
It is well known that the availability of boron (B), copper (Cu), iron (Fe), manganese (Mn), P and zinc (Zn) decreases with increasing pH, while the availability of molybdenum (Mo) increases. Therefore, addition of micronutrients must be taken into consideration when evaluating yield response of liming. Since placement of acidifying fertilisers can improve uptake of both the applied nutrients as well as soil micronutrients such as Mn (Holmes et al. Citation1983; Nkebiwe et al. Citation2016), placement may be enough to avoid shortage of nutrients after liming.
The aim of this investigation was to evaluate: (i) the combined effects of liming with ground limestone or structure lime (slaked lime alone or mixed with ground limestone) on soil structure and plant nutrition in spring barley; and (ii) the interactive effect of fertilisation strategy and liming on growth and plant nutrition. In Sweden, ground limestone is used in practical agriculture to raise pH and structure lime is primarily used to increase aggregate stability. Therefore, the comparison between those products is relevant.
The starting hypotheses were that: (1) structure lime improves soil structure more than ground limestone; and (2) there are interactive effects on growth and nutrient concentration in spring barley between liming treatment and fertilisation strategy, with the most positive response of liming obtained with NPK fertiliser placement combined with foliar fertilisation with micronutrients.
Materials and methods
Experimental design
Field experiments were established in Scania County, southern Sweden (humid continental climate; EAA Citation2019), at two different locations in 2013, five in 2014 and six in 2015. The experiments were set up in farmers’ fields and each started in the autumn before the spring when sugar beet was established. General soil characteristics at the different locations are presented in . Ground limestone (GL) or structure lime (SL) was applied and compared with an untreated control (L0) in a randomised block design with three replicates, in plots with width 12 m or 24 m and length ranging from 100 m to 800 m, depending on field size. Two different products were used as SL, in 2013 slaked lime (SL1) and in 2014–2015 the mixed product Nordkalk Aktiv Struktur (SL2) (). Application rates to increase pH depend on initial pH, crop rotation, soil texture and soil organic matter, whereas standard application rate in Sweden for structure liming is approximately 8 t ha−1 of SL2. The application rate in the experiment was ∼4 t CaO ha−1, expressed by the neutralising value (CEN-EN 12945:2008/AC:EN:2009). For GL (particle size 0–0.2 mm) this corresponded to 8 t ha−1, for structure liming (SL) it corresponded to 5.6 t ha−1 in the two locations where SL1 was used and 7.8 t ha−1 in the 11 locations where SL2 (particle size 0–0.5 mm) was used.
Table 1. Locations, year of liming and of the spring barley crop, soil pH, available nutrients (mg (100 g)–1 air-dried soil), organic matter and texture prior to liming and application of NPK (kg ha−1) to barley.
Table 2. Lime treatments in main plots and fertilisation strategies in barley (sub-plots)a.
Table 3. Summary of products used in the ground limestone (GL) and structure lime (SL) treatments.
Table 4. Content of nutrients in the ground limestone (GL) and structure lime (SL) treatments. NA refers to not analysed.
Spring barley was grown after sugar beet or potato in the crop rotation (), and extensive studies were conducted at 10 field locations () on the effects of lime on barley nutrition and yield. In these studies, the main plots with the three different lime treatments (L0, GL, SL) were divided into sub-plots that were allocated to four different fertilisation strategies (). These comprised three treatments with subsurface placement of the fertiliser: NS 27-4 (strategy NS-Pl); NPKS 24-4-5-3 (strategy NPKS-Pl); or NPKS 24-4-5-3 plus foliar fertiliser in growth stage 12, 31 and 37 according to Zadoks’ scale (ZS) (Zadoks et al. Citation1974) (strategy NPKSm-Pl); and a fourth treatment with broadcast NPKS fertiliser (strategy NPKS-Bc). At one location (Västraby), NPKS 22-6-6-3 was used instead of NPKS 24-4-5-3 due to low content of available P in soil and lower total-N fertiliser requirement than at the other locations. Magnesium supply was approximately the same for all solid fertilisers, 0.02–0.03 kg kg−1 N. Sulphur supply only differed by 2 kg S ha−1 between the NS 27-4 and NPKS fertilisation strategies. A foliar fertiliser (YaraVita® Gramitrel®, containing (g L−1) 64 N, 150 Mg, 50 Cu as Cu2O, 150 Mn (as MnCO3) and 80 Zn (as ZnO)), was used in treatment NPKSm-Pl, with 1 L ha−1 supplied in daytime on each application. The N level was adapted to the farmer’s routines and practice concerning single or split dose. As a mean, 103 kg N ha−1 were applied at drilling and 123 kg N ha−1 in total. Extra Mn was supplied as foliar fertiliser over the whole field in all locations according to the farmer’s routines. (For further details see .)
Table 5. Crops grown during the experimental period.
Aggregate stability and aggregate size distribution
Sampling of soil for aggregate stability measurement was carried out in sub-plot NS-Pl in all main plots (lime treatments) in the second year after liming. At 12 of the 13 locations, sampling was carried out in the seedbed in spring (in nine cases in barley and in three cases in potatoes) (). In the 13th trial, sampling was conducted in August 2016, immediately after drilling of winter oilseed rape. At all 13 locations, soil sampling was performed after tillage and the loose soil obtained was sieved over three different mesh size classes (average diameter >5 mm, 2–5 mm and <2 mm) as described by Kritz (Citation1983). The fraction with 2–5 mm diameter aggregates was collected and stored dry and aerated before measurement of turbidity. For this, the aggregates were air-dried at 40 oC and then subjected to simulated rain at an intensity of 32–39 mm per hour in the laboratory. Leachate from the samples was collected on two occasions 24 hours apart (denoted A1 and A2, respectively) and turbidity and electrical conductivity (EC) in the leachate were determined after each simulated rainfall event. For this, the muddy leachate water was agitated in a shaker for 10 minutes and then allowed to sediment for 4.5 hours. After sedimentation, a fluid sample was taken at 5.6 cm depth and turbidity was measured with a turbidimeter (Hach TL 2360 Turbidimeter, Hach, Loveland, Co.). The turbidity in the water sample was taken as an estimate of clay concentration (aggregate stability) in the water, and thus as an indication of the risk of particulate-P losses. Electrical conductivity increases at liming, and the measured values were used to check that the lime had been spread in the correct plots. Only turbidity and EC data from the second simulated rainfall event (turbidity-A2 and EC-A2) are reported here.
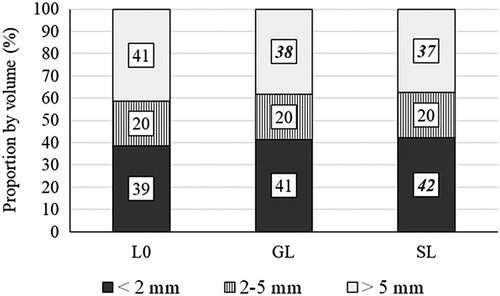
Sampling of soil for aggregate size distribution was performed in seven of the 13 experiments, six with spring barley and one with potatoes. The seedbed or top of the potato ridges were sampled directly after drilling/planting in spring 2016 and 2017, in the second crop in the rotation after liming. The seedbed/ridge material was sieved into the same three fractions as described above (average diameter >5 mm, 2–5 mm and <2 mm) and the volume of the three fractions was measured.
Soil and plant analyses
Soil sampling (0–20 cm) for chemical analyses was carried out in the main plots before drilling of barley. The samples were analysed for pH(H2O), plant-available aluminium (Al), calcium (Ca), Fe, K, Mg, P by the ammonium acetate-lactate (AL) method (Egnér et al. Citation1960); Fe, Mn, Zn and Cu with CAT extraction (0.01 M CaCl2 + 0.002 M DTPA solution; CEN EN 13651:2001), B with hot water extraction (15 minutes) and also P with the P-Olsen-method (Olsen et al. Citation1954). Thereafter, observations relating to growth and yield were made in all plots, i.e. in each sub-plot. Plant shoots were counted in ZS30-31. Total aboveground biomass was sampled in ZS31 and biomass concentration of P, K, Ca, Mg, S, Mn, B, Zn, Cu and Fe was analysed by inductively coupled plasma-optical emission spectroscopy (Agilent ICP OES 5110), after digestion with nitric acid using a CEM MARS 6 microwave. Nitrogen content was determined according to Dumas, on a LECO TRUMAC device (LECO Corporation, St. Joseph, MI, USA). Optimal plant nutrient concentration as established by Bergmann (Citation1992) has lower and higher adequate levels, and nutrient levels in plants should be in the middle or upper part of the adequate range. Nitrogen uptake in ZS31, corresponding to kg N ha−1, was calculated as ‘SN value’, based on optimised vegetation index derived from canopy reflectance measured off-nadir (60 degree) using a HandySpec MMS1 NIR-enhanced handheld passive spectrometer from tec5 (tec5 Inc., Oberursel, Germany). Background for the calculations is described in Gnyp et al. (Citation2015).
Calculations and statistics
Analysis of variance (ANOVA) was conducted on the data from the 10 barley trials using a split-plot-model in PROC MIXED model in SAS 9.3; (SAS Institute Inc.) comprising fixed effects of location, lime and fertilisation strategy and with block as random effects. Interactions were tested between lime x fertilisation strategy, between lime x location, and between lime x fertilisation strategy x location. Tukey’s test was used for pairwise comparisons. Differences between treatment means were evaluated with Tukey’s Honestly Significant Differences (HSD) test at p < 0.05.
Each individual experiment was also analysed in SAS in a two-way model. For individual experiment Fisher’s LSD was then used for pairwise comparisons.
Structure measurements were compared by Mintab 18 in one-way Anova and with differences between the treatment means evaluated with Tukey’s HSD test at p < 0.05.
Differences referred to are significant unless otherwise stated, while p-values between 0.05 and 0.1 were taken to indicate tendencies.
Results
Aggregate stability
Electrical conductivity increased by 31% (p < 0.001) after irrigation in the two limed treatments (GL, SL) compared with the control (L0) as an average for the 13 locations (Supplementary Table S1). There was no interaction between location and treatment (p = 0.129). Aggregate stability also increased with liming (p < 0.001), with turbidity-A2 decreasing on average by 43% and 35% in treatments GL and SL, respectively, in comparison with the control (Supplementary Table S1). There was no difference in turbidity-A2 between the limed treatments GL and SL. The reduction in turbidity varied widely between the 13 locations (, Supplementary Table S2). Statistical analysis showed an interaction between location and lime treatment (p = 0.049) for all locations (Supplementary Table S1). At Västraby (, Supplementary Table S2), the reduction in turbidity after liming was significant and at Hörte-13, Lindby, Heddinge and Billeberga the reduction was close to significant, i.e. there was a tendency for a treatment effect. The remaining eight locations showed no reductions in turbidity-A2.
Figure 1. Aggregate stability (approximated as turbidity) at the different experimental locations (n = 13). Year refers to year for aggregate sampling. P-values are for lime treatments in a one-way Anova. Turbidity (absolute values on bottom line) was measured in fertilisation strategy NS-Pl (see ). Grey bars refer to ground limestone (GL) and black bars to structure lime (SL). Red dotted line shows unlimed control treatment L0 = 100.
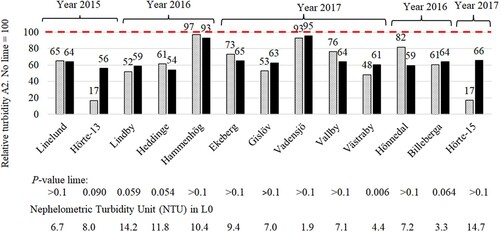
Treatment SL involved application of pure slaked lime in autumn 2013 at two locations (treatment SL1, ) and the mixed product Nordkalk Aktiv Struktur in autumns 2014–2015 at 11 locations (treatment SL2, ). For both groups (SL1 and SL2) of locations, all liming treatments had higher EC-A2 than the control (Supplementary Table S1). Turbidity-A2 was lower in treatments GL and SL2 than in L0 (p < 0.001), with no differences between the two limed treatments. However, there was an interaction between location and treatment (p = 0.025) for group SL2 locations (Supplementary Table S1). In the other group of locations, turbidity decreased only in treatment GL and not in SL1 compared with the control (p = 0.049) and there was no interaction between location and treatment (p = 0.381).
Aggregate size distribution
The tilled top 4–5 cm of the seedbed/potato ridge showed a finer tilth in the limed treatments GL and SL compared with the control (). Both limed treatments had a lower proportion of coarse aggregates (>5 mm) compared with the control (p = 0.006). For the middle-sized fraction (2–5 mm) there were no differences between the main treatments (p = 0.657), but for the aggregate size class with the finest average diameter (<2 mm), treatment SL showed a higher proportion than the control (p = 0.011), but no difference in comparison with the other limed treatment GL (bottom part of bars in ). There were no interactions between location and treatment for any of the three aggregate size classes, i.e. all locations reacted similarly to the lime treatments.
Figure 2. Aggregate size distribution in the seedbed in six locations with spring barley and in the top of the ridge in one location with potatoes in 2016-2017. Significant differences in aggregate size classes compared with the untreated control (L0) are indicated in bold and italics. GL = ground limestone, SL = structure lime.
Soil chemical composition before drilling in the barley experiments
Either one or both liming treatments affected pH, AL-extracted Ca and Al, CAT-extracted Fe and Mn and H2O-extracted B, compared with the control (L0), as a mean for 10 locations (). Soil pH was 0.5 pH units higher in both limed treatments than in L0. Aluminium-AL concentration was higher in SL than in L0 and GL, while Ca-AL concentration was higher in GL than in L0. Concentrations of Fe and Mn after CAT extraction were lower in the limed soils, but above the optimal level for barley (norm for Fe-CAT 20–300 mg kg−1 and Mn-CAT 30–50 mg kg−1; Anonymous Citation2003). There were no interactions between lime treatment and location with regard to soil chemical composition.
Table 6. Chemical composition of topsoil before drilling of spring barley (mean for 10 locations) approximately 1.5 years after liming.
Plant nutrient concentration in barley
Liming effects
Concentrations for all analysed nutrients and their relation to the adequate range are shown in . Lime addition affected the concentrations of K, S, Mo and Zn in barley plants at ZS31 compared with no lime (L0) as a mean for all 10 locations. In the unlimed treatment, potassium concentrations were lower compared to treatment with SL (p < 0.01) but not compared to application of GL (p = 0.67). The K concentration in L0 (3.02%) was at the lower level of the adequate range (3.0%). For S, there were no differences in concentrations between unlimed and limed treatments, but structure lime resulted in higher concentrations than GL. Concentrations of Mo were higher in both limed treatments compared with L0. However, concentrations (0.85; 1.47, 1.45 ppm respectively) were above the higher level of the adequate range (0.3 ppm) in all treatments. For Zn, treatments with GL resulted in lower concentrations than unlimed treatments but were still within the adequate range.
Figure 3. Nutrient content in aboveground biomass in growth stage ZS31 in lime treatments (mean over fertilisation strategies for 10 locations) and percentage deviation from the lower adequate level. Values to the left of the zero line are below, and values to the right above, the lower adequate level set by Bergmann (Citation1992). Different letters beside the columns indicate significant difference (p < 0.05) according to Tukey’s Honestly Significant Difference (HSD) test in two-way Anova. NS refers to not significant. Iron (Fe) concentration was also analysed and was around six-fold the lower adequate level, with no treatment effects.
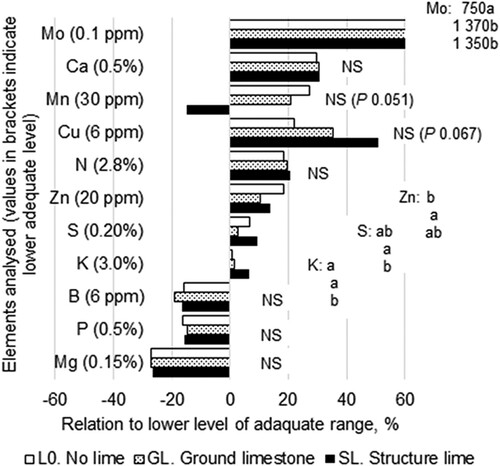
For two nutrients, Cu and Mn, liming tended to affect barley concentrations; for Cu, SL tended to give higher concentrations than unlimed treatment (p = 0.067 for model; p = 0.021 for pairwise model) and for Mn SL tended to give lower concentrations than unlimed treatment (p = 0.051 for model; p = 0.019 for pairwise model). Manganese concentrations were low at several locations; the mean Mn concentration across fertilisation strategies were below the lower adequate range at 7 of 10 sites in at least one of the limed treatments (data not shown). Manganese was supplied according to the farmer’s routines when treating the whole field (), meaning that the time between Mn supply and sampling differed between locations; Mn was sprayed by the farmers from 15 days before to 8 days after sampling (mean and median 4.6 and 5.0 days before sampling, respectively). On three of the ten farms, farmer’s Mn supply was done ≥10 days before sampling. On those three, Mn concentration was far above the lower adequate range (48–74 ppm; data for individual locations not shown) whereas all the other locations had Mn concentrations below or at the lower adequate range. This indicates that possible negative effects of liming were counteracted if Mn spraying was applied early.
For B, P and Mg, no differences between treatments could be detected, but the concentrations were below the lower level of the adequate range in all lime treatments (as means over fertilisation strategies for all ten locations; ).
Fertilisation effects
At growth stage ZS31, crop concentrations of all nutrients except P, B and Fe were affected by fertilisation strategy (). The concentrations of K, Mg, N and Zn were higher when only N and S were applied with subsurface placement (NS-Pl) compared to if N and S together with P and K were broadcast (NPKS-Bc). However, addition of foliar fertilisation did not affect the concentrations of these nutrients (NPKS-Pl and NPKSm-Pl, respectively). For S, treatments with subsurface placement and addition of P and K (NPKS-Pl and NPKSm-Pl) resulted in higher concentrations than addition with only NS or broadcast NPKS (NS-Pl and NPKS-Bc). Broadcast fertilisers also resulted in lower Mn concentrations compared to all other fertilisation strategies. The Mo concentration was lower in the three sub-plots with NPKS than in NS-Pl and the Ca concentration was lower in NPKS-Bc than in the other three fertilisation strategies.
Figure 4. Nutrient content in aboveground biomass in growth stage ZS31 in fertilisation strategies (mean over lime treatments for 10 locations) and percentage deviation from the lower adequate level. Values to the left of the zero line are below, and values to the right above, the lower adequate level set by Bergmann (Citation1992). Different letters beside the columns indicate significant difference (p < 0.05) according to Tukey’s Honestly Significant Difference (HSD) test in two-way Anova. NS refers to not significant. Iron (Fe) concentration was also analysed and was around six-fold the lower adequate level with no treatment effects. NS-Pl = Placed NS27-4 Axan; NPKS-Pl = Placed NPK Yara’s 24-4-5; NPKSm-Pl = Placed NPK Yara’s 24-4-5 + foliar fertiliser with micronutients in ZS12, 30 and 37; NPKS-Bc = Broadcast NPK Yara’s 24-4-5.
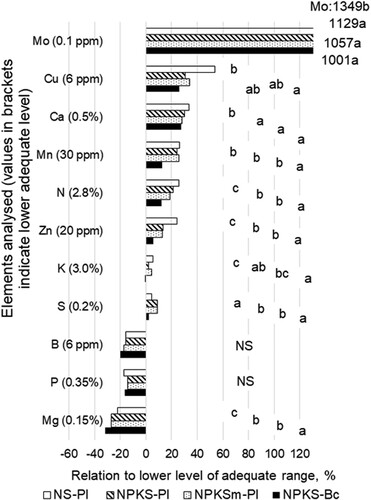
Concentrations of B, P and Mg were below the lower level of the adequate range in all fertilisation strategies and Mo and Fe concentrations were above the higher level of the adequate range (as means over lime treatments for all ten locations). For P, the concentration was below the lower adequate level at all locations except Gislöv, Vadensjö and Vallby (data not shown).
Interactions between lime, fertilisation strategy and location
An interactive effect was found between lime treatment and fertilisation strategy for K concentrations. It was apparent as lower K concentration after addition of GL compared to unlimed treatment at fertilisation with N and S only (NS-Pl) but higher K concentrations in treatment in limed treatment (GL) at fertilisation with broadcast NPKS (NPKS-Bc; data not shown).
For Mo, an interactive effect was found between lime treatment and location, where GL resulted in higher concentrations than structure lime in one of 10 locations (Linelund) and the opposite effect at another location (Vallby). For the remaining locations, Mo concentrations were similar for the two lime treatments.
Shoot numbers, nitrogen uptake and biomass in ZS31 and grain yield
There were interactive effects between liming and fertilisation in N uptake (SN value) but not in shoot numbers, biomass in ZS31 or grain yield ( and ), although the SN value was correlated with both biomass in ZS31 and grain yield (data not shown). The interaction for SN value can be attributed to different relationships for GL and SL in different fertilisation strategies (data not shown), but for all fertilisation strategies the SN value was lower in L0 than in the limed treatments.
Figure 5. (a) Spring barley biomass (100% dry matter) in growth stage ZS31, (b), grain yield (100% dry matter) of barley at the different experimental locations with barley (n = 10). P-values for lime treatments are from two-way Anova for each location. Results are mean over fertilisation strategies. Grey bars refer to ground limestone (GL) and black bars to structure lime (SL). Red dotted line shows unlimed control treatment L0 = 100.
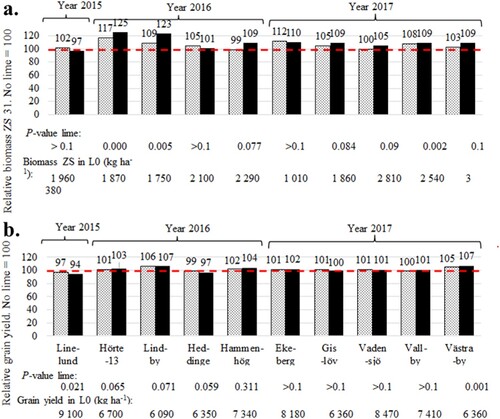
Table 7. Shoots (number m−2), SN-value* and aboveground dry biomass (DM; kg ha−1) in growth stage ZS31 and grain yield (DM, kg ha−1) as a mean for all 10 fields with barley.
Liming effects
The lime treatments resulted in higher SN value and increased shoot numbers compared with L0, but with no differences between SL and GL (). For biomass in ZS31, there were differences between all three treatments (L0, GL and SL), with SL resulting in the highest biomass and L0 in the lowest. There were no liming effects on grain yield. There were no interactions between lime treatment and location for any of the four variables (shoot numbers, SN value, biomass, grain yield).
Fertilisation effects
Biomass in ZS31 and grain yield were highest in fertilisation strategies NPKS-Pl and NPKSm-Pl and lowest in NPKS-Bc. Shoot numbers were lower in NS-Pl and NPKS-Bc than in NPKS-Pl and NPKSm-Pl, whereas SN value was only lower in NPKS-Bc than in the other fertilisation strategies (). There were interactions between fertilisation and location for reflectance, biomass in ZS31 and grain yield, which were mainly due to better response to NPK-Bc in a few locations, probably due to early rainfall after drilling.
Discussion
Aggregate stability and size distribution
Liming improves soil structure
Both limed treatments (GL and SL) improved soil structure, as indicated by decreased turbidity-A2 (, Supplementary Tables S1 and S2) and a shift towards a finer seedbed tilth (). Decreased turbidity is an indication of increased aggregate stability, which in turn can lead to agronomic advantages such as increased field emergence (Hoyt Citation1981) and improved yield level (Stenberg et al. Citation2000). Increases in aggregate stability through liming can also give environmental benefits, such as reduced total-P losses as particulate-P and dissolved reactive phosphorus (DRP), as shown by Ulén and Etana (Citation2014). A finer seedbed tilth after liming was also observed by Blackert (Citation1996). A finer tilth can act as an evaporation barrier and increase yield under dry conditions (Blomquist et al. Citation2018).
No difference in soil structure between lime products
The starting hypothesis that SL improves soil structure more than GL was not supported by the data. On the contrary, the results showed that both lime products decreased turbidity-A2 by the same magnitude (Supplementary Table S1) and there were no differences in aggregate size distribution between GL and SL (). This may be because the main constituent of both GL and SL was ground limestone (GL consisted of 100% ground limestone and SL2 was a mixture of approximately 80% ground limestone and 20% slaked lime). The finer particle size for GL (0–0.2 mm) compared with SL2 (0–0.5 mm in the mixed product 2014–2015) also gave GL an advantage, as pointed out previously by Conyers et al. (Citation2020). Electrical conductivity increased by about 30% in both GL and SL (Supplementary Tables S1 and S2), indicating similar solubility. It is therefore also reasonable that there were no differences between the limed treatments regarding soil structure indicators.
Enigmatic discrepancy between laboratory and field
Numerous field experiments show changes in soil physical characteristics after application of ground limestone (CaCO3). Chan and Heenan (Citation1998) found increased macroaggregate stability and Bennett et al. (Citation2014) detected improved aggregate stability and hydraulic conductivity 12 years after application of ground limestone (CaCO3). Earlier, de Castro et al. (Citation1999) found increased aggregate stability when comparing calcitic and dolomitic limestone. However, increases in soil strength can disappear due to soil tillage (Frank et al. Citation2019) and may be better conserved if ploughing is omitted (Frank et al. Citation2020).
The similar behaviour between the two liming products in the present study (Supplementary Table S1) contrasts with findings in other comparative investigations. Berglund (Citation1971) found increasing aggregate size and aggregate stability on adding quicklime (CaO) and slaked lime to clay soils, but no corresponding effect on adding ground limestone. Keiblinger et al. (Citation2016) also found that quicklime brought instantaneous aggregate stability increases, whereas limestone did not. Vargas et al. (Citation2019) observed significant aggregate stability increments with slaked lime, but no parallel effects with limestone, calcium sulphate (CaSO4) or calcium chloride (CaCl2). A feature in common to those studies is that they were performed in the laboratory. Similarly, Siman et al. (Citation1984) found marked differences in mean weight diameter (MWD) of aggregates when comparing ground limestone with quicklime in a study where soil and liming products were mixed in the laboratory. However, when microaggregate analysis was performed on the same soils sampled from field experiments with the same liming treatments, only weak differences could be detected in the first year after liming and no differences were detected six and 10 years after liming for either limestone or quicklime compared with unlimed soil (Siman et al. Citation1984). There is thus an enigmatic discrepancy between laboratory and field experiments.
For mortar formation or pozzolanic reactions to occur, noncarbonated lime needs to be present (Choquette et al. Citation1987). Since treatment GL did not contain noncarbonated lime and since treatments GL and SL improved soil structure by the same order of magnitude in this study, this suggests that the improved aggregate stability was achieved through increased cation exchange, with mortar formation and/or pozzolanic reactions not playing a dominant role.
This was confirmed by the ‘internal’ comparison of the effect of SL1 (Supplementary Table S1 All trials 2013) and SL2 (Supplementary Table S1 all trials 2014–2015), which showed no differences in turbidity compared with L0. Follow-up measurements 5–6 years after liming are currently being carried out, to assess whether mortar formation or pozzolanic reactions have developed over time.
Lime does not improve soil structure in all clay soils
The lime treatments had varying effects on soil structure depending on location (, Supplementary Table S2), indicating that more knowledge is needed on how liming and structure liming affect different soils. These results are in line with Olsson et al. (Citation2019) who found different responses in plant-available Ca and Mg after liming with ground limestone on soils with different initial pH levels. Different mineralogy can also play a role in the response to liming, as demonstrated by Vargas et al. (Citation2019).
This indicates a need for further investigations in order to predict with greater precision locations where structure liming is suitable. Results from 30 field trials in southern Sweden with increasing application rates of structure lime (Blomquist et al. Citation2022) point at different reactions on different soils for the same structure lime treatment, with the outcome depending on soil variables such as initial pH, clay content, clay mineralogy and organic matter content. The results also suggest that soil tillage before and after liming can be crucial for the outcome of structure liming.
Plant growth, grain yield, nutrient concentration and N uptake
No interactions between lime treatment and fertilisation strategy
The sub-plot treatments with different fertilisation strategies confirmed the expected positive response of fertiliser placement on biomass (+19%) and SN value at ZS31 (+13%) and on grain yield (+4%) compared with broadcast fertiliser (). The increase in grain yield was similar to that reported in a meta-analysis by Nkebiwe et al. (Citation2016). Fertiliser placement generally increases nutrient uptake (Nkebiwe et al. Citation2016), but it is difficult to explain exactly how this occurs. Yield increase in response to starter fertilisation may reflect the additive effects of satisfying nutrient limitations or the synergistic effects of nutrients in the fertiliser enhancing plant growth (Quinn et al. Citation2020). Examples of synergistic effects include: (i) starter N and P causing root proliferation, which leads to more effective use of K by the crop (Mallarino et al. Citation2011) and (ii) N applied in ammonium form causing acidification, which increases P uptake by young plants (Riley and Barber Citation1971). Larger yield response tends to be observed for soils low in P and K, but positive responses have also been observed for soils with P and K content above the critical level (Bermudez and Mallarino Citation2002; Kaiser et al. Citation2005; Wortmann et al. Citation2006; Mallarino et al. Citation2011).
There was no interactive effect between liming treatment and fertilisation strategy on growth () or nutrient concentration (with the exception of K concentration), so our second hypothesis was not confirmed. Leaf concentrations of K, Mg, P, S, B and Mn were below or close to the lower adequate level in at least one of the lime treatments () or fertilisation strategies (). Therefore, any of those elements could explain treatment effects or interactive effects between lime and fertilisation strategies on biomass in ZC31 or grain yield. Of those elements, only K, Mg, S and Mn concentrations differed between fertilisation strategies (always higher when placed than broadcast, ) and K, S and Mn differed between lime treatments (, for Mn p = 0.051, i.e. only a tendency). Regarding lime effects, K concentration increased, and Mn tended to decrease, after structure liming compared with no lime, whereas for S only ground lime and structure lime differed. The lack of interaction between lime treatment and fertilisation strategy in our study may be due to these contradictory effects for the three elements, especially K and Mn. The higher concentration of K and S in structure lime treatments compared with ground lime may be due to the stronger chemical reaction of structure lime compared with pure ground limestone. Pozzolanic reactions involve dissolution of silicon tetrahedra and aluminium octahedra, which occurs in the strongly alkaline environment (∼pH 12.4) that forms when burnt or slaked lime is added to soil (Al-Mukhtar et al. Citation2010). However, a more likely explanation is that Nordkalk Aktiv Structure (SL2) contains not only Ca, but also other plant nutrients (). Although the structure lime was added 1.5 years before establishment of spring barley, there was probably still a fertiliser effect of those elements on the barley although differences were not observable in K-AL or Cu-CAT ().
No negative effect of lime on P concentration
Phosphorus concentration was ∼15% below the lower adequate level in all fertilisation strategies in ZC31 except at three locations having high or medium P-AL and pH not above 7.0 at start (; Gislöv, Vadensjö and Vallby). Our expectation that P would be more available in fertilisation strategies with placed rather than broadcast fertiliser was not confirmed by analyses of P concentrations in plants. However, similar foliar concentration () but higher biomass at ZS31 () indicated increased P uptake for placed N compared with broadcast NPK and a further increase for placed NPK. Fertilisation strategy also affected grain yield, although to a lesser extent (). The low P concentration is in line with the findings by Barrow et al. (Citation2020) that P is most available to plants at pHCaCl2 5.5 and lower at pHCaCl2 around 7 (i.e. ∼6–7.5 for pHH2O). Penn and Camberato (Citation2019) on one hand and Barrow (Citation2021) on the other, but also Barrow (Citation2017) and Barrow et al. (Citation2020), report totally different findings for P availability at different pH, but all agree that increasing pH on the type of soils used in the present study (pH ∼7.3) is not favourable for P availability. Barrow (Citation2021) found that the most important factor for P uptake was that plants were unable to use P in phosphate form (HPO2-), which increases with increasing pH. Barrow (Citation2017) cites Vange et al. (Citation1974), who showed that P uptake very closely follows the curve for H2PO4- when H2PO4- shifts to HPO2- with increasing pH from 6. Only H2PO4- is available for plant use, owing to the uptake mechanism in all plant roots (Rausch and Bucher Citation2002).
Positive yield impact of lime on early growth, but not grain yield
The positive effects of liming on biomass in ZS 30-31 but not on grain yield was unexpected possible explanations will be discussed. Apart from affecting vegetative growth, P is particularly important for reproductive development (Bergmann Citation1992). Sufficient P concentration in ZS31-ZS39 is important for a high number of fertile ears and high number of grains per ear (Römer and Schilling Citation1986). Seed production and grain yield are also more strongly affected than vegetative growth by e.g. low B concentrations (Rerkasem et al. Citation1997). Further, there is an interaction between B and P where plants with low P concentrations need more B than those with adequate P status, and high Ca concentration in young organs is believed to reduce the concentration of soluble (active) B (Bergmann Citation1992). The Mg concentration in our experiments was almost 30% below the lower adequate level ( and ) and, with the high concentration of Ca, ∼30% above lower adequate level ( and ), the Mg/Ca ratio was only 0.17 (0.11%/0.65% of DM). Wichmann (Citation1976; cit. Bergmann Citation1992) showed that Mg/Ca ratio is important, with an optimal value of 0.3 for barley and wheat. In the present study the low Mg/Ca ratio (mean 0.17 Mg/Ca) may have been one of the main growth-limiting factors. Magnesium fertilisation has a greater effect on grain yield than on straw production (Bergmann Citation1992). Thus, although P, B and Mg in our experiments were not affected by lime treatments, their low concentrations and the high Ca concentration in this study may be a reason for the increase in biomass in ZC31 after liming but with unaffected grain yield. This indicates that irrespectively of liming or not liming, applying P, B and Mg as a foliar fertiliser could have increased yield in all treatments, but possibly more in limed treatments than in the unlimed control. Crop response of foliar fertilisation treatments varies between studie and many factors influence the performance of foliar nutrient sprays (Fernández and Eichert Citation2009; Fernández et al. Citation2013; Fernández and Brown Citation2013). Environmental conditions can affect the amount and composition of epicuticular waxes, which in turn may influence stomatal and trichome development and ultimately affect the penetration rate of foliar-applied solutes. Relative humidity (RH) is a key factor influencing penetration of foliar-applied solutions. The foliar fertiliser in NPKSm-Pl was supplied during daytime, i.e. under low RH conditions. This, together with non-optimal nutrient composition of the foliar fertiliser used in treatment NPKSm-Pl (low content of Mg and no P and B), may be a reason why increased biomass for both types of lime was not reflected in increased grain yield in any of the fertilisation strategies.
Conclusions
Both types of lime, ground limestone and structure lime, had similar positive effects on soil structure, on shoot numbers and early growth, but not on grain yield. Thus, the structure lime used was not superior to ground limestone. On the soil types studied, liming is only of economic interest in barley production if effects of improved soil structure such as reduced P losses are credited or if costs due to soil tillage are reduced. The expected interactive effects of lime treatment and fertilisation strategy did not materialise. Five of 12 nutrients analysed were below (Mg, P, B) or close to (K and S) the lower level of the adequate concentration range in shoots in growth stage ZS31 in at least one of the lime treatments. Of those five, only K concentration was affected by lime treatment (increased concentration in treatments with structure lime). The absent interaction between liming and fertilisation can possibly be due to Mn spraying by farmers in all locations as part of their general fertilisation routines reduced or avoided negative effects of liming on Mn availability. Thus, on the rather fertile type of soils studied, with pH ∼7.3 and ∼20% clay, there is no reason to change fertilisation strategy due to liming. However, nutrients added with the structure lime product used must be considered and measures should generally be taken to improve Mg, P and B concentration and uptake in barley, with or without lime supply.
Disclosure statement
Within an environmental project (LOVA, lokala vattenvårdsprojekt) funded by Havs-och vattenmyndigheten (Swedish Agency for Marine and Water Management), Hushållningssällskapet has economic transactions with Nordkalk.
Additional information
Funding
Notes on contributors
Anita Gunnarsson
Anita Gunnarsson (PhD) is a specialist in agriculture. Main research topics are: (1) nutrient efficiency and (2) organic and conventional crop rotations with the focus on agronomic performance
Jens Blomquist
Jens Blomquist (PhD) recently defended his doctoral thesis on effects of structure liming on clay soil at the Swedish University of Agricultural Sciences. He has a background in the advisory services and was formerly R&D programme leader in the sugar beet industry, focusing on questions related to soil fertility and sugar yield.
Lars Persson
Lars Persson (PhD) is a senior scientist in plant pathology and has been studying soil-borne pathogens for 25 years. Main research topics are: (1) impact of crop rotations and (2) interactions between soil properties, infection and crop loss.
Åsa Olsson
Åsa Olsson Nyström (PhD) is a senior scientist in plant pathology and soil sciences. Main research topics are: (1) distribution, diagnostics and control of plant parasitic nematodes in agricultural and horticultural crops and (2) effects of intercrops and lime on soil fertility in various soils.
Karin Hamnér
Karin Hamnér (PhD) is a specialist in soil science and plant nutrition. Main research topics are: (1) nutrient uptake related to soil properties and fertilisation management and (2) grain yield and quality related to fertilisation strategy in cereal crops.
Kerstin Berglund
Kerstin Berglund (PhD) is a senior scientist and associate professor in soil science and has more than 30 years’ experience of studies on soil- and water-related subjects in agricultural production. Main research topics are: (1) physical properties of soils, soil structure improvement and mitigation of negative environmental effects in arable farming and (2) sustainable management of cultivated organic soils, focusing on mitigation of greenhouse gas emissions.
References
- Al-Mukhtar M, Lasledj A, Alcover JF. 2010. Behaviour and mineralogy changes in lime-treated expansive soil at 20 degrees C. Appl Clay Sci. 50(2):191–198. doi:10.1016/j.clay.2010.07.023.
- Anonymous. 2003. Richtwerte zur Einstufung der Mikronährstoffgehalte in Böden bei Anwendung det CAT-Methode. Merkblatt. Thüringer Landesanstalt für Landwirtschaft, Abteilung Agroökologie, Ackerbau und Grünland Abteilung Untersuchungswesen. Thüringer Ministerium Für Landwirtschaft, Naturschutz und Umwelt. Jena, Germany. 2 pp.
- Barrow N. 2017. The effects of pH on phosphate uptake from the soil. Plant Soil. 410:401–410. doi:10.1007/s11104-016-3008-9.
- Barrow NJ. 2021. Comparing two theories about the nature of soil phosphate. Eur J Soil Sci. 72:679–685. doi:10.1111/ejss.13027.
- Barrow NJ, Debnath A, Sen A. 2020. Measurement of the effects of pH on phosphate availability. Plant Soil. 454:217–224. doi:10.1007/s11104-020-04647-5.
- Bennett JM, Greene R, Murphy B, Hocking P, Tongway D. 2014. Influence of lime and gypsum on long-term rehabilitation of a Red sodosol, in a semi-arid environment of New South Wales. Soil Res. 52:120–128.
- Berglund G. 1971. Kalkens inverkan på jordens struktur. Lantbrukshögskolan. Uppsala, institutionen för lantbrukets hydroteknik. Grundförbättring. 1971(2):81–93.
- Bergmann W. 1992. Nutritional disorders of plants: development, visual and analytical diagnosis, 3rd ed. Jena, Stuttgart, New York: Gustav Fischer Verlag. 741 pp.
- Bermudez M, Mallarino AP. 2002. Yield and early growth responses to starter fertilizer in no-till corn assessed with precision agriculture technologies. Agron J. 94:1024–1033. doi:10.2134/agronj2002.1024.
- Blackert C. 1996. Plöjningsfri odling och strukturkalkning på lerjordar. (Ploughless tillage and structural liming on clay soils). Swedish University of Agricultural Sciences, Department of soil sciences Meddelanden från jordbearbetningsavdelningen nr 20.
- Blomquist J, Englund J-E, Berglund K. 2022. Soil characteristics and tillage can predict the effect of ‘structure lime’ on soil aggregate stability. Soil Res. 60(4):373–384. doi:10.1071/sr21022.
- Blomquist J, Simonsson M, Etana A, Berglund K. 2018. Structure liming enhances aggregate stability and gives varying crop responses on clayey soils. Acta Agri Scand Sect B-Soil Plant Sci. 68:311–322. doi:10.1080/09064710.2017.1400096.
- Chan K, Heenan D. 1998. Effect of lime (CaCO3) application on soil structural stability of a red earth. Soil Res. 36:73–86.
- Choquette M, Bérubé M-A, Locat J. 1987. Mineralogical and microtextural changes associated with lime stabilization of marine clays from eastern Canada. Appl Clay Sci. 2:215–232.
- Conyers MK, Scott BJ, Whitten MG. 2020. The reaction rate and residual value of particle size fractions of limestone in southern New South Wales. Crop Past Sci. 71:368–378. doi:10.1071/cp20045.
- de Castro OM, de Camargo OA, Vieira SR, Vasques J. 1999. Effect of two types of lime on some soil physical attributes of an oxisol from Brazil. Commun Soil Sci Plan. 30:2183–2195. doi:10.1080/00103629909370364.
- EEA. 2019. Climate change adaptation in the agriculture sector in Europe. European Environment Agency, Copenhagen, Denmark. Report 4, 112 pp.
- Egnér H, Riehm H, Domingo WR. 1960. Untersuchungen über die chemische Bodenanalyse als Grundlage für die Beurteilung des Nährstoffzustandes der Böden. II. Chemische Extraktionsmethoden zur Phosphor- und Kaliumbestimmung. (Investigations on soil chemical analysis as a basis of the evaluation of plant nutrient status of soils. II. Chemical extraction methods for phosphorous and potassium determination). Kungl. Lantbrukshögskolans annaler (The annals of the Royal agricultural college of Sweden) 26, 199-215 (in German).
- Fernández V, Brown PH. 2013. From plant surface to plant metabolism: the uncertain fate of foliar-applied nutrients. Front Plant Sci. 4:1–5 doi:10.3389/fpls.2013.00289.
- Fernández V, Eichert T. 2009. Uptake of hydrophilic solutes through plant leaves: current state of knowledge and perspectives of foliar fertilization. Crit Rev Plant Sci. 28:36–68. doi:10.1080/07352680902743069.
- Fernández V, Sotiropoulos T, Brown PH. 2013. Foliar fertilisation: scientific principles and field practices. Paris: International Fertilizer Industry Association (IFA).
- Frank T, Zimmermann I, Horn R. 2019. The need for lime in dependence on clay content in arable crop production in Germany. Soil and Tillage Research. 191:11–17.
- Frank T, Zimmermann I, Horn R. 2020. Lime application in marshlands of Northern Germany—Influence of liming on the physicochemical and hydraulic properties of clayey soils. Soil Tillage Res. 204:1–10.
- Gnyp M, Panitzki M, Reusch S. 2015. Proximal nitrogen sensing by off-nadir and nadir measurements in winter wheat canopy. In: Stafford J., editor. Precision Agriculture ´15, Conference: 10th European Conference on Precision Agriculture, 12-16 July 2015. Tel Aviv: Wagening Academic Publisher, Wageningen, The Netherlands pp. 43–50. doi:10.3920/978-90-8686-814-8_4.
- Holland JE, Bennett AE, Newton AC, White PJ, McKenzie BM, George TS, Pakeman RJ, Bailey JS, Fornara DA, Hayes RC. 2018.: liming impacts on soils, crops and biodiversity in the UK: A review. Sci Total Environ. 610-611:316–332. doi:10.1016/j.scitotenv.2017.08.020.
- Holmes JC, Donald AH, Chapman W, Lang RW, Smith KA, Franklin MF. 1983. Effects of soil compaction, seed depth, form of nitrogen-fertilizer placement and manganese availablity on barley. J Sci Food Agric. 34:671–684. doi:10.1002/jsfa.2740340703.
- Hoyt P. 1981. Improvements in soil tilth and rapeseed emergence by lime applications on acid soils in the Peace River region. Can J Soil Sci. 61:91–98. doi:10.4141/cjss81-010.
- Kaiser DE, Mallarino AP, Bermudez M. 2005. Corn grain yield, early growth, and early nutrient uptake as affected by broadcast and in-furrow starter fertilization. Agron J. 97:620–626. doi:10.2134/agronj2005.0620.
- Keiblinger KM, Bauer LM, Deltedesco E, Holawe F, Unterfrauner H, Zehetner F, Peticzka R. 2016. Quicklime application instantly increases soil aggregate stability. International Agrophysics. 30:123–128. doi:10.1515/intag-2015-0068.
- Kritz G. 1983. Såbäddar för vårstråsäd (Physical conditions in cereal seedbeds). Swedish University of Agricultural Sciences. Dep. of Soil Sciences, Uppsala. Rapporter från jordbearbetningsavdelningen (Reports from the Division of Soil Management), nr 65.
- Ledin S. 1981. Physical and micromorphological studies of the effects of lime on a clay soil. Akademisk avhandling, Agr. Dr (PhD thesis), Sveriges Lantbruksuniversitet (Swedish University of Agricultural Sciences), Uppsala. ISBN: 91-576-0900-4.
- Mallarino AP, Bergmann N, Kaiser DE. 2011. Corn responses to in-furrow phosphorus and potassium starter fertilizer applications. Agron J. 103:685–694. doi:10.2134/agronj2010.0377.
- Nkebiwe PM, Weinmann M, Bar-Tal A, Muller T. 2016.: fertilizer placement to improve crop nutrient acquisition and yield: A review and meta-analysis. Field Crops Res. 196:389–401. doi:10.1016/j.fcr.2016.07.018.
- Olsen SR, Cole CV, Watanabe FS, Dean LA. 1954. Estimation of available phosphorus in soils by extraction with sodium bicarbonate. USDA Circ 939; USA. Dept. of Agriculture.
- Olsson Å, Persson L, Olsson S. 2011. Variations in soil characteristics affecting the occurrence of Aphanomyces root rot of sugar beet - risk evaluation and disease control. Soil Biol Biochem. 43:316–323. doi:10.1016/j.soilbio.2010.10.017.
- Olsson Å, Persson L, Olsson S. 2019. Influence of soil characteristics on yield response to lime in sugar beet. Geoderma. 337:1208–1217. doi:10.1016/j.geoderma.2018.11.020.
- Penn CJ, Camberato JJ. 2019. A critical review on soil chemical processes that control how soil pH affects phosphorus availability to plants. Agriculture-Basel. 9(1):18. doi:10.3390/agriculture9060120.
- Quinn DJ, Lee CD, Poffenbarger HJ. 2020.: Corn yield response to sub-surface banded starter fertilizer in the US: A meta-analysis. Field Crops Res. 254:1–8. doi:10.1016/j.fcr.2020.107834.
- Rausch C, Bucher M. 2002. Molecular mechanisms of phosphate transport in plants. Planta. 216:23–37. doi:10.1007/s00425-002-0921-3.
- Rerkasem B, Lordkaew S, Dell B. 1997. Boron requirement for reproductive development in wheat (reprinted from plant nutrition for sustainable food production and environment, 1997). Soil Sci Plant Nutr. 43:953–957.
- Riley D, Barber SA. 1971. Effect of ammonium and nitrate fertilization on phosphorus uptake as related to root-induced pH changes at the root-soil interface. Proceedings. Soil Science Society of America. 35:301–306. doi:10.2136/sssaj1971.03615995003500020035x.
- Römer W, Schilling G. 1986. Phosphorus requirements of the wheat plant in various stages in its life-cycle. Plant Soil. 91:221–229. doi:10.1007/bf02181789.
- Siman G, Berglund K, Eriksson L. 1984. Effekt av stora kalkgivor på jordens struktur, växtnäringshushållning och skördens storlek (Effect of large lime quantities on soil structure, nutrient balance and crop yields). A. Kalkens effekt på markens växtnäringshushållning, skördens storlek och skördeprodukternas innehåll av växtnäring (Effect of lime on soil properties, crop yields and nutrient concentrations in yield products). Swedish University of Agricultural Sciences, Department of soil sciences, Avdelningen för växtnäringslära (Division of Soil Fertility) Rapport 148.
- Stenberg M, Stenberg B, Rydberg T. 2000. Effects of reduced tillage and liming on microbial activity and soil properties in a weakly-structured soil. Appl Soil Ecol. 14:135–145.
- Ulén B, Etana A. 2014. Phosphorus leaching from clay soils can be counteracted by structure liming. Acta Agri Scand Sect B-Soil Plant Sci. 64:425–433. doi:10.1080/09064710.2014.920043.
- Vange MS, Holmern K, Nissen P. 1974. Multiphasic uptake of sulfate by barley roots. 1) effects of analogs, phosfate and pH. Physiol Plant. 31:292–301. doi:10.1111/j.1399-3054.1974.tb03709.x.
- Vargas G, Verdejo J, Rivera A, Suárez D, Youlton C, Celis-Diez JL, Le Bissonnais Y, Dovletyarova EA, Neaman A. 2019. The effect of four calcium-based amendments on soil aggregate stability of two sandy topsoils. J Plant Nutr Soil Sci. 182:159–166. doi:10.1002/jpln.201700562.
- Wichmann W. 1976. Ermittlung von Grenzwerten der Pfantzenanalyse zur Kennzeichnung der Magnesium-Versorgung von Getreide in Schleswig-Holstein. Diss. Univ. Kiel.
- Wortmann CS, Xerinda SA, Mamo M, Shapiro CA. 2006.: No-till row crop response to starter fertilizer in eastern Nebraska: I. irrigated and rainfed corn. Agron J. 98:156–162. doi:10.2134/agronj2005.0015.
- Zadoks JC, Chang TT, Konzak CF. 1974. Decimal code for growth stages of cereals. Weed Res. 14:415–421. doi:10.1111/j.1365-3180.1974.tb01084.x.