
ABSTRACT
This paper reports on an investigation of the interactions between source speech difficulty, interpreters’ work experience and their note-taking behaviour in video remote interpreting. 20 professional interpreters and 29 student interpreters consecutively interpreted two easy segments and two difficult segments from English (L2) to Chinese (L1), with their eye and pen movements being registered by a Tobii eye-tracker and a Wacom digital pen. The results show that: (1) an increase of perceived interpreting difficulty led to a decrease in the overt visual attention and physical effort invested in note-taking, and a longer time to make note-taking decisions; (2) although the professionals and students reported a similar level of interpreting difficulty, the professionals devoted more overt visual attention and physical effort to completing the note-taking activity in interpreting than the students; and (3) the cognitive effort of note-taking was not affected by changes in source speech difficulty or interpreter work experience. These findings indicate that: (1) interpreting experience accumulation does not entail reductions in task-difficulty perception or the cognitive effort of note-taking but increases the amount of effort interpreters devote to note-taking; and (2) increased task difficulty affects time management during note-taking but not the cognitive effort of note-taking.
1. Introduction
Consecutive interpreting (CI) consists of an input phase of source speech comprehension and an output phase of target speech production. Since the source speech can last minutes, interpreters usually resort to notes to reduce the pressure on their memory. During note-taking, interpreters encode selected information in the source speech into written notes; while during note-reading, interpreters decode their notes to recall the source speech and deliver the interpretation. Despite the benefits of notes in memory retrieval, note-taking does require a certain amount of cognitive and manual effort on the part of interpreters, as human writing speed is only about one-tenth of speaking speed (Foulin, Citation1995). As a result, less effort is available for other sub-tasks during the input phase of CI, including listening to the source speech (L), memorizing information in mind (M) and coordinating these activities (C) (Gile, Citation2009). If interpreters’ cognitive effort exceeds their limit, their interpreting quality will diminish.
According to Chen (Citation2017), cognitive loadFootnote1 in interpreting is constructed from two aspects (). The first aspect concerns task and environmental characteristics, among which task difficulty has received the most attention from researchers. In a note-taking context, when the source speech is difficult to interpret, interpreters can decrease their note-taking effort by noting less or using familiarized abbreviations and symbols (e.g. Gillies, Citation2017) to make more processing capacity available for receiving the source speech; or they can increase the effort to maintain note quantity and quality. As long as interpreters can retrieve their memory of the source speech from notes, they can adopt flexible note-taking strategies according to the source speech features and their availability of cognitive resources.
Figure 1. The construct of cognitive load in interpreting. This figure is taken from Chen (Citation2017, p. 644).
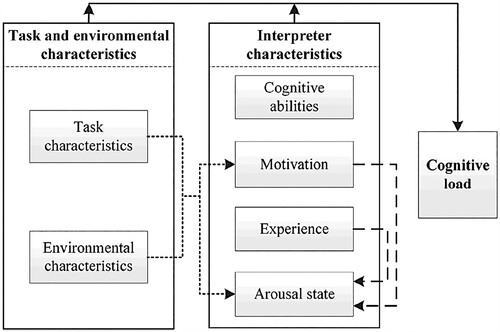
Environmental characteristics include the ‘physical environment conditions … , visibility of the speaker and/or audience, and the equipment used’ (Chen, Citation2017, p. 645) during interpreting, all of which are difficult to control in remote interpreting. However, as a result of globalization and advancements in information technology, remote interpreting has become increasingly popular in the interpreting industry (European Commission, Citation2020) and for interpreter training (Ko & Chen, Citation2011). It has even become a new normal for professional interpreters working at home (AIIC, Citation2020) because of social distancing during the COVID-19 pandemic. In remote interpreting, interpreters can have audio-only or audio-visual access to the interlocutors. The latter case is usually called Video Remote Interpreting (VRI) or Video Mediated Interpreting (VMI) (Braun & Taylor, Citation2012; Napier et al., Citation2018). In VRI, since interpreters’ vision of the venue is significantly restricted, they have to make extra effort to obtain the visual information they need such as the speaker’s body language and the audience’s response. In that case, fewer cognitive resources are available for other sub-tasks in interpreting such as note-taking. However, it remains underexplored how interpreters can effectively allocate their limited visual attention and cognitive resources to process audio-visual information in the video and take notes at the same time. The need for exploration of the cognitive mechanism behind VRI is therefore urgent to help professional and student interpreters to adapt to these remote working and training environments.
The second aspect of cognitive load in interpreting concerns interpreter characteristics, including interpreters’ cognitive abilities, motivation, experience and arousal state while completing the interpreting task (Chen, Citation2017). Of these characteristics, interpreting experience has received the most attention from note-taking researchers. Some researchers have found that professional and student interpreters have the same note patterns (e.g. Andres, Citation2002), while others have found the opposite (e.g. Abuín González, Citation2012). This might relate to the highly individual nature of notes, in that there are no absolute rules governing their form: they just have to make sense to the interpreters. Therefore, note patterns should be interpreted with respect to an exploration of the cognitive processes underlying the note-taking process.
In brief, note-taking is a complex cognitive activity, and note-taking decisions depend on the interaction between the interpreting task and the interpreter. In order to understand previous investigations of this interaction, we chose ‘note’, ‘notation’ and ‘note-taking’ as the keywords for searching the following databases, the Conference Interpreting Research Information Network Bulletin (CIRIN Bulletin), Translation Studies Bibliography (TSB) and the Chinese Social Sciences Citation Index (CSSCI), and identified 30 empirical studiesFootnote2 for these keywords. 13 more relevant articles were found from the reference lists of the retrieved items. However, among the 43 papers in total, only 3 discussed source speech difficulty and 6 involved participants with different levels of interpreting expertise. All the studies focused on on-site interpreting rather than remote interpreting, and only 3 explored the process of note-taking. The following section presents a brief review of note-taking research that includes interpreting experience and/or source speech features into consideration.
2. Research background
2.1 Effects of source speech features on note-taking in CI
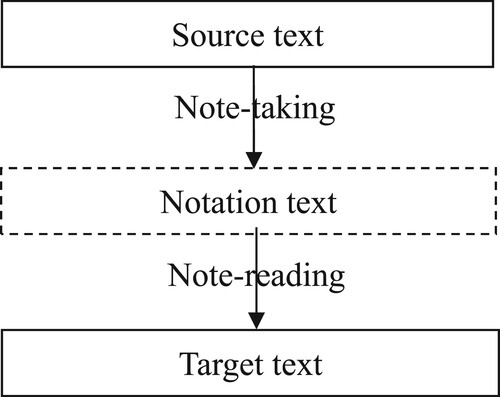
There are three texts in a CI task: source text, notation text and target text (Albl-Mikasa, Citation2006). Among these, the source text is of particular importance because the notation text is produced based on the interpreter’s comprehension of the source text; while the notation text, in turn, serves as an information source for the production of the target text (). In other words, interpreters’ note-taking behaviour can be affected by the features of the source speech, and their note-taking behaviour will in turn affect their note-reading behaviour and the quality of the target speech. This section introduces three studies that have explored the impacts of source speech features on interpreters’ note-taking behaviour in a thematic and chronological order.
Figure 2. Relationships of source text, notation text and target text in CI.
The features of source speech have been found to be influential for both the product and process of note-taking. Dam (Citation2004) observed more uses of source language among 4 student interpreters’ notes when the source speech became more difficult, which implied increased effort for listening comprehension and decreased effort for language transfer. In other words, note-taking decisions are made based on the interaction between source speech difficulty and interpreters’ processing capacity. Hu (Citation2008) took this one step further by examining how the familiarity with lexical and syntactic structures of source speech affects interpreters’ cognitive effort of note-taking. 10 professional interpreters and 10 student interpreters completed a secondary task of sound detection while conducting the primary task of CI. The task-switching time was measured to indicate the cognitive effort of note-taking. The results show that the interpreters reacted to the secondary task faster when they were more familiar with the structures, indicating less cognitive effort involved in note-taking. However, since interpreters had to complete the secondary task by pressing a button while their hands were occupied by note-taking, this design can be intrusive as it breaks the continuity of the note-taking process. Chen (Citation2020a) adopts a more natural experimental design, using pen-recording and eye-tracking technology to compare 18 professional interpreters’ cognitive effort of note-taking and note-reading in different interpreting directions. She found that the participants’ cognitive effort of note-taking was higher when interpreting into their first language (L1), but the cognitive effort of note-reading was higher when interpreting into their second language (L2). This result implies a joint impact of the input language and interpreters’ language background on the cognitive effort of note-taking and note-reading.
In summary, existing studies suggest that the features of source speech can exert significant impacts on interpreters’ note-taking behaviour. However, our understanding of this issue is limited because: (1) process-oriented methods such as eye-tracking and pen-recording have not been widely adopted in note-taking studies, and researchers usually speculate about what happens during the note-taking process based on the note patterns; (2) no note-taking study is conducted in a remote interpreting setting, which significantly decreases the applicability of previous findings to remote CI; and (3) only one study involves both professional and student interpreters, and the number of participants in each group is only 10. Therefore, no conclusive evidence is available to explain the effects of source speech difficulty on note-taking.
2.2 Effects of interpreting experience on note-taking in CI
As mentioned above, only six studies have explored the effect of interpreting experience on interpreters’ note-taking behaviour, and they will be reviewed in this section thematically and chronologically. The first line of the research focuses on the product of note-taking. Specifically, on note language, Andres (Citation2002) found that both professional and student interpreters preferred source language over target language; whereas Dai and Xu (Citation2007), Abuín González (Citation2012) and Gao (Citation2019) have observed a source-to-target language shift from the less-experienced group(s) to the more-experienced group(s). In terms of note forms, while Dai and Xu (Citation2007) found that interpreting training experience facilitated interpreters to use abbreviations and symbols in note-taking, Chen (Citation2021) reports a lower proportion of symbols in professionals’ notes than in student’s notes. As for note quantity, Gao (Citation2019) reports no statistically significant difference across student interpreters with three levels of interpreting expertise; while Chen (Citation2021) finds that professionals noted more than students in an L2-L1 task. Overall, inconsistent findings have been reported on the product of note-taking, encouraging researchers to turn to the process of note-taking.
The second line of the studies has explored the process of note-taking. Andres (Citation2002) compared professional and student interpreters’ processing effort of note-taking by manually calculating (with the help of time-coded videos) the time span between the source speech delivery and the act of note-taking. The longest time lag for students was around ten seconds, while that for professionals was about six seconds. Andres (Citation2002) therefore concluded that the students experienced much higher processing load during note-taking than the professionals. In line with Andres (Citation2002), Hu (Citation2008) found that professional interpreters were faster than student interpreters in completing a secondary task while performing the primary task of note-taking, which indicates that the professionals bore a lighter cognitive load during note-taking than the students. In addition, she found that student interpreters speeded up significantly in the secondary task after receiving intensive training (48 h in the space of two months) in the type of interpreting materials in the test, indicating a significant reduction in the cognitive effort of note-taking. Moreover, by adopting pen-recording technology, Chen (Citation2021) found that compared with student interpreters, professional interpreters wrote faster, followed the source speech closer and put less pressure on the pen during note-taking. She therefore suggests that the professionals experienced less cognitive load and tension during note-taking than the students. In other CI studies, CI experience was also found to be beneficial in accelerating information updating and task-switching in the mind (Dong & Liu, Citation2016). All of these findings imply that more experienced interpreters have an advantage over less experienced interpreters in note-taking, in that they can update source-speech information, switch between listening comprehension and note-taking, and complete note-taking more easily and quickly.
2.3 The present study
The above review indicates that source speech difficulty and interpreter work experience have seldom been considered in process-oriented or product-oriented note-taking studies. Therefore, the present study aims to explore how professional and student interpreters conduct the complex note-taking activities in VRI, with a pre-recorded speech that contains both easy and difficult materials. Since the eye and pen movements during note-taking in this study were activated by the interpreters’ allocation of cognitive and manual resources, we collected these two sets of data to probe into the process of note-taking. Together with the evaluation of their notes and interpreting performance, the study attempts to answer two major questions:
What is the impact of source speech difficulty on interpreters’ note-taking effort? For this research question, we hypothesize that, in the difficult segments, the interpreters would rely more on note-taking because they would not be able to store and process source-speech information as quickly as in the easy segments. Hence, the interpreters’ overt visual attention on the note areas and the cognitive and physical effort of note-taking would be significantly greater in the difficult segments than in the easy ones.
What is the impact of interpreter work experience on interpreters’ note-taking effort? The hypothesis is that professional interpreters would be more proficient at note-taking and less reliant on notes in interpreting compared with student interpreters. Less overt visual attention on notes and less cognitive and physical effort of note-taking are expected to be found for the professionals than for the students.
3. Methods
3.1 Participants
The participants were recruited through voluntary response and snowball sampling methods. This started from the researchers’ professional and academic networks and developed in turn through the networks of the first group of qualified participants. Altogether, 24 professional interpreters and 31 master students from 11 universities with normal or corrected-to-normal vision participated in the experiment. Most of the professionals had a master’s degree in interpreting (87.5%). Three who had learned interpreting from professional training courses (12.5%) had passed the Level-II test of the China Accreditation Test for Translators and Interpreters. On average, the professionals had received 1.64 years’ (SD = 0.68 year) interpreting training, including systematic note-taking. The students had just finished their first-year master’s program of Translation and Interpreting which included intensive CI training and note-taking practice.Footnote3 The participants have Chinese as L1 and English as L2. They signed a consent form clarifying their full anonymity and confidentiality and were rewarded with a supermarket gift token upon task completion. The research was approved by the research ethics committee of a UK university and the project ID is MLAC-2019-06-13T14:42:41-tzcw84.
The Covid-19 pandemic broke out on 31 December 2019, and our experiment was conducted between July and December 2020. At the time of the experiment, all the professionals had started to conduct VRI in their work, and the students had attended video-mediated interpreting classes online for one semester. Both groups had experience in interpreting speech presented through a computer screen.
We eventually analysed data obtained from 20 professionals and 29 students () after assessing the quality of eye-tracking data based on Hvelplund (Citation2011). We found Hvelplund’s assessment criteria suitable for this study for two reasons. Firstly, except for the popular measure of mean fixation duration, Hvelplund includes a measure of gaze time on screen which allows us to check whether the participants frequently looked down at the tablet to position their pen. Secondly, since the total time that the participants looked at the screen differed, we need the gaze sample to fixation percentage, which does not presuppose the same duration of eye on screen, to judge the quality of eye-tracking data (Hvelplund, Citation2011). Eventually, we excluded datapoints of P4, P15, P33 and P59 who failed to meet (i.e. one SD below the mean) at least two of the three criteria (cf. Hvelplund, Citation2011). In addition, P42 and P53 were discarded as they were unable to use the digital pen with ease. Overall, the percentage of invalid data was 10.91%. The two groups’ working memory capacity was found to be similar (t(47) = −1.612, p > .05, d = 0.48) through a listening span task (Cai et al., Citation2015). All the students passed the Test for English Majors Band 8 with an average score of 71 (SD = 4.88).Footnote4 Besides this, the gender skew (female-dominated) in sampling was not deliberately designed, but it was not expected to exert decisive impacts on the conclusions (Hvelplund, Citation2011).
Table 1. Participant details.
3.2 Material
The stimulus was a talk about classical music in life excerpted from TED.com, a worldwide popular video website. The speech was delivered in plain language and the participants were allowed to study the pre-prepared vocabulary before interpreting without time limits. No concerns about the topic of the speech were raised during the experiments. The talk was divided into four segments, with the two at the beginning and the end being ‘easy’ and the two in the middle being ‘difficult’. This sequence of task difficulty was deliberately designed to avoid possible order effects. The difficulty level of the four segments was firstly assessed through a readability testFootnote5 (indicated by the Flesch Reading Ease score), which measures text complexity through word frequency and sentence length. It was reported in Liu et al. (Citation2004) that interpreters’ performance was undermined as text complexity increased. Then, a propositional density test was conducted (using the CPIDR 5Footnote6 programme) to check information density. After that, we made minor adjustments to the transcripts and videos and ran the tests again. The readability test result showed that Segments 1 and 4 were ‘comparatively easy to understand’, while Segments 2 and 3 were ‘comparatively difficult to understand’. Segments 2 and 3 also had higher propositional densities than Segments 1 and 4 (). Therefore, Segments 2 and 3 were assessed as being more difficult to interpret than Segments 1 and 4.
Table 2. Source speech details.
With videos and transcripts in hand, 10 interpreting trainers and freelance interpreters rated the difficulty level of interpreting the four segments in terms of eight aspects: words, syntactic structure, information density, coherence, logic, clarity, abstractness, and required background knowledge (Cf. Liu & Chiu, Citation2009, p. 248). The results showed that, in every aspect, every ‘difficult’ segment was obviously more difficult to interpret than every ‘easy’ segment. We received the same feedback from the 10 MA students in the pilot study.
3.3 Apparatus
Throughout interpreting, the participants’ eye movements were recorded with a Tobii Pro Fusion-250 eye-tracker, and their pen movements were recorded using a Wacom CTL 672 digital pen and an equipped tablet (). Pen data were extracted through the eye-tracking software of Tobii Pro Lab, since pen movements were regarded as mouse clicks in the software. The whole experiment was recorded by the Audacity 2.4.2 software. All of the devices were connected to a laptop with a 15’’6 screen which could simultaneously show interpreters’ writing on the tablet. The screen presentation was set with two areas: a speaker window for video-playing, and a blank area for note-taking.
Figure 3. Experimental settings.

Different from Chen et al. (Citation2021) who studied on-site CI with interpreters wearing eye-tracking glasses, we focused on VRI where interpreters sit in front of a screen, which is suitable for a desktop-based eye-tracker. However, writing on a tablet with eyes fixating on the screen can cause hand-eye coordination problems. Therefore, we conducted a pilot study with 10 MA students, during which all of them managed to work with this setting and found it easier than blind typing in translation. Likewise, Loch (Citation2005, p. 234) described this setting in his research thus, that ‘I found it did not take long to get used to writing with the pen’. Moreover, the participants expressed that they were used to such human–computer interactions because of the prevalent remote working style during the pandemic. Eventually, we kept this setting in the formal study where only two participants who reported discomfort were excluded from the data.
3.4 Procedures
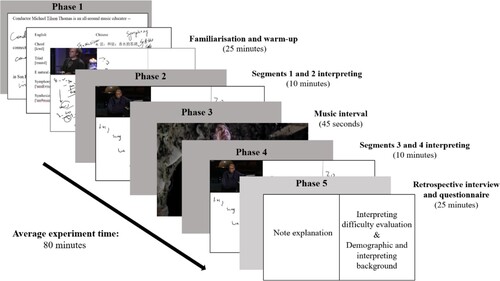
The experimental procedures contain five phases (). In Phase I, the interpreters first used the digital pen to copy the background information of the speech. Then, they were free to write, circle or draw anything they like on the screen for the vocabulary items pre-prepared by the researcher. After a nine-point calibration by sitting approximately 60 cm away from the eye-tracker, they did a one-minute CI warm-up exercise with their eye and pen movements registered. Technical advice was given to the participants where necessary. After a second calibration, the participants interpreted Segments 1 and 2, watched the 45-second music clip from the original talk, and interpreted Segments 3 and 4 (phases II, III and IV). In Phase V, the participants first explained their notes and then completed a NASA-task load questionnaire to rate the difficulty level of interpreting the four segments in terms of four aspects: mental demand, effort, frustration and performance (Appendix) (cf. Sun & Shreve Citation2014). The videos, transcripts, interpreters’ notes and interpretations were provided for task difficulty evaluation. Finally, they finished another questionnaire about their demographic information and interpreting background. The total session lasted roughly 80 min.
Figure 4. Experimental procedure.
3.5 Data analysis
3.5.1 Eye-tracking and pen-tracking data
We drew AOI on each note () rather than on the whole note-taking area, to exclude fixations on the blank space among notes, through which we obtained precise fixation data on the notes. illustrates the adopted indicators.
Table 3. Eye-tracking and pen-tracking measures.
It is worth mentioning that participants who wrote more notes usually had a larger area of notes than those who note less, resulting in a bigger sum of TFD on the notes. Hence, TFD in our study pointed to the total overt visual attention that the interpreters paid to the entire note-taking activity during interpreting. By contrast, MFD which is not affected by the area of notes because of its ‘mean’ attribute was adopted to indicate the average cognitive effort of taking one note.
On pen data, the sum of CC of each note was used to indicate the total physical effort of note-taking. For example, the Chinese vocabulary items ‘演讲’ (‘speech’) and ‘讲话’ (‘speech’) were both counted as one note. However, the former has more strokes and requires more time to write than the latter word ‘讲话’, and this difference could be indicated by CC. Besides this, only 95% of the notes had EPS data because the latter could only be calculated for notes with corresponding source speech units, and extreme values that were ‘three standard deviations below or above the mean (of EPS)’ (Chen, Citation2020b, p. 126) were eliminated. We adopted ‘Time to First Click’ which records the time that the pen tip touched the tablet, to indicate note-taking onsets and the transcribed source speech to decide word onsets. We understood EPS as a strategic move of note-taking rather than an indicator of ‘load’, because a shorter EPS can entail more notes, while a longer EPS leaves more time for listening comprehension.
3.5.2 Interpreting quality assessment
Two experienced interpreter trainers were invited to assess the quality of interpreting, including aspects of ‘information completeness’, ‘fluency of delivery’ and ‘target language quality’ (Han, Citation2018, p. 422). Following Lee (Citation2015), ‘information completeness’ was given a weight of two, while the other two were given a weight of 1. With an intraclass correlation coefficient at a 95% confidence interval, all inter-rater reliability scores were above 0.7 in each aspect of each segment interpretation.
3.5.3 Statistical analysis
Normality was checked for all data using the Shapiro–Wilk test. If the reported two-tailed p value was less than 0.05, then the data were considered non-normally distributed. For between-subject comparisons, we conducted independent t-tests for normally distributed data and Mann–Whitney tests for non-normally distributed data. For within-subject comparisons, we adopted paired t-tests for normally distributed data and the Wilcoxon signed rank tests for non-normally distributed data. A univariate generalized linear model was adopted to test the interaction effects of ‘group’ and ‘difficulty’ on interpreting process and product.
4. Results
4.1 Professional interpreters vs student interpreters
Firstly, with AOIs on the notes, the professional group had significantly higher TFD and CC values than the student group. No significant differences were found in MFD, RVC and EPS ().
Table 4. Eye and pen movements in note areas.
Secondly, the professionals (M = 19.09, SD = 5.05) performed significantly better (t(139.25) = −4.459, p < .001, d = 0.66) than the students (M = 16.11, SD = 3.83) in interpreting.
Thirdly, the two groups reported a similar level of ‘mental demand’ and ‘frustration’ during interpreting (), but the professionals reported significantly more ‘effort’ in task completion and better interpreting ‘performance’ than the students.
Table 5. Mann-Whitney test on NASA-task load results.
4.2 Easy segments vs difficult segments
Firstly, significantly longer TFD and more CC on the note areas were found in the easy segments than in the difficult ones, while the situation is opposite in EPS. MFD and RVC data showed no significant differences ().
Table 6. Eye and pen movements in note areas.
Secondly, the interpreters performed significantly better (t(97) = 4.431, p < .001, d = 0.45) in interpreting the easy segments (M = 18.37, SD = 4.64) than the difficult ones (M = 16.29, SD = 4.34).
Thirdly, in the difficult segments, the interpreters perceived significantly more ‘mental demand’ and ‘frustration’, put in more ‘effort’ and generated worse ‘performance’ in interpreting than in the easy segments ().
Table 7. Wilcoxon signed-rank test results of NASA-task load ratings.
4.3 Interpreter work experience and source speech difficulty
The two groups had similar eye and pen movement patterns in the easy and difficult segments. One exception was that only professionals had significantly longer TFD on notes in the easy segments than in the difficult ones. On interpreting performance, we observed a significant interaction effect between the two independent variables (F(1, 192) = 6.529, p < .05) (). The professionals performed significantly better than the students in the easy segments (t(70.288) = −5.168, p < .001, d = 1.09), but only slightly better in the difficult segments.
Figure 5. Interpreting performance scores.
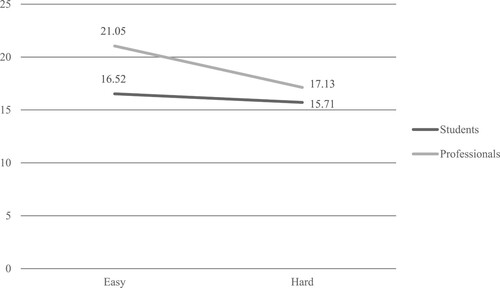
The task-load ratings showed that both groups perceived there to be significantly more difficulty in the difficult segments than in easy segments, but the professionals reported a wider gap between interpreting difficulty and performance than the students ().
Table 8. Wilcoxon signed-rank test results of NASA-task load ratings.
5. Discussion
5.1 Effects of interpreting experience
5.1.1 Overt visual attention and physical effort invested in note-taking
Contrary to our hypothesis, the professionals allocated significantly more overt visual attention and physical effort than the students to completing the note-taking activity during interpreting. A possible reason for that could be the difference in note choices. As presents, the students preferred symbols and abbreviations, whereas the professionals used many language notes and full words. Chen (Citation2020b) has found that, for Chinese-native interpreters, noting in symbols and abbreviations entails less physical demand but higher temporal demand than noting in language and full words. In our study, the students opted for easy-writing note forms and the professionals preferred notes that were time-saving in decision-making. As a result, the students invested less physical effort in note-writing and looked less on the virtual notepad. This is also in accordance with the finding that professionals took more notes (M = 93.61, SD = 27.59) than the students (M = 86.37, SD = 29.45) although the difference was not significant.
Table 9. Mann-Whitney test results on note choices (%).
In addition, we observed the same group difference in the overt visual attention to the whole screen (for professionals: M = 157.58, SD = 16.68, for students: M = 148.65, SD = 23.22; Z = −3.159, p < .01) and the proportions of fixations on notes (professionals: M = 54.33% SD = 11.92%, students: M = 47.91%, SD = 15.51%; t(191.69) = −3.27, p < .01, d = 0.46) during the input phase of CI. Since the two groups had similar working memory capacity and reported a similar amount of mental demand and frustration after interpreting, this professional-novice difference in cognitive resource allocation can suggest two things. Firstly, when facing interpreting difficulties, the professionals would allocate a larger amount of their processing capacity to address the difficulties than the students. Secondly, among the allocated capacity, the professionals would distribute a larger proportion of it to conduct note-taking than the students. The above findings are opposite to those reported by some studies on on-site interpreting (e.g. Chmiel & Lijewska, Citation2019 on sight translation, Stachowiak-Szymczak & Korpal, Citation2019 on simultaneous interpreting, and Hu, Citation2008 on note-taking), where professional interpreters completed interpreting with less effort than student interpreters. One important reason can be the great difference between on-site and remote interpreting. It has been found that remote interpreting is less friendly to interpreters than on-site interpreting, because of its uncomfortable physical environment, poor ergonomics, high stress and burnout (Roziner & Shlesinger, Citation2010). However, professional interpreters could maintain their interpreting quality at a similar level across the two work conditions, even though they themselves judged their performance as significantly poorer in the remote mode (Roziner & Shlesinger, Citation2010). According to Dong and Liu (Citation2016), the cognitive advantage in interpreting is achieved through placing high cognitive demand on interpreters, even more than is needed, to push them to develop corresponding coping strategies. In our study, the professionals had been adjusting themselves to working remotely during the Covid-19 pandemic and faced such real stress from clients and audience more often, whereas the students who attended online classes within a relatively relaxing environment may have not developed coping strategies for remote interpreting. This could be the reason why the professionals were able to allocate more overt visual attention and physical effort to conducting note-taking than the students.
5.1.2 Cognitive effort of note-taking
The finding that the two groups were similar in the cognitive effort of note-taking conflicts with Andres (Citation2002) and Hu (Citation2008). However, Andres (Citation2002) drew her conclusion based on the EPS data, which in our study was not used as an indicator of ‘load’ but as a strategic choice of note-taking. Hu (Citation2008) asked interpreters to complete a secondary task during note-taking, which might misguide the interpreters to focus on secondary-task completion rather than on note-taking. Moreover, neither the earlier studies used source speech with different difficulty levels. Hence, with eye-tracking data obtained in easy and difficult task conditions, we conclude there were no group effects in the cognitive effort of note-taking.
Nonetheless, the professionals were more efficient note-takers in that they adopted more diverse and demanding strategies with the same amount of cognitive effort as the students. We classified the interpreters’ note-taking strategies into ellipsis and non-ellipsis based on Albl-Mikasa (Citation2006). The former is a simple reduction of source speech content with a lower level of language processing, while the latter involves a higher level of language processing for using different lexis to represent the same meaning of a speech unit (such as using ‘he’ to represent ‘dad’ in the source speech) or re-organizing the syntactic structures in the source speech. The results of the present study show that, on average, 7.87% (SD = 0.44%) of the professionals’ notes and 7.29% (SD = 0.57%) of the students’ notes were created through non-ellipsis strategies, although the difference was only close to significance (Z = −1.727, p = 0.084). However, compared with the ellipsis strategy, non-ellipsis strategies are significantly more effortful in applications (MFD at Z = −3.564, p < .001; CC at Z = −3.833, p < .001) and helpful in interpreting quality improvement (Spearman test result: rs(196) = 0.229, p < .01). These results indicate that the professionals could use effortful and effective note-taking strategies more automatically than the students, presenting domain-specific expertise in the utilization of note-taking techniques. Research shows that eight months’ interpreting training is effective in helping students to adopt recommended interpreting strategies (Dong et al., Citation2019). Therefore, flexible note-taking strategies and intensive note-taking practice should be introduced into interpreter training to help students in acquiring note-taking techniques.
5.2 Effects of source speech difficulty
5.2.1 Overt visual attention and physical effort invested in note-taking
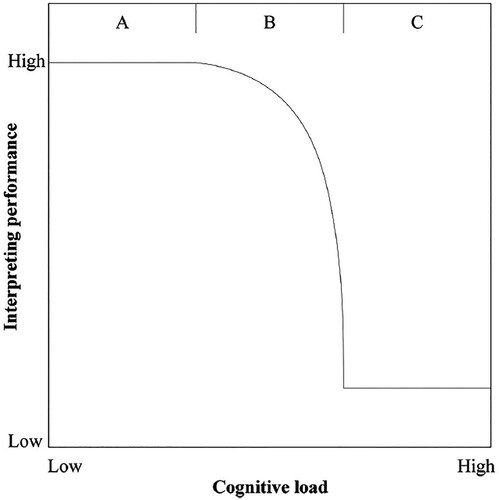
Regardless of interpreting experience, the participants allocated more overt visual attention and physical effort to taking notes for the easy segments than for the difficult ones, resulting in significant differences (Z = −3.854, p < .001) in note quantity (easy: M = 92.86, SD = 29.88, difficult: M = 85.80, SD = 27.47) and interpreting quality. The same effects of difficulty were found when we compared the two groups’ fixations on the whole screen (Z = −7.294, p < .001). These results could be attributed to the possible cognitive overload of interpreting in the difficult segments. In that situation, increasing invested effort would not help interpreters to enhance interpreting quality (Chen, Citation2017). After conducting a Pearson correlation test between the interpreters’ cognitive effort during the input phase of CI (MFD on the screen) and their interpreting scores, we found a negative correlation (Rho = −0.226, p < .05) between the two in the difficult segments but no significant correlation in the easy ones. This result confirms that the interpreters experienced cognitive overload while receiving the difficult segments as more effort devotion linked with undermined interpreting quality (Phase B in ). For the same reason, the participants decreased their use of symbols (t(97) = 3.047, p < .01, d = 0.31) in the difficult segments (M = 32.00%, SD = 11.78%) than in the easy ones (M = 34.30%, SD = 11.91%), as retrieving or improvising symbols entails significantly heavier temporal demand than noting in language (Chen, Citation2020b). These findings suggest that interpreters’ poor performance in VRI could trace back to the note-taking process where cognitive resources are inadequate to conduct listening comprehension, video watching and note-taking at the same time.
Figure 6. The relationship between the cognitive load of interpreting and interpreting performance. This figure is taken from Chen (Citation2017, p. 650).
An interesting finding is that the professionals assessed the easy segments more easily and the difficult segments with more difficulty than did the students. Compared to the student group, the professional group also showed a wider gap in their interpreting quality between the easy segments and the difficult ones, no matter in the self-assessed or rater-assessed types of interpreting performance. This is in accordance with previous research which has shown that higher-level interpreters are more sensitive to the change of task difficulty in interpreting than lower-level interpreters. For instance, Hu (Citation2008) found that professional interpreters’ cognitive effort of note-taking significantly increased when they dealt with the lexical and syntactic structures that they were not familiar with than those they were familiar with, while that of student interpreters did not increase to a statistically significant level. Cardoen (Citation2018) found that, although professional interpreters outperformed advanced and novice student interpreters in an easy CI task, they performed worse than the advanced group in a difficult one. Taken together, these findings indicate that, even for professional interpreters, there is a certain limit of cognitive processing and their interpreting quality is undermined when cognitive overload happens.
5.2.2. Cognitive effort of note-taking
No effects of source speech difficulty were found in the cognitive effort of note-taking. This matches with the note-taking products which were dominated by the effort-saving ellipsis strategy both in easy (M = 85.80%, SD = 7.03%) and difficult segments (M = 87.62%, SD = 6.70%). In addition, no significant differences were observed in the proportions of note form and note language (except for symbols). This inflexibility of note-taking approach can provide some empirical evidence for Gile’s (Citation2001) Tightrope Hypothesis, which has not yet been tested in CI studies. Gile (Citation2001, p. 9) claims that, during the input phase of CI, ‘any increase in processing capacity requirements linked to source-speech features … is likely to lead to saturation-based errors’. Since strategy shifting might increase the cognitive load of interpreters who are already working close to saturation with source speech at variant difficulty levels, they choose to stay ‘safe’ with the simple ellipsis strategy.
In contrast to the eye-tracking data, EPS was significantly longer in the difficult segments than in the easy ones. This is in accordance with the word frequency effect (Hulme et al., Citation1997), that people need more time to process lower-frequency words (in the difficult segments) than higher-frequency words (in the easy segments). Previous studies confirm that intensive interpreting training can help interpreters to decrease EPS (Hu, Citation2008) and there is a negative correlation between EPS and CI performance (Chen, Citation2020b). Taken together, EPS is affected by source speech difficulty, can be reduced through note-taking training, and exerts impacts on interpreting performance.
6. Conclusion
This study has comprehensively explored the effects of source speech difficulty and interpreter work experience on interpreters’ note-taking behaviour in VRI. Both groups made more effort to do note-taking and took less time to make note-taking decisions in the easy segments than in the difficult ones. However, the professionals allocated more overt visual attention and physical effort to completing note-taking than the student interpreters. They were also more efficient than the students in that they achieved higher interpreting quality with a similar amount of cognitive effort in note-taking.
We acknowledge the differences between our experimental settings and the actual practice of VRI, which could bring some impacts on our research findings. For instance, the video was placed in the left upper corner of the screen with a small size and the notepad was integrated on the speaker’s screen. Future studies can try to present the video on full screen and adopt a Livescribe pen which is equipped with a built-in camera and a microphone to film the writing scenes on the paper, record the voice of the interpreter, and upload the recorded videos to computers for further pen-movement analysis. Although this setting would not allow the desktop-based eye-tracker to collect interpreters’ eye movements on the paper, it can still show how frequently interpreters refer to the screen during VRI and reveal some switch patterns between the screen and the notepad. Besides this, as we only investigated English-Chinese CI with Chinese native interpreters using only one text type, research is needed to examine the observed effects in the other interpreting direction and for other text types.
Disclosure statement
No potential conflict of interest was reported by the author(s).
Additional information
Funding
Notes on contributors
Huolingxiao Kuang
Miss Huolingxiao Kuang is a PhD candidate (with CSC scholarship) at the School of Modern Languages and Cultures, Durham University. She obtained her MA in Translation and Interpreting from Peking University in 2018, and has been working as a freelancer interpreter for eight years. Her research interests include interpreting process research and note-taking in consecutive interpreting. Two of her recent research papers will appear as book chapters published by Cambridge University Press and Routledge.
Binghan Zheng
Dr Binghan Zheng is Associate Professor of Translation Studies at Durham University, where he serves as the Director of the Centre for Intercultural Mediation. His research interests include cognitive translation and interpreting studies, neuroscience of translation, and comparative translation and interpreting studies. His recent publications appeared in journals such as Target, Across Languages & Cultures, Journal of Pragmatics, Brain & Cognition, Perspectives, LANS-TTS, Babel, Translation & Interpreting Studies, Foreign Language Teaching & Research, and Journal of Foreign Languages.
Notes
1 We follow Reif (Citation2008) to use ‘cognitive load’ to represent the input load of the task and ‘cognitive effort’ to indicate the operator load of the task performer.
2 Papers based on the same research project are not counted repeatedly. For example, Chen (Citation2020a) and Chen (Citation2020b) are counted only once because they report on the different aspects of one note-taking study.
3 Students in the master’s program of Translation and Interpreting in China mainly follow a two-year plan, with the first year completing class training and the second year working on internships in translation and interpreting.
4 There are four bands in TEM8: ‘excellent’ (score between 80 and 100), ‘good’ (score between 70 and 79), ‘pass’ (score between 60 and 69) and ‘failed’ (score lower than 60).
5 The readability indices include the Automated Readability Index (ARI), the Flesch-Kincaid index, the Coleman-Liau index, the Gunning Fog index, the SMOG index, the Flesch Reading Ease Score index, and LIX. Details can be retrieved from https://www.webfx.com/tools/read-able/.
6 More information about this program can be found in http://ai1.ai.uga.edu/caspr/.
References
- Abuín González, M. (2012). The language of consecutive interpreters’ notes. Interpreting. International Journal of Research and Practice in Interpreting, 14(1), 55–72. https://doi.org/10.1075/intp.14.1.03abu
- AIIC. (2020). “AIIC Interpreter Checklist: Performing Remote Interpreting Assignments from Home in Extremis During the Covid-19 Pandemic.” AIIC. Updated 24 June, 2021. https://aiic.ch/wp-content/uploads/2020/05/aiic-interpreter-checklist.pdf
- Albl-Mikasa, M. (2006). Reduction and expansion in notation texts. In C. Heine, K. Schubert, & H. Gerzymisch-Arbogast (Eds.), Text and translation: Theory and methodology of translation (pp. 195–214). Narr.
- Andres, D. (2002). Konsekutivdolmetschen Und notation [Consecutive interpreting and notetaking]. Peter Lang.
- Braun, S., & Taylor, J. (2012). Videoconference and remote interpreting in criminal proceedings. Intersentia.
- Cai, R., Dong, Y., Zhao, N., & Lin, J. (2015). Factors contributing to individual differences in the development of consecutive interpreting competence for beginner student interpreters. The Interpreter and Translator Trainer, 9(1), 104–120. https://doi.org/10.1080/1750399X.2015.1016279
- Cardoen, H. (2018). Efficient note-taking in consecutive interpreting. Qualitative notes as a polymorph tool [Doctoral dissertation]. University of Mons.
- Chen, S. (2017). The construct of cognitive load in interpreting and its measurement. Perspectives, 25(4), 640–657. https://doi.org/10.1080/0907676X.2016.1278026
- Chen, S. (2020a). The impact of directionality on the process and product in consecutive interpreting between Chinese and English: Evidence from Pen recording and Eye tracking. The Journal of Specialised Translation, 34, 100–117.
- Chen, S. (2020b). The process of note-taking in consecutive interpreting. Interpreting. International Journal of Research and Practice in Interpreting, 22(1), 117–139. https://doi.org/10.1075/intp.00036.che
- Chen, S. (2021). The process and product of note-taking and consecutive interpreting: Empirical data from professionals and students. Perspectives, 1–17, https://doi.org/10.1080/0907676x.2021.1909626
- Chen, S., Kruger, J.-L., & Doherty, S. (2021). Reading patterns and cognitive processing in an eye-tracking study of note-reading in consecutive interpreting. Interpreting. International Journal of Research and Practice in Interpreting, 23(1), 76–102. https://doi.org/10.1075/intp.00050.che
- Chmiel, A., & Lijewska, A. (2019). Syntactic processing in sight translation by professional and trainee interpreters: Professionals are more time-efficient while trainees view the source text less. Target. International Journal of Translation Studies, 31(3), 378–397. https://doi.org/10.1075/target.18091.chm
- Cui, Y., & Zheng, B. (2021). Consultation behaviour with online resources in English-Chinese translation: An Eye-tracking, screen-recording and retrospective study. Perspectives, 29(5), 740–760. https://doi.org/10.1080/0907676X.2020.1760899
- Dai, W., & Xu, H. (2007). 汉英交替传译过程中译员笔记特征实证研究——以职业受训译员和非职业译员为例 [An empirical study of the features of interpreters’ notes in Chinese-English consecutive interpreting: The examples of professionally trained and unprofessional interpreters]. Foreign Language Teaching and Research, 39(2), 136–144.
- Dam, H. V. (2004). Interpreters’ notes: On the choice of form and language. In G. Hansen, K. Malmkjær, & D. Gile (Eds.), Claims, changes and challenges in Translation studies (pp. 251–261). John Benjamins.
- Dong, Y., Li, Y., & Zhao, N. (2019). Acquisition of interpreting strategies by student interpreters. The Interpreter and Translator Trainer, 13(4), 408–425. https://doi.org/10.1080/1750399X.2019.1617653
- Dong, Y., & Liu, Y. (2016). Classes in translating and interpreting produce differential gains in switching and updating. Frontiers in Psychology, 7, https://doi.org/10.3389/fpsyg.2016.01297
- European Commission. (2020). “European Language Industry Survey.” European Commission. Updated 24 June, 2021. https://ec.europa.eu/info/sites/default/files/2020_language_industry_survey_report.pdf
- Foulin, Jean-Noël. 1995. “Pauses et Debits: Les Indicateurs Temporels de la Production Écrite [Pauses and Fluency: Chronometrics Indices of Writing Production].” L'année Psychologique 95(3): 483–504. https://doi.org/10.3406/psy.1995.28844
- Gao, B. (2019). 英汉交替传译笔记中的语言选择发展规律—基于口译学习者的横向研究 [evolvement of the choice of note language in English-Chinese consecutive interpreting—A cross-sectional study on interpreting learners]. Chinese Translators Journal, 40(1), 83–90.
- Gile, D. (2001). Consecutive vs. Simultaneous: Which is more accurate. Interpretation Studies, 1(1), 8–20.
- Gile, D. (2009). Basic concepts and models for interpreter and translator training. Amsterdam: John Benjamins.
- Gillies, A. (2017). Note-Taking for Consecutive interpreting. A short course. London and New York: Routledge.
- Han, C. (2019). A generalizability theory study of optimal measurement design for a summative assessment of English/Chinese consecutive interpreting. Language Testing, 36(3), 419–438. https://doi.org/10.1177/0265532218809396
- Hu, L. (2008). 交替传译中笔记的心理语言学研究 [Note-taking in Consecutive interpreting: A psycholinguistic perspective] [Doctoral dissertation]. Shanghai International Studies University.
- Hulme, C., Roodenrys, S., Schweickert, R., Brown, G. D. A., Martin, S., & Stuart, G. (1997). Word-frequency effects on short-term memory tasks: Evidence for a redintegration process in immediate serial recall. Journal of Experimental Psychology, 23(5), 1217–1232.
- Hvelplund, K. T. (2011). Allocation of cognitive resources in translation: An eye-tracking and key-logging study [Doctoral dissertation]. Copenhagen Business School.
- Hvelplund, K. T. (2019). Digital resources in the translation process – attention, cognitive effort and processing flow. Perspectives, 27(4), 510–524. https://doi.org/10.1080/0907676X.2019.1575883
- Jakobsen, A. L., & Jensen, K. T. H. (2008). Eye movement behaviour across four different types of reading task. In A. L. Jakobsen, S. Göpferich, & I. M. Mees (Eds.), Looking at eyes eye-tracking studies of reading and translation processing (pp. 103–124). Samfundslitteratur.
- Ko, L., & Chen, N.-S. (2011). Online-interpreting in synchronous cyber classrooms. Babel. Revue Internationale de la Traduction / International Journal of Translation, 57(2), 123–143. https://doi.org/10.1075/babel.57.2.01ko
- Lee, S.-B. (2015). Developing an analytic scale for assessing undergraduate students’ consecutive interpreting performances. Interpreting. International Journal of Research and Practice in Interpreting, 17(2), 226–254. https://doi.org/10.1075/intp.17.2.04lee
- Liu, M., & Chiu, Y.-H. (2009). Assessing source material difficulty for consecutive interpreting: Quantifiable measures and holistic judgment. Interpreting. International Journal of Research and Practice in Interpreting, 11(2), 244–266. https://doi.org/10.1075/intp.11.2.07liu
- Liu, M., Schallert, D. L., & Carroll, P. J. (2004). Working memory and expertise in simultaneous interpreting. Interpreting. International Journal of Research and Practice in Interpreting, 6(1), 19–42. https://doi.org/10.1075/intp.6.1.04liu
- Loch, B. I. (2005). Tablet technology in first year calculus and linear algebra teaching. Kingfisher delta ‘05: 5th southern hemisphere Conference on Undergraduate mathematics and statistics teaching and learning, Fraser Island, Australia, 22-26 November 2005, 231-237. http://eprints.usq.edu.au/archive/000000185
- Napier, J., Skinner, R., & Braun, S. (2018). Here or there. Research on interpreting via video link. Gallaudet University Press.
- Pollatsek, A., & Rayner, K. (1990). Eye movements and lexical access in reading. In D. A. Balota, G. B. Flores d'Arcais, & K. Rayner (Eds.), Comprehension processes in reading (pp. 143–164). Erlbaum.
- Reif, F. (2008). Applying cognitive Science to education. The MIT Press.
- Roziner, I., & Shlesinger, M. (2010). Much Ado about something remote: Stress and performance in remote interpreting. Interpreting. International Journal of Research and Practice in Interpreting, 12(2), 214–247. https://doi.org/10.1075/intp.12.2.05roz
- Stachowiak-Szymczak, K., & Korpal, P. (2019). Interpreting accuracy and visual processing of numbers in professional and student interpreters: An Eye-tracking study. Across Languages and Cultures, 20(2), 235–251. https://doi.org/10.1556/084.2019.20.2.5
- Sun, S., & Shreve, G. M. (2014). Measuring translation difficulty. Target. International Journal of Translation Studies, 26(1), 98–127. doi:10.1075/target.26.1.04sun
Appendix. NASA Task Load Index for Measuring Translation Difficulty
Mental Demand How mentally demanding was the task?

Effort How hard did you have to work to accomplish your level of performance?

Frustration How insecure, discouraged, irritated, stressed, and annoyed were you?

Performance How successful were you in accomplishing what you were asked to do?
