
Abstract
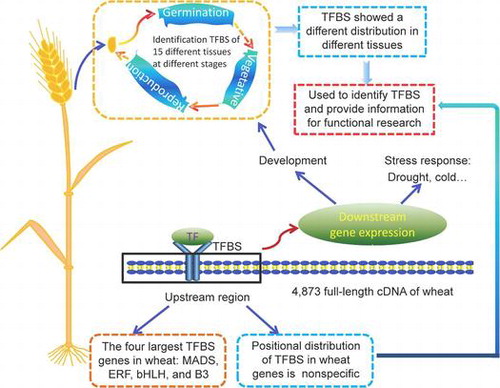
The binding sites of transcription factors (TFs) in upstream DNA regions are called transcription factor binding sites (TFBSs). TFBSs are important elements for regulating gene expression. To date, there have been few studies on the profiles of TFBSs in plants. In total, 4,873 sequences with 5ʹ upstream regions from 8530 wheat fl-cDNA sequences were used to predict TFBSs. We found 4572 TFBSs for the MADS TF family, which was twice as many as for bHLH (1951), B3 (1951), HB superfamily (1914), ERF (1820), and AP2/ERF (1725) TFs, and was approximately four times higher than the remaining TFBS types. The percentage of TFBSs and TF members showed a distinct distribution in different tissues. Overall, the distribution of TFBSs in the upstream regions of wheat fl-cDNA sequences had significant difference. Meanwhile, high frequencies of some types of TFBSs were found in specific regions in the upstream sequences. Both TFs and fl-cDNA with TFBSs predicted in the same tissues exhibited specific distribution preferences for regulating gene expression. The tissue-specific analysis of TFs and fl-cDNA with TFBSs provides useful information for functional research, and can be used to identify relationships between tissue-specific TFs and fl-cDNA with TFBSs. Moreover, the positional distribution of TFBSs indicates that some types of wheat TFBS have different positional distribution preferences in the upstream regions of genes.
Graphical abstract
Identification and positional distribution analysis of transcription factor binding sites for genes from the wheat fl-cDNA sequences
Common wheat (Triticum aestivum L.) is one of the most important crops, accounting for ~20% of the calories consumed by humans worldwide.Citation1) To meet the demands of an increasing global population, many methods have been explored to improve wheat output and grain quality, such as molecular breeding and genomic selection.Citation1–3) Wheat is widely cultivated in various climates and soil environments. During their lifetimes, wheat plants might suffer one or more types of abiotic and biotic stresses, such as fungal infection, drought, and temperature stress. Therefore, studies on gene expression and regulation are usually conducted by comparing the expression of a set of genes under normal conditions to reference genes under a stress condition.Citation4–6)
Transcription factors (TFs) activate and regulate the expression of specific downstream genes.Citation7) Each TF has one or several specific sequences called the DNA-binding domain (DBD), which can bind to target DNA sequences of specific downstream genes. TFs can be classified into different families according to their DBDs. Studies of TFs have included two phases; the first phase involved functional research on one or several TFs by experimentation. During this stage, the regulatory mechanisms of various members of different TF families were well studied, such as MYB, bZIP, and WRKY.Citation8–10) The second phase has been genome-wide prediction of the TFs of different families based on HMM profiles. There are currently three wheat TF databases, wDBTF, PlantTFDB, and WheatTFDB, classified by family.Citation11–13) In particular, the WheatTFDB provides developmental stage information and tissue sources for each TF, and includes 1313 developmental stage-specific TF sequences and 1145 tissue-specific TF sequences.
The binding sites (approximately 5 to 12-bp short sequences) of TFs in upstream DNA regions are called transcription factor binding sites (TFBSs). When TFs are anchored at their TFBSs, they activate and regulate various biological processes, such as organ development, tissue differentiation, and abiotic and biotic stress responses.Citation14) Moreover, the numbers of TFBSs can affect the expression of downstream genes. Guo et al. found that the numbers of TaGAMyb binding sites were correlated with the abundance of high-molecular-weight glutenin subunit (HMW-GS) proteins, through binding of the promoters of wheat HMW-GS genes.Citation15) The regulation mechanisms and relationships between TFs and their TFBSs have been experimentally confirmed in many plants.Citation16–19) However, studies on the functions and molecular mechanisms of TFBSs can be time-consuming and labor-intensive if there is no prior information.Citation20) Recently, some TFBS profiles related to plant stress responses have been published in bioinformatics methods articles.Citation14,21) However, a systemic study of wheat TFBSs in silico has not been reported. The recently published survey sequences of the wheat genome enable us to investigate the profiles of different TFBS types. Ordinarily, TFBS prediction is based on position weight matrices (PWMs), which quantitatively score known TFBSs.Citation22) The study of the TFBS positional distribution in upstream DNA regions is one aspect of gene expression and regulation research. In eukaryotes, the distal region of the start codon plays a central role in binding TFs that regulate gene expression.Citation23) Some recent studies have indicated that the proximal region dominates transcriptional regulation in general, or in particular biological contexts, even in mammals.Citation23) To date, there have been only a few systematic studies on the positional distribution of TFBSs. In the present study, we attempted to analyze the positional distribution of TFBSs in wheat based on TFBS prediction. The main objectives of this study were: (i) to analyze the TFBS profiles of wheat full-length cDNAs (fl-cDNA) and the associated tissue information and (ii) to analyze the positional distribution of TFBSs in wheat DNA.
Materials and methods
Transcription factor binding site analysis
The fl-cDNA sequences of wheat were used to analyze their TFBSs. Collectively, 8530 wheat fl-cDNA sequences were obtained from the Triticeae full-length CDS database (TriFLDB, http://trifldb.psc.riken.jp/v3/download.pl).Citation24) The TFBSs from the fl-cDNA sequence analysis pipelines are shown in Fig. The TFBSs of genes are always located upstream of the gene. To determine the upstream regions of the 8530 fl-cDNAs, their positions in the genome were first identified. The BLAST V2.2.18 program was used to search for the genome locations of the 8530 fl-cDNAs against the wheat assembled genome (IWGSC1.0 + popseq.27, downloaded from Ensemble plants; ftp://ftp.ensemblgenomes.org/pub/plants/release-27/fasta/triticum_aestivum/).Citation2) The 100-bp sequences following the transcriptional start site of the 8530 fl-cDNAs were used as input data for BLAST searches (e: 1e-10; m: 8; F: T). The input sequence IDs for BLAST and their transcriptional start site locations are listed in S1 Table. The BLAST output is shown in S1 File. For accurate selection, the subject sequence locations found in the wheat genome were considered fl-cDNA locations if they met the following criteria: (i) the alignment length of the subject sequence was 100 bp, (ii) the identity value was greater than 0.95 (S1 File). Among the 8530 fl-cDNAs, 4873 fl-cDNAs were found in the genome at 7065 locations (S2 Table). We retrieved the upstream regions for these 7065 locations, and their lengths were no longer than 2000 bp. Next, TESS V1.0Citation25) was employed to predict the TFBSs of the 7065 upstream DNA sequences. TESS searched for TFBSs in the DNA sequences using PWMs. The PWMs used in this research were downloaded from the JASPAR CORE database (http://jaspar.genereg.net/html/DOWNLOAD/). Sixty-four non-redundant plant PWMs were downloaded, but only 53 matrices were found in wheat according to the matrix annotations in the JASPAR CORE database. The details of the 53 collected matrices, which were distributed in 14 TF families/superfamilies, are listed in S3 Table. We established a new Dof PWM according to the published wheat Dof TFBS sequence (5′-TGTAAAG-3′),Citation26) based on the method of Wasserman and Sandelin.Citation27) For the 54 PWMs to work with TESS correctly, the matrices needed to be transposed. The TESS analysis (fmt: t; mlo: 12.0) results for the 7065 upstream sequences are deposited in S2 File. According to the TFBS matrices (S3 Table), we classified the TFBS information of the 4873 fl-cDNAs in 7065 upstream sequences from S2 File into 14 groups. The classified TFBS information results are listed in S4 Table. The TFBS information for the 4873 fl-cDNAs organized into 14 TF families was collected and arranged as Table . To evaluate the differences among the average numbers of TFBSs of the 14 types in each fl-cDNA, a one-sample t-test was performed using the IBM SPSS statistics software V21.0 (SPSS Inc., Chicago, IL, USA).
Fig. 1. Schematic description of wheat transcription factors and their binding sites analysis workflow.
Table 1. TFBS features of 4873 fl-cDNA sequences.
RNA-seq data for 15 wheat tissue sequences were used to analyze the expression features of the 4873 fl-cDNAs. To investigate the TFBSs and TF profiles related to grain development, we used seven RNA-seq data-sets from grain cells at crucial developmental stages. The tissue and developmental stage information for the 15 RNA-seq data-sets is listed in S5 Table, such as germinated seeds, roots, and starchy endosperm at 30 days post anthesis (DPA). First, Tophat V2.0.14 was employed to align the 15 RNA-seq reads to the 4873 fl-cDNA sequences.Citation28) Next, the Cufflinks program was used to match these alignments against the 4873 fl-cDNA sequences to assemble the reads into transcripts.Citation28) We used the default parameters of Tophat and Cufflinks to assemble the transcript files. There were 15 assembled transcript files. The tissue-related features of the 4873 fl-cDNAs in the 15 wheat tissues are shown in S6 File. Furthermore, we integrated the TFBS information of the 4873 fl-cDNA sequences in S4 Table with the tissue-related features in S6 Table. The integrated tissue and TFBS results of the 4873 fl-cDNA sequences are shown in S7 Table. Table shows the number of fl-cDNAs with detected TFBSs in different tissues. To investigate the distribution of the TFBSs of the 4873 fl-cDNAs in different tissues, we calculated their percentages in each tissue. We used the fl-cDNA numbers from Table and divided by the number of fl-cDNAs found in Table . For example, for fl-cDNA with AP2 TFBSs identified in roots we used 863 from Table and divided by 1240 in Table . The resulting value was the percentage of fl-cDNA with AP2 TFBSs identified in root tissue. Fig. shows the percentages for fl-cDNA with different TFBSs expressed in the 15 tissues.
Table 2. The number of fl-cDNA sequences with different TFBS expressed indifferent tissues.
Fig. 2. Percentage of fl-cDNA with different TFBS types expressed in 15 wheat tissues.
Tissue information in wheat TF sequences
The tissue information of the TF sequences for the 14 families mentioned above was also analyzed. The original EST sequences of the 14 TF families were downloaded from WheatTFDB (http://xms.sicau.edu.cn/wheatTFDB/). In all, there were 1226 EST sequences distributed among the other 14 TF families. Initially, the transcript files of the 1226 EST sequences in the 15 RNA-seq data-sets were obtained by the same method as the 4873 fl-cDNA sequences. Tissue information for the 1226 sequences was retrieved from the 15 transcript files, and is shown in S8 Table. However, the 1226 TF sequences from WheatTFDB showed expression information for six tissues and six different developmental stages, including leaves, germinated seeds, and roots. Using the expression information for the 1226 TF sequences in WheatTFDB, tissue information for TF members in germinated seeds and roots was added to S8 Table (the added information is marked with a green background). According to the tissue information, the expression information for the 14 TF families in 15 tissues was collected as Table . To explore the TF distribution preferences in different tissues, the percentages of TF members in each tissue were calculated. We used the TF numbers from different tissues in Table divided by the total TF number. Fig. shows the percentages of different TFs distributed in the 15 tissues.
Table 3. The number of TFs from different tissues.
Fig. 3. Percentage of transcription factor (TF) sequences in 15 tissues.
Positional distribution of TFBS
To investigate the positional distribution preferences of the TFBSs, the upstream regions of the fl-cDNAs, from −1 to −2000 bp, were divided into seven distinct regions. The first region was from −1 to −200 bp, and the remaining regions from −201 to −2000 bp were divided into six equal parts. The number of TFBSs distributed in each region was counted, and the total number of different TFBS types was also counted (S2 File). We calculated the ratios of TFBSs in each region by dividing by the total number of distinct TFBSs. Finally, a one-sample t-test was applied to test the difference of TFBS positional distribution in upstream regions of the fl-cDNAs using the IBM SPSS statistics software V21.0 (SPSS Inc., Chicago, IL, USA).
Results
In total, 8530 sequences of wheat fl-cDNAs obtained from TriFLDB were used to characterize the TFBSs for TFs. The BLAST program was employed to identify the locations of the 8530 fl-cDNAs in the wheat genome. There were 4873 fl-cDNAs at 7065 locations in the genomic sequence of the cultivar Chinese Spring (S2 Table). The upstream sequences of the fl-cDNAs at the 7065 locations were used to search for TFBSs using the TESS program. The information for the identified TFBSs of the fl-cDNAs, which were separated into 14 TFBS types, is shown in Table . There are four rows in Table : “Number of PWMs” (positional weight matrix models), “Number of TFBSs,” “Number of fl-cDNAs,” and “Average number of TFBSs in each fl-cDNA.” “Number of PWMs” is the number of PWMs of each TFBS type used in the TESS program (S3 Table). “Number of TFBSs” is the number of different TFBSs predicted in each of the 14 types (S2 Note). “Number of fl-cDNAs” shows the number of fl-cDNA sequences (S4 Table) in which TFBSs were found in the upstream region. The contents of “Number of TFBSs” are sorted in descending order. The TFBS number for the MADS family was 4572, which was the largest among the 14 types of TFBSs. There were twice as many TFBSs for MADS TFs as for bHLH, B3, HB superfamily, ERF, and AP2/ERF TFs, and four times as many as for the remaining eight TF types. Only one PWM was used to predict ERF binding sites, but 1820 TFBSs were found for ERFs. The average number of TFBSs in each fl-cDNA ranged from 1.133 to 1.756 sites. The TCP family showed the largest number of TFBSs in each fl-cDNA. A one-sample t-test was applied to evaluate the differences among the 14 averages; the P-value of the two-tailed test was 1.000 (>0.05).
The numbers and types of TFBSs identified in the upstream sequences of the 4873 fl-cDNAs are shown in Table . The numbers of fl-cDNAs showed large differences among tissues and TFBS types. The four largest TFBS types were MADS, ERF, bHLH, and B3. There were much fewer TFBSs in the fl-cDNA upstream sequences for WRKY, TCP, and BES1 TFs than for the other TFBS types in the 15 wheat tissues. More than 60% of the TFBSs of each type were distributed in roots, shoots, pistils, stamens, and germinated seeds, which was greater than in grain cell types (Fig. ).
The 1226 TF sequences were separated into 14 TF groups and 15 tissue types (Table ). There were no more than 10 TFs of the AP2, BES1, RAV, SBP, and TCP families in any tissue. In particular, there were no TCP TF sequences predicted in the outer pericarp and SE 20 DPA tissues. The MYB superfamily, ERF, bHLH, and WRKY were the four largest families, accounting for 60.93% of the 1226 TFs (Table ). The percentages of TFs from different wheat tissues in the 14 TF families are shown in Fig. The bZIP family was clearly the most common type; more than 60% of bZIP TFs were detected in all tissues (Fig. ). More than 50% of the TFs in the HB and MYB superfamilies were detected in roots, pistils, stamens, and germinated seeds. Moreover, more than 50% of the members of each of the 14 TF families were found in roots, which had the largest number of TFs among all tissues.
The distribution and frequency of each TFBS type in seven regions (−1 to −2000 bp) of the fl-cDNA upstream sequences was determined (Fig. ). All of the P-values for TFBS positional distribution of the fl-cDNAs upstream region were less than 0.05, which used to test the distribution difference of TFBS by one-sample t-test. About 1/3 of the SBP type TFBSs were detected from −201 to −500 bp, and 30% of the BES1 type TFBSs were found within −501 to −800 bp of the upstream region. About half of the HB type TFBSs were detected in the upstream region from −801 to −1400 bp. Additionally, the AP2, WRKY, and TCP types of TFBSs were most common between −1401 and −1700 bp of the fl-cDNA upstream sequences. High frequencies of TFBSs for AP2, ERF, Dof, and MYB TFs were found between −1701 and −2000 bp.
Fig. 4. Positional distribution of wheat transcription factor binding sites (TFBS).
Discussion
Studying the regulation of gene expression by TFs requires elucidation of their TFBS profiles.Citation29) TFBSs are cis-elements that play important roles in the regulation of gene expression in different tissues and at specific developmental stages. The interactions of one or more TFBS types and TFs have been reported for some plants.Citation30–32) In wheat, the number of wheat MYB TFBSs is correlated with the abundance of glutenin in different wheat cultivars.Citation15) In the present study, we predicted the TFBSs in the upstream regions of wheat fl-cDNA sequences using PWMs; the profiles of 14 TFBS types were analyzed with 54 PWMs. The P-value of the two-tailed test was 1.000, indicating that there were no significant differences among the average numbers of TFBSs per fl-cDNA for the 14 TFBS types (Table ). Knowledge of the positional distribution of TFBSs is important to investigate gene expression regulation by TFs. However, the positional distribution of TFBSs has not been widely explored. In wheat, some types of TFBSs exhibit different positional distribution preferences in these upstream regions (Fig. ). Overall, the distribution of TFBSs in the upstream regions of wheat fl-cDNA sequences had significant difference, according to the results of one-sample t-test. Meanwhile, high frequencies of some types of TFBSs were found in specific regions within the upstream sequences.
In this study, it was found that the numbers of TFs and fl-cDNA with TFBSs were different expressed in different tissues (Tables ). The results were consistent with the results in a published wheat TF database.Citation11,12) However, some TFs were not detected in specific tissues. Most TFs were detected in all wheat tissues, except the TCP family in the inner pericarp and SE 20DPA. This may have been because few members of the TCP family are present in WheatTFDB.Citation13) This is in agreement with the published wheat transcription factor databases wDBTF and PlantTFDB; the TF numbers of TCP genes in WheatTFDB, wDBTF, and PlantTFDB are 10, 14, and 14, respectively.Citation11–13)
To elucidate the interaction mechanisms between TFs and their binding sites, it is important to analyze the structure of TFs and TFBSs. The MADS TF family has two subfamilies, the M-type and MIKC families. The key domain of MADS proteins is the serum response factor (SRF).Citation12) Some binding sites for the MADS family have been reported; for example, the CArG box with the sequence CC(AT)6AG and the SRF-binding site with CC[A/T]6GG and CTA[A/T]4TAG.Citation33,34) These binding sites were detected in the 4572 wheat TFBSs for MADS TFs (Table , S2 File). MADS proteins, through interaction with their binding sites, play key roles in regulating various biological processes, especially in floral organ development.Citation33,34) Accordingly, the number of MADS TF genes expressed in pistils and stamens was obviously higher than in other tissues (Table ).
The basic region/leucine zipper motif (bZIP) regulates biotic and abiotic responses by binding to various TFBSs.Citation35) As shown in Table , bZIP proteins were extensively distributed in all tissues and had no distribution preferences. Plant bZIP proteins can recognize the ACGT core in DNA sequences, preferentially the A-box (TACGTA), C-box (GACGTC), and G-box (CACGTG),Citation35) but can also bind to other sites, for example, ((C/T)AAC(T/G)G),Citation36) GTGTC, and GTGTA.Citation37) In this study, we identified 976 TFBSs of bZIP TFs (Table ) in 15 wheat tissues; the core cis-element sequences of bZIP TFs mentioned above are listed in S2 File. Our results implied that the binding sites of wheat bZIP proteins are quite diverse.Citation37)
The AP2 (APETALA2)/ERF family contains three subfamilies, AP2, ethylene responsive factor (ERF), and RAV, which are classified based on the number of AP2/ERF domains.Citation38) In wheat, we detected 1820 binding sites for ERF, 1725 sites for AP2/ERF, and 897 sites for RAV TFs (Table ). The ERF family is one of the largest TF families in wheat (Table ), and regulates a set of genes responsive to biotic and abiotic stresses such as drought, salt, and cold.Citation39) The AP2 subfamily is involved in regulating organ-specific growth and development, such as flower development, ovule development, and the formation of seed size, while RAV subfamily genes induce expression in response to ethylene, brassinosteroids, and biotic and abiotic stresses.Citation40) Wheat ERF subfamily members bind the conserved nucleotide sequences AGCCGCCCitation40) and TACCGACATCitation39) of the GCC-box in the upstream regions of genes. The RAV binding sites CAACA and CACCTG motif can also be found in S2 File.Citation41)
All WRKY proteins have a WRKY domain, which contains a C-terminal zinc finger and the conserved amino acid sequence WRKYGQK at its N-terminus.Citation42) There were 135 WRKY members in WheatTFDB (Table ). We found 300 TFBSs for WRKY TFs in 4873 fl-cDNA sequences (Table ). The core DNA sequence motif recognized by WRKY TFs includes various W-box elements containing a TGAC core sequence.Citation42) The cis-element sequences TTGAC(C/T/A/G) were confirmed in this study (S2 File). WRKY proteins and their TFBSs are associated with responses to different stresses and numerous processes required for diverse plant functions, such as development, embryogenesis, dormancy, and drought tolerance.Citation42)
bHLH TFs contain two different regions, the basic region and the HLH region. The basic region contains 15 amino acids with a high number of basic residues, and is located at the N-terminal end of the domain. The HLH region is located at the C-terminal end, and contains hydrophobic residues that form two amphipathic α-helices separated by a loop region of variable sequence and length.Citation30) bHLH TFs have been reported to function in light-induced hormone signaling, wound and drought stress responses, shoot branching, fruit and flower development, root development, and other pathways.Citation43) Table shows that the numbers of bHLH TFs identified in roots, shoots, pistils, stamens and germinated seeds were greater than in leaves and grains. The distribution of bHLH TFs was in accordance with their published functions.Citation43) The core cis-element bound by bHLH TFs is a consensus hexanucleotide sequence called the E-box (5ʹ-CANNTG-3ʹ).Citation30) Here, 1951 TFBSs were predicted as bHLH type sites in wheat (Table ). The cis-elements with the core sequences (C/T)GCGTG, (C/T)ACGTG, and CACG(A/G)C predicted in the upstream regions of wheat fl-cDNA sequences have been detected in various plants, such as Arabidopsis, rice, and poplar.Citation21,30,43)
TCP proteins can be distinguished by the specific TCP domain. Their binding sites vary; for example, GGNCCCAC, GTGGNCCC, and TGGGCC.Citation19,44) These binding sites are listed in S2 File. We identified 474 binding sites of TCP TFs in wheat (Table ). TCP genes have been reported to affect the development of axillary structures, petals, and stamens.Citation45) The TCP family had few members in wheat, and no TF sequences were detected in the outer pericarp or SE 20DPA (Table ). These results suggest that the main functions of TCP proteins may not affect the development of outer pericarp or SE at 20 DPA.
Plant SBP proteins have been reported to be involved in a variety of important biological processes, including flower and fruit development, architecture formation, responses to copper and fungal toxins, and control of GA levels.Citation46) The SBP domain can combine with the cis-element TNCGTACAA, for which GTAC is the essential core sequence.Citation47) In wheat, 1365 TFBSs were detected in the non-coding regions of fl-cDNAs (Table ), and the cis-element containing TNCGTACAA was confirmed in wheat (S2 File).
MYB proteins comprise one to four imperfect repeats, each of which forms a helix–turn–helix structure of ~50 residues.Citation48) Here, 1114 cis-elements of the MYB superfamily were predicted in wheat (Table ). Some published TFBS sequences were detected with the core sequences TAACTG, CAACTG, AACGG, and C/TAACNA/G.Citation8,49) Wheat MYB TFs have been shown to regulate developmental and physiological processes, especially responses to various biotic and abiotic stresses.Citation48) Moreover, Guo et al. found that MYB TFs play an important role in the regulation of the glutenin gene expression during wheat endosperm development by directly binding to the promoter of TaGLU-1 and by recruiting GCN5 to modulate histone acetylation.Citation15)
The plant B3 superfamily has two subfamilies, ARF and B3, and the B3 domain is the defining domain.Citation12) The B3 family is involved in flowering time control and in organ growth and polarity.Citation49) In this study, we predicted 1951 TFBSs for B3 TFs (Table ). Cis-elements of the B3 superfamily, with core sequences of CATGC, CATGCA, and TGTCTC, were verified in wheat (S2 File). The numbers of B3 members distributed in pistils, stamens, germinated seeds, and roots was greater than in the other tissues (Table ). This seems to be consistent with the reported functions of B3 TFs.Citation49,50)
The BES1 family is a transcription factor family controlled by brassinosteroids (BR) that regulates multiple biological processes, including cell elongation, vasculature differentiation, photomorphogenesis, senescence, and stress responses.Citation51) BES1 transcription factors bind to sites with various core sequences to modulate gene expression; for example, CACGTG and CGTG(T/C)G.Citation51,52) We identified 459 TFBSs in 330 fl-cDNA sequences (Table ). The core sequences of BES1 TFBSs mentioned above were detected in wheat (S2 File).
TFs of the HB superfamily are involved in hormonal pathways, providing a link between gene regulatory networks and signaling in the shoot apical meristem.Citation53) The plant HB superfamily is divided into four subfamilies, HB-other, TALE, HB-PHD, and HD-ZIP, in which the homeobox domain is the defining domain.Citation12) However, no HB-PHD and HD-ZIP sequences were detected in wheat.Citation13) In this study, 1914 TFBSs for HB TFs were predicted in 1220 different fl-cDNA sequences (Table ). Some reported cis-elements with the core sequences CAAT(A/T)ATTG and CAAT(G/C)ATTG were found in wheat (S2 File).Citation54)
Wheat Dof protein previously was isolated from endosperm and suggested to function as an activator of prolamin gene expression during seed development.Citation26) The Dof domain of grass contains Cys2-Cys2 zinc-finger DNA binding proteins.Citation55,56) There were 32 Dof members in WheatTFDB (Table ). The Dof TFs can bind with the cis-element 5′-TGTAAAG-3′ in upstream of gene,Citation26) for which AAAG is the essential core sequence of TFBS.Citation57) In wheat, 924 TFBSs were identified in the upstream regions of fl-cDNAs (Table ), and the cis-element containing 5′-TGTAAAG-3′ was confirmed in wheat (S2 File).
Author contribution
Zhen-Yong Chen participated in the design of this work, carried out the experiment, and wrote the manuscript. Xiao-Jiang Guo, Zhong-Xu Chen, and Wei-Ying Chen participated in the design of this work and contributed to writing the manuscript. Ji-Rui Wang planned the study and designed this work, and wrote the manuscript.
Disclosure statement
No potential conflict of interest was reported by the authors.
Funding
This work was supported by the National Basic Research Program of China [grant number 2014CB147200]; the National Natural Science Foundation of China [grant number 31571654], [grant number 31230053], and [grant number 31171555]; The national key research and development plan of China [grant number 2016YFD0100100]; Research Fund for the Doctoral Program of Higher Education of China [grant number 20135103110008]; and Sichuan Science and Technology Support Project [grant number 2016NZ0103].
Supplemental materials
The supplemental material for this paper is available at http://dx.doi.org/10.1080/09168451.2014.946390.
TBBB_1295803_Supplemental_Data.zip
Download Zip (2.7 MB)Related Research Data
References
- Pfeifer M, Kugler KG, Sandve SR, et al. Genome interplay in the grain transcriptome of hexaploid bread wheat. Science. 2014;345(6194):1250091.10.1126/science.1250091
- The international wheat genome sequencing consortium (IWGSC). A chromosome-based draft sequence of the hexaploid bread wheat (Triticum aestivum) genome. Science. 2014;345(6194):1251788.
- Semenov MA, Halford NG. Halford: identifying target traits and molecular mechanisms for wheat breeding under a changing climate. J Exp Bot. 2009;60(10):2791–2804.10.1093/jxb/erp164
- Saad ASI, Li X, Li HP, et al. A rice stress-responsive NAC gene enhances tolerance of transgenic wheat to drought and salt stresses. Plant Sci. 2013;203–204:33–40.10.1016/j.plantsci.2012.12.016
- Rong W, Qi L, Wang AY, et al. The ERF transcription factor TaERF3 promotes tolerance to salt and drought stresses in wheat. Plant Biotechnol J. 2014;12:468–479.10.1111/pbi.2014.12.issue-4
- Chinnusamy V, Zhu JH, Zhu JK. Cold stress regulation of gene expression in plants. Trends Plant Sci. 2007;12(10):444–451.10.1016/j.tplants.2007.07.002
- Maienschein-Cline M, Dinner AR, Hlavacek WS, et al. Improved predictions of transcription factor binding sites using physicochemical features of DNA. Nucleic Acids Res. 2012;40(22):e175.10.1093/nar/gks771
- Qin YX, Wang MC, Tian YC, et al. Over-expression of TaMYB33 encoding a novel wheat MYB transcription factor increases salt and drought tolerance in Arabidopsis. Mol Biol Rep. 2012;39:7183–7192.10.1007/s11033-012-1550-y
- Kobayashi F, Maeta E, Terashima A, et al. Development of abiotic stress tolerance via bZIP-type transcription factor LIP19 in common wheat. J Exp Bot. 2008;59(4):891–905.10.1093/jxb/ern014
- Machens F, Becker M, Umrath F, et al. Identification of a novel type of WRKY transcription factor binding site in elicitor-responsive cis-sequences from Arabidopsis thaliana. Plant Mol Biol. 2014;84:371–385.10.1007/s11103-013-0136-y
- Romeuf I, Tessier D, Dardevet M, et al. wDBTF: an integrated database resource for studying wheat transcription factor families. BMC Genomics. 2010;11:185.10.1186/1471-2164-11-185
- Jin JP, Zhang H, Kong L, et al. PlantTFDB 3.0: a portal for the functional and evolutionary study of plant transcription factors. Nucl Acids Res. 2014;42(D1):D1182–D1187.10.1093/nar/gkt1016
- Chen ZY, Guo XJ, Chen ZX, et al. Genome-wide characterization of developmental stage- and tissue-specific transcription factors in wheat. BMC Genomics. 2015;16:125.10.1186/s12864-015-1313-y
- Sanchita G, Blessy BM, Sharma A. In silico analysis of putative transcription factor binding sites in differentially expressed genes: study of the turnover of TFBSs under salt stress responsiveness in solanaceae family. Plant Omics J. 2013;6(4):278–285.
- Guo WW, Yang H, Liu YQ, et al. The wheat transcription factor TaGAMyb recruits histone acetyltransferase and activates the expression of a high-molecular-weight glutenin subunit gene. Plant J. 2015;84:347–359.10.1111/tpj.13003
- Shewry PR. Wheat. J Exp Bot. 2009;60:1537–1553.10.1093/jxb/erp058
- Ma XL, Xin ZY, Wang ZQ, et al. Identification and comparative analysis of differentially expressed miRNAs in leaves of two wheat (Triticum aestivum L.) genotypes during dehydration stress. BMC Plant Biol. 2015;15:21.10.1186/s12870-015-0413-9
- Yin LL, Xue HW. The MADS29 transcription factor regulates the degradation of the nucellus and the nucellar projection during rice seed development. Plant Cell. 2012;24:1049–1065.10.1105/tpc.111.094854
- Giraud E, Ng S, Carrie C, et al. TCP transcription factors link the regulation of genes encoding mitochondrial proteins with the circadian clock in Arabidopsis thaliana. Plant Cell. 2010;22:3921–3934.10.1105/tpc.110.074518
- Sandelin A, Wasserman WW, Lenhard B. ConSite: web-based prediction of regulatory elements using cross-species comparison. Nucleic Acids Res. 2004;32:W249–W252.10.1093/nar/gkh372
- Naika M, Shameer K, Mathew OK, et al. STIFDB2: an updated version of plant stress-responsive transcription factor database with additional stress signals, stress-responsive transcription factor binding sites and stress-responsive genes in Arabidopsis and rice. Plant Cell Physiol. 2013;54(2):e8.10.1093/pcp/pcs185
- Mathelier A, Wasserman WW. The next generation of transcription factor binding site prediction. PLOS Comput Biol. 2013;9(9):e1003214.10.1371/journal.pcbi.1003214
- Koudritsky M, Domany E. Positional distribution of human transcription factor binding sites. Nucleic Acids Res. 2008;36(21):6795–6805.10.1093/nar/gkn752
- Mochida K, Yoshida T, Sakurai T, et al. TriFLDB: a database of clustered full-length coding sequences from triticeae with applications to comparative grass genomics. Plant Physiol. 2009;150(3):1135–1146.10.1104/pp.109.138214
- Schug J. Using TESS to predict transcription factor binding sites in DNA sequence. Current Protoc Bioinfo. 2008:2.6.1–2.6.15.
- Dong GQ, Ni ZF, Yao YY, et al. Wheat Dof transcription factor WPBF interacts with TaQM and activates transcription of an alpha-gliadin gene during wheat seed development. Plant Mol Biol. 2007;63:73–84.
- Wasserman WW, Sandelin A. Applied bioinformatics for the identification of regulatory elements. Nature. 2004;5:276–287.
- Trapnell C, Roberts A, Goff L, et al. Differential gene and transcript expression analysis of RNA-seq experiments with TopHat and Cufflinks. Nature Protoc. 2012;7(3):562–578.10.1038/nprot.2012.016
- Niu XP, Guiltinan MJ. DNA binding specificity of the wheat bZIP protein EmBP-1. Nucleic Acids Res. 1994;22(23):4969–4978.10.1093/nar/22.23.4969
- Toledo-Ortiz G, Huq E, Quail PH. The Arabidopsis basic/helix-loop-helix transcription factor family. Plant Cell. 2003;15:1749–1770.10.1105/tpc.013839
- Xie KB, Wu CQ, Xiong LZ. Genomic organization, differential expression, and interaction of SQUAMOSA promoter-binding-like transcription factors and microRNA156 in rice. Plant Physiol. 2006;142:280–293.10.1104/pp.106.084475
- Qin YX, Wang MC, Tian YC, et al. Over-expression of TaMYB33 encoding a novel wheat MYB transcription factor increases salt and drought tolerance in Arabidopsis. Mol Biol Rep. 2012;39:7183–7192.10.1007/s11033-012-1550-y
- West AG, Shore P, Sharrocks AD. DNA binding by MADS-box transcription factors: a molecular mechanism for differential DNA bending. Mol Cell Biol. 1997;17(5):2876–2887.10.1128/MCB.17.5.2876
- Ciannamea S, Kaufmann K, Frau M, et al. Protein interactions of MADS box transcription factors involved in flowering in Lolium perenne. J Exp Bot. 2006;57:3419–3431.10.1093/jxb/erl144
- Jakoby M, Weisshaar B, Dröge-Laser W, et al. bZIP transcription factors in Arabidopsis. Trends Plant Sci. 2002;7(3):106–111.10.1016/S1360-1385(01)02223-3
- Nozawa A, Matsubara Y, Tanaka Y, et al. Construction of a protein library of Arabidopsis transcription factors using a wheat cell-free protein production system and its application for DNA binding analysis. Biosci Biotech Bioch. 2009;73(7):1661–1664.
- Niu XP, Guiltinan MJ. DNA binding specificity of the wheat bZIP protein EmBP-1. Nucleic Acids Res. 1994;22(23):4969–4978.10.1093/nar/22.23.4969
- Nakano T, Fujisawa M, Shima Y, et al. The AP2/ERF transcription factor SlERF52 functions in flower pedicel abscission in tomato. J Exp Bot. 2014;eru154:1–9.
- Pandey B, Sharma P, Saini M, et al. Isolation and characterization of dehydration-responsive element-binding factor 2 (DREB2) from Indian wheat (Triticum aestivum L.) cultivars. Aust J Crop Sci. 2014;8(1):44–54.
- Xu W, Li F, Ling LZ, et al. Genome-wide survey and expression profiles of the AP2/ERF family in castor bean (Ricinus communis L.). BMC Genomics. 2013;14:785.10.1186/1471-2164-14-785
- Song XM, Li Y, Hou XL. Genome-wide analysis of the AP2/ERF transcription factor superfamily in Chinese cabbage (Brassica rapa ssp. pekinensis). BMC Genomics. 2013;14:573.10.1186/1471-2164-14-573
- Kalde M, Barth M, Somssich IE, et al. Members of the Arabidopsis WRKY group III transcription factors are part of different plant defense signaling pathways. Mol Plant Microbe Interact. 2003;16(4):295–305.10.1094/MPMI.2003.16.4.295
- Carretero-Paulet L, Galstyan A, Roig-Villanova I, et al. Genome-wide classification and evolutionary analysis of the bHLH family of transcription factors in Arabidopsis, poplar, rice, moss, and algae. Plant Physiol. 2010;153:1398–1412.10.1104/pp.110.153593
- Schommer C, Bresso EG, Spinelli SV, et al. Role of MicroRNA miR319 in plant development. Berlin: Springer; 2012. p. 29–47.10.1007/978-3-642-27384-1
- Cubas P, Lauter N, Doebley J, et al. The TCP domain: a motif found in proteins regulating plant growth and development. Plant J. 1999;18(2):215–222.10.1046/j.1365-313X.1999.00444.x
- Wang Y, Hu ZL, Yang YX, et al. Function annotation of an SBP-box gene in Arabidopsis based on analysis of co-expression networks and promoters. Int J Mol Sci. 2009;10:116–132.10.3390/ijms10010116
- Wang BN, Geng SF, Wang D, et al. Characterization of squamosa promoter binding protein-LIKE genes in wheat. J Plant Biol. 2015;58:220–229.10.1007/s12374-015-0105-x
- He YN, Li W, Lv J, et al. Ectopic expression of a wheat MYB transcription factor gene, TaMYB73, improves salinity stress tolerance in Arabidopsis thaliana. J Exp Bot. 2011;err389:1–12.
- Xu ZS, Ni ZY, Liu Li, et al. Characterization of the TaAIDFa gene encoding a CRT/DRE-binding factor responsive to drought, high-salt, and cold stress in wheat. Mol Genet Genomics. 2008;280(6):497–508.10.1007/s00438-008-0382-x
- Swaminathan K, Peterson K, Jack T. The plant B3 superfamily. Trends Plant Sci. 2008;13(12):647–655.10.1016/j.tplants.2008.09.006
- Yu XF, Li Lei, Zola J, et al. A brassinosteroid transcriptional network revealed by genome-wide identification of BESI target genes in Arabidopsis thaliana. Plant J. 2011;65:634–646.10.1111/tpj.2011.65.issue-4
- Kovalchuk N, Smith J, Bazanova N, et al. Characterization of the wheat gene encoding a grain-specific lipid transfer protein TdPR61, and promoter activity in wheat, barley and rice. J Exp Bot. 2012;63(5):2025–2040.10.1093/jxb/err409
- Hamant O, Pautot V. Plant development: A TALE story. Comptes rendus Biol. 2010;333(4):371–381.10.1016/j.crvi.2010.01.015
- Chan RL, Gago GM, Palena CM, et al. Homeoboxes in plant development. Biochimica et Biophysica Acta. 1998;1442(1):1–19.10.1016/S0167-4781(98)00119-5
- Lijavetzky D, Carbonero P, Vicente-Carbajosa J. Genome-wide comparative phylogenetic analysis of the rice and Arabidopsis Dof gene families. BMC Evol Biol. 2003;3:17.10.1186/1471-2148-3-17
- Vicente-Carbajosa J, Moose SP, Parsons RL, et al. A maize zinc-finger protein binds the prolamin box in zein gene promoters and interacts with the basic leucine zipper transcriptional activator Opaque2. Plant Biol. 1997;94:7685–7690.
- Yanagisawa S, Schmidt RJ. Diversity and similarity among recognition sequences of Dof transcription factors. Plant J. 1999;17(2):209–214.10.1046/j.1365-313X.1999.00363.x