
Abstract
Inducing electrical properties in thermoplastic materials and enhancing their mechanical properties with the addition of nanofiller in Fused Filament Fabrication (FFF) is the main purpose of the study. Multiwall carbon nanotubes (MWCNT) at different weight percentage (wt.%) loadings (0.1%, 0.5%, 1.0%, 2.5%, 5.0%, 10.0%) were incorporated into the Polyamide 12 (PA12) matrix. Melt mixing followed by filament extrusion was applied. Filaments were employed to 3D print specimens. A thorough study on the electrically Conductive Polymeric Composites (CPCs) electrical percolation threshold was carried out. Mechanical and thermomechanical response investigations were also conducted. Scanning Electron Microscopy (SEM) was employed to study the morphology of the 3D printed samples. The results showed a mechanical and thermomechanical properties enhancement for 5.0 wt.% filler’s ratio. The electrical conductivity increased by increasing the filler loading. The 10% wt.% PA12/MWCNT nanocomposite additionally exhibited an electrothermal Joule-heating behavior. The antibacterial behavior was also tested with the agar well diffusion screening method, for gram-negative Escherichia coli (E. coli) and gram-positive Staphylococcus aureus (S. aureus). A mild antimicrobial performance was observed. It can be concluded that the multi-functional PA12/MWCNT 3D printed lightweight CPCs developed herein could be applied in various applications, e.g. joule-heating devices, flexible conductors, and anti-static enclosures.
1 Introduction
Additive Manufacturing (AM) is a popular manufacturing technology nowadays [Citation1], exploited in a wide range of diverse fields, with a variety of different technologies (Fused Filament Fabrication, Stereolithography, Selective Laser Sintering, etc.) available. All of them have a common operating principle of a layer-by-layer manufacturing process. AM technologies have shown a radical development in the academic and the industrial sector during the last twenty (20) years [Citation2]. A large variety of applications have been implemented, ranging from automotive to medical devices. Additionally, last year’s problems due to the pandemic emerged some of the important advantages of 3D printing, which is a subsector of AM technologies. Its ability to manufacture regionally [Citation3], minimizing carriage charges and delivery times, and allowance of manufacturing geometries of high complexity, are driving AM on a very promising path [Citation4].
Fused Filament Fabrication (FFF) technology is one of the most prominent among the AM technologies [Citation5]. In FFF, polymers are extruded in a melted state through a nozzle in a layer sequential way [Citation6]. The mechanical response of the stock materials in FFF has been thoroughly studied in the literature [Citation7–9], while a wide variety of composites have been developed over the previous years to be utilized in FFF 3D printing. Polymer materials have been enhanced mainly with nanoparticles or nanofibers for improving the mechanical performance [Citation10], flexibility [Citation11], antimicrobial properties [Citation12,Citation13], electrical conductivity [Citation14], and magnetic properties [Citation15]. Enhancing polymers’ properties is crucial for widening the applications FFF can be introduced. In this work, the enhancement of Polyamide 12 (PA12) with the introduction of Multiwall Carbon Nanotubes (MWCNT) nanoparticles at various concentrations for FFF usage is reported. The current work is extending the polymer’s research by developing multi-functional nanocomposites with improved mechanical, thermal, electrical, and antibacterial properties in FFF, which have great potential, due to the great interest and popularity of this specific AM technology nowadays.
Polyamide 12 (PA12) is an engineering polymer widely known for its high fracture resistance [Citation16], flexibility, impact strength, and high strain performance [Citation17]. Even though it is a well-known polymer, literature related to the FFF technology is limited, with research mainly focusing on powder bed AM technologies [Citation18], such as Multi-Jet Fusion (MJF) and Selective Laser Sintering (SLS) [Citation19,Citation20]. Recent studies on PA12 have also shown potential in FFF implementations for a sustainable ecosystem [Citation21], while it was depicted that its mechanical properties could characterize it suitable as an engineering-grade material. No similar nanocomposites have been presented and studied in literature so far for FFF applications. Still, polyamides have been employed for composites development with various types of fillers, in fiber or other forms, for dental [Citation22–26] and electrospinning applications [Citation27–31].
For the enhancement of Polyamides mechanical response in FFF 3D printing, various types of fillers (organic and inorganic) were used in nano or macro scale or fiber form [Citation32–38]. Such materials are suitable for various types of applications [Citation33]. In most cases, only the tensile and flexural tests were performed on the composites or the nanocomposites, while in the current work several tests were conducted for the characterization of the mechanical performance of the prepared nanocomposites. In the literature, the reported improvement was about 15% in the tensile strength in most cases, while the enhancement was higher regarding the tensile and the flexural modulus of elasticity [Citation32,Citation38]. Carbon-based additives have been used in various forms as reinforcements in Polyamides, inducing other types of properties as well in the matrix material, such as electrical conductivity [Citation39–41]. Polyamide-based commercial filaments for FFF 3D printing are available in the market, such as the PA6-GF30 (XSTRAND), with superior mechanical properties [Citation42]. Such filaments are suitable for applications requiring an enhanced mechanical response, with their specification being impressive in this area (tensile strength 102 MPa, tensile modulus of elasticity 7400MPa, according to the materials datasheet), still, they do not exhibit a multi-functional character, providing electrical or other properties at the same time.
Carbon nanotubes (CNTs) are commonly used nanomaterials, employed as fillers in polymer matrices, for the enhancement of their mechanical [Citation43], electrical [Citation44], and thermal conductivity properties [Citation45]. They are produced by graphite sheets with a hexagonal pattern of carbon atoms. Their properties are affected by their structure and the organization of the atoms in them. CNTs have high-quality mechanical and electrical properties, while, when used as a filler in polymers, their small size and accumulation drive them to frizz and twist and finally transfuse properties to the composite material. CNTs have also exhibited an adequate antimicrobial performance. Research has been conducted on the ability to either terminate or reduce the growth of bacteria. According to [Citation46] over three hundred (300) references were introduced over the last fifteen (15) years, reporting such properties of CNTs in various types of applications. Narayan et al. [Citation47] reported that MWCNT in f-MWCNTs films prevents the growth of Staphylococcus sp. Another research [Citation48] reported that f-MWCNTs membranes could exterminate over 98% of gram-negative E. coli and gram-positive S. aureus bacteria. This is achieved by the physical contact between the nanomaterials and bacteria, which destroys the membrane, the disabling of cellular components, and in the end the death of bacteria [Citation49]. Overall, carbon-based composites are very popular for their antibacterial performance, and for this reason, carbon in various forms (carbon nanotubes, graphene, and others) is widely used as an additive mainly in medical applications requiring such properties [Citation50–54]. In FFF 3S printing, there are commercial filaments available, such as the Copper3D’s PLActive. This filament is using different matrix material and different antibacterial agent in the additive, to achieve such performance when compared with the materials prepared in the current study. Such materials are focusing on the antibacterial properties and lack the multi-functional performance of the materials of the current study [Citation55].
Filler’s ability to regulate the conductive behavior of the composite material according to the loading ratio has potential for the development of Conductive Polymer Composites (CPCs) in a wide range of applications [Citation56–58]. CPC materials have been developed for various sensor applications (gas, liquid, chemical, electromechanical, wearable strain sensitive sensors, and temperature sensors) [Citation59–61]. There are also studied and presented in the literature for electromagnetic shielding, Joule heating, and other similar applications [Citation62–65]. Carbon-based fillers are used to induce electrical properties in polyamides in various forms, such as graphite, graphene, and multi-walled carbon nanotubes, for the development of CPCs, and have been reported in the literature in a wider field of applications and not just in 3D printing [Citation41,Citation66–72]. In FFF 3D printed commercial filaments have been presented in the literature, such as the carbon-based Proto-Pasta, or the Electrifi, which has a metallic filler. Such filaments have been used for electrical applications, in microchips and space applications, but their mechanical and antibacterial response are not studied in the literature, since their applications do not require such specifications [Citation72–77].
Multi-wall carbon nanotubes (MWCNTs) have been thoroughly studied for such cases. Florian Machui [Citation78] produced CPCs with a similar fabrication method to this study, employing Polypropylene (PP) as a matrix material and MWCNTs as filler in a ratio of 3.0 wt.%, while Czaniková et al. [Citation14] have achieved a conductivity of 1.10–4 S/cm with a filler ratio of 1.6 wt.%. Research from Kulkarni et al. [Citation79] and Doagou-Rad et al. [Citation43] showed that Polyamide 6 (PA6) as matrix material and MWCNTs as filler with 4.0 wt.% and 5.0 wt.%, respectively, achieve a conductivity of 10–3 S/cm. Using PA12 as a matrix material with MWCNTs as nanofiller for the development of nanocomposites is not reported in the literature for the FFF technology, while there is no research so far studying the conductivity percolation threshold, the mechanical response, and the thermomechanical performance, regardless of the nanocomposites’ preparation method.
In the current study, the potential for multi-functional nanocomposites with PA12 as the matrix material and MWCNTs as the filler, exploiting the FFF 3D printing advantages, was investigated. Nanomaterials with their high surface to volume ratio and their ability to induce multi-functional performance as fillers to nanocomposites [Citation80] are combined with the advantages of 3D printing, such as less post-processing, ease to manufacture complex geometries, minimum wastage of materials, among others [Citation81,Citation82]. Nanocomposite materials were fabricated in various weight-to-weight concentrations to evaluate the effect of the filler loading on the nanocomposites’ performance. Nanocomposite materials were fabricated in filament form with a thermomechanical melt mixing process. Then, with the produced filament, specimens were fabricated with the FFF 3D printing process, according to international standards, to be tested for the characterization of the nanocomposites. More specifically nanocomposites were prepared with filler’s loading of 0.1%, 0.5%, 1.0%, 2.5%, 5.0% and 10.0% per weight. A thorough study was carried out for the mechanical, thermal, and electrical conductivity behavior of the nanocomposites. Finally, a screening process for determining the antimicrobial performance of 3D printed specimens was conducted. Results of the current study showed potential in PA12 MWCNTs nanocomposite materials in AM applications, as the developed materials showed multi-functional performance, with enhanced properties in all the tests conducted (mechanical, electrical, electrothermal, and antimicrobial). Such materials can be exploited in medical or other applications requiring such advanced specifications and multi-functional character from the materials used.
2 Experimental section
2.1. Materials
Polyamide 12 (PA12) was chosen as the matrix material for the current study. PA12 was procured from Arkema (Colombes, France) in fine granules form. The commercial grade of this PA12 is Rilsamid PA12 AESNO TL. According to the manufacturer’s technical data sheet, some of the fundamental properties of this PA12 grade are the density of 1.01 g/cm3 (ISO 1183), melt volume-flow (MVR) of 8.0 cm3/10 min (ISO 1133) at 235°C/5.0 kg, Vicat softening temperature of 142°C (ISO 306/B50) and melting temperature of 180°C (ISO 11357–3). Rilsamid AESNO TL is not a homopolymer, as it contains heat, lubrication, and UV stabilizers, according to the supplier’s specifications. MWCNTs were used as the filler material for the purposes of the current study. MWCNTs were acquired by Nanocyl S.A. (Sambreville, Belgium), and their commercially known type was NC7000. These MWCNTs have an average diameter of 9.5 nm, while their average length is 1.5 μm, according to the supplier’s specifications. The purity of the material is 90%, while the remaining 10% is metal oxide according to the supplier’s datasheet. Its surface area is 250–300 m2/gr, its bulk density is 60 gr/L, is tensile modulus 1000GPa, and the elongation at break 10%. It is a category 1 respiratory and skin sensitization and category 2 in the carcinogen parameter.
2.2. Specimens’ fabrication method
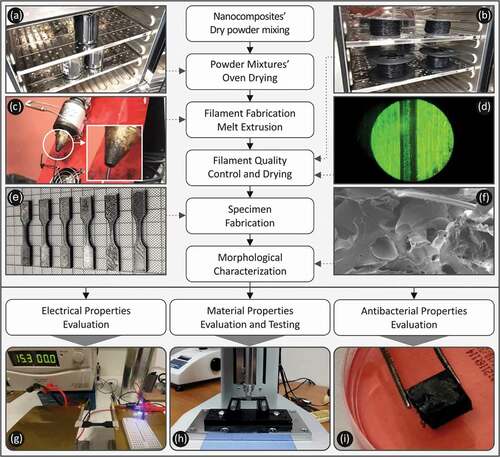
All specimens prepared for the tests conducted during the current study were fabricated with the same processes’ parameters, which are described below. Before starting the mixing process of the nanocomposites, a drying process was implemented for 24 h at 80°C to the matrix material (PA12). Mechanical high shear mixing was performed in a closed chamber to minimize any mass losses of the nanocomposite materials. A drying process was again followed and then the material was fed into a Noztek single screw extruder (Noztek Shoreham-by-Sea, England) for first melt mixing. The produced filament was shredded in a 3devo laboratory shredder (3D Evo B.V., Utrecht, The Netherlands) and the pellets were then fed again to a second extruder, equipped with a specially shaped screw, suitable for materials’ mixing, according to the extruder’s manufacturer. The extruder used was a 3Devo Composer 450 extruder (3D Evo B.V., Utrecht, The Netherlands), which has a screw with geometry specially designed for materials and nano additives mixing, according to the manufacturer and it produced the final filament used for 3D printing of the samples in this work. Composer 450 is additionally equipped with four (4) different heating zones and a built-in winding system, which is automatically adjusted by the real-time filament’s diameter measurements taken throughout the extrusion process. Extrusion temperatures were set to 210°C at heating zone 1 (closer to the nozzle), 220°C at heating zones 2 and 3, and 185°C at heating zone 4 (closer to hopper). The screw’s rotational speed was adjusted at 8.5 rpm (extruders rpm ratio is 2.5–15 rpm) while built-in fans were set at 50%. Settings were kept constant throughout the nanocomposites’ fabrication process, in 1.75 mm (±0.09) diameter filament form, suitable for 3D printing. PA12/MWCNTs nanocomposite filaments followed a drying process as well for 4 h at 80°C before they are used as raw material for the specimens’ fabrication process. summarizes the processes of this work (preparation of the nanocomposites, testing, and characterization), which are described in detail further below.
Figure 1. Short presentation of the workflow followed during the study, showing the typical test setup and the preparation of the 3D printed specimens. (Α) Typical compound drying process, (B) typical filament drying setup, (C) filament during the extrusion process, (D) filament on the microscope for quality inspection, (E) 3D printed specimens, (F) SEM image, (G) typical setup of the electrical conductivity closed circuit evaluation, (H) typical setup of the bending test, (I) 3D printed specimen positioned in the petri dish for the antibacterial test.
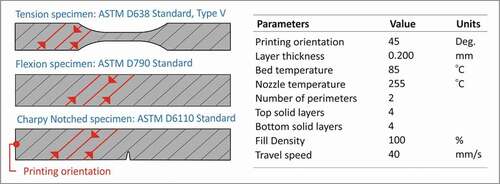
Additive Manufacturing was selected for specimens’ fabrication. More specifically, Fused Filament Fabrication (FFF) technology was utilized using a Craftbot Plus (Craftbot ltd, Budapest Hungary) 3D printer. The 3D printer’s hot end used was an all-metal one, while the nozzle’s diameter was 0.4 mm. shows the settings of the 3D printing process followed for all the specimens’ fabrication. All 3D printer parameters that are not presented here were set to pre-fixed values of the Craftware slicing software, which was used for the preparation of the files required by the 3D printer for the 3D printing process. To reduce the warping effect during the manufacturing of the specimens, a glass bed with masking tape (3 M 101+) was utilized, while nozzle’s fans were turned off during the manufacturing process. The G code for the manufacturing of the parts in the 3D printer was formed with the use of the 3D printer’s software. The required 3D printing parameters were incorporated in the G code file. This specific 3D printer employed in the work is a fully open access machine, that allows multiple control of the 3D printing parameters and not just pre-set settings for each case (material used, etc.). These parameters were experimentally determined by the authors before the manufacturing of the parts for the current study. All specimens were 3D printed with a 45-degree angle orientation since several different types of mechanical tests were conducted and this orientation was selected, as it exhibits the lower possible anisotropy in the 3D printed specimens [Citation83].
Figure 2. 3D printing parameters and direction of 3D printing patterns followed during the AM processing of specimens of pure PA12 and its nanocomposites during the current study.
2.3. Mechanical properties test methods
Tensile tests were conducted in each different nanocomposite prepared in the study, to five (5) specimens, according to the ASTM D638-02a international standard. All specimens tested were 3.2 mm thickness, type V specimens. An Imada MX2 (Imada Inc, Northbrook, Illinois, United States) apparatus was utilized for the tensile tests. The elongation speed was set to 10 mm/min. Room conditions were preserved during the tests, with 22°C temperature and 50% RH.
Flexural tests were also conducted in the same apparatus by replacing the tensile grips with a three-point bending module. Flexural tests were conducted according to the ASTM D790-10 international standard. Five (5) specimens of 3.2 mm thickness were tested for each nanocomposite material fabricated. Flexural speed was set to 10 mm/min, while during the test the environmental conditions were as referred above.
Charpy’s Impact tests were also conducted according to the ASTM D6110-04 international standard. Specimens of 80 mm length, 10 mm width, and 8 mm height were fabricated according to the standard, using the same parameters as before. A Terco MT220 Charpy test machine (Terco AB, Kungens Kurva, Sweden) was utilized for the impact test process. For each nanocomposite material, a total of five (5) specimens were tested, adjusting the release height at 367 mm. Tests were conducted in room conditions as before. Finally, Vickers microhardness measurements were carried out at specimens of all fabricated materials. Specimens were thoroughly prepared using polishing techniques to acquire a smooth test surface. Five (5) randomly selected specimens were tested for each material fabricated for the current study. The apparatus used during the test was an Innova Test 300-Vickers (Innovatest Europe B.V., Maastricht, The Netherlands).
2.4. Spectroscopic and morphological characterization methods
Neat PA12 and PA12/MWCNTs nanocomposites were thoroughly investigated through the Raman spectroscopy technique. A Labram HR-Horiba (Kyoto, Japan) micro-Raman system was utilized for this purpose, using samples acquired from the 3D printed specimens. Back-scattering Raman activity recording and excitation light delivery were carried out using an optical microscope equipped with a 50x long working distance. An Ar+ ion laser line (514.5 nm) at 1.5 mW power at the focal place was utilized for the Raman excitation. Various noises, i.e. the fluorescent background had caused a tilted baseline variation, this variation has been removed using a baseline correction through subtraction of a linear polynomial fit.
The morphological characteristics of the specimens were studied with Scanning Electron Microscopy (SEM). SEM images were captured in a JEOL JSM 6362LV (Jeol Ltd, Norwood, Massachusetts, United States) electron microscope in high vacuum mode at 20kV acceleration voltage on sputtered gold-coated samples. Images were taken on both the external side and the fracture area of tensile specimens at two (2) different magnifications each time.
Finally, thermogravimetric analysis (TGA) was performed in the specimens using a TG/DTA Pyris Diamond (Perkin Elmer, Waltham, Massachusetts, United States) machine. The analysis was conducted in a specimen taken from the 3D printed parts (approximately 10 mg weight) in a temperature range of 40°C to 550°C with a temperature ramp of 10°C/min. During the TGA measurement, processing nitrous (N2) gas was supplied under a flow of 200 ml/min.
2.5. Dynamic mechanical analysis test method
TA Instruments DMA850 (New Castle, Delaware, United States) was utilized for Dynamic Mechanical Analysis (DMA) in the 3D printed specimens. DMA specimens’ dimensions were 60 mm length, 15 mm width, and 3.2 mm thickness. Before testing, all specimens were thoroughly dried at 35°C for 48 h. DMA testing procedure consisted of a temperature ramp from 25°C to 130°C at a rate of 3°C/min. A 3-point bending fixture was used, while a preload of 0.1 N was applied.
The displacement applied to the samples had a sinusoidal pattern. Its amplitude was kept constant at 30 μm, and the oscillating frequency was set at 1.0 Hz. Data logging had a frequency of 0.33 Hz. Storage modulus, loss modulus, tan δ, temperature, time, and oscillation angular frequency were recorded and/or calculated throughout the test procedure.
2.6. Electrical conductivity test method and electrothermal Joule-heating investigations
Determination of the electrical conductivity was performed under a through-thickness (through-layer), as well as in-plane (cross-layer) tests. Prismatic specimens of square shape, with 100 mm2 surface and 3.2 mm thickness were manufactured through FFF technology. The silver paste was applied to the necessary surfaces for contacting, and electrical resistance measurements were taken with a 2-point probe. An Agilent Multimeter (Agilent 34401A6-1/2-, Agilent, Santa Clara, United States) was utilized for the measurements. Infrared thermography (IR-T) images were captured, to elucidate the electrothermal Joule-heating behavior. A Seek Thermal Compact PRO Compact XR Imaging Camera IR Infrared Imager (Santa Barbara, California, United States), operating to a thermal range of −40°C to 330°C, was employed.
2.7. Antibacterial test method
The antibacterial performance of the prepared nanomaterials of this work was tested against two bacteria, i.e. gram-positive Staphylococcus aureus (S. aureus) and gram-negative Escherichia coli (E. coli). The agar well diffusion model [Citation84] was employed. Tests were conducted in a typical microbiological laboratory. All the hardware used in the tests was sterilized before its use in the tests, on an autoclave at 121°C/1.5 atm for 20 min. Petri dishes were of 850 mm diameter and appropriate bacterium for each culture were imported in them (MC.2, C.010066 for the gram-negative E. coli and Chapman, C.010068 for gram-positive S. aureus). 3D printed specimens of prismatic geometry with dimensions of 12,4x12,4 mm and a height of 3.2 mm were fabricated and inserted in the center of each petri dish. Each petri dish included one specimen during the culture growth. Petri dishes were placed in an oven, where a constant temperature of 37°C was kept for 24 h. The inhibition growth zone was measured through optical equipment, after the 24 h process.
3 Results
3.1. Mechanical properties results
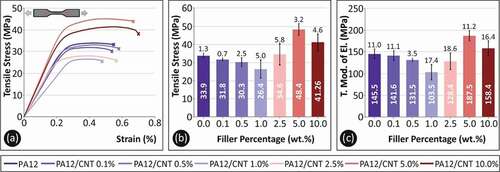
Tensile tests were conducted according to the ASTM D638-02a international standard. In tensile test results are shown. shows a representative stress (MPa) curve to strain (mm/mm) for each tested material. shows the average tensile stress at break (MPa) for each tested material to filler’s loading at each composite and the corresponding deviation. shows the average calculated tensile modulus of elasticity (MPa) to filler’s loading for each tested material and the corresponding deviation. Results showed that filler’s ratio of 5.0 wt.% had an increase of approximately 43% in the tensile strength and ~29% in the tensile modulus of elasticity when compared to the pure PA12 properties. 0.1 wt.% to 1.0 wt.% showed insignificant differences in the tensile behavior when compared to neat PA12 ones. A threshold to filler’s loading was observed at PA12/MWCNTs 2.5 wt.% since a slight increase was determined when compared to lower filler’s loadings and pure PA12.
Figure 3. (A) representative stress (MPa) to strain (mm/mm) curve of each tested material, (B)tensile stress at break (MPa) to filler loading (%) average values and deviation, (C) tensile modulus of elasticity (MPa) to filler loading (%) average values and deviation.
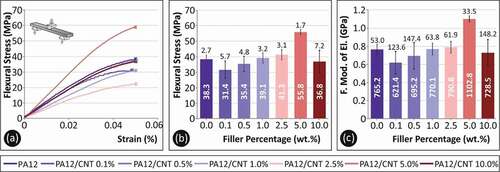
Flexural test results are shown in . Same as in , a representative flexural stress curve (MPa) to strain (mm/mm) is shown in . It should be mentioned that the test was stopped at 5.0% strain, according to the ASTM D790-10 standard instructions, as no break occurred for all tested specimens and materials. show the average maximum flexural stress at 5.0% strain and the average calculated flexural modulus of elasticity to filler’s ratio and their respective deviations. A similar to the tensile behavior of the specimens were observed in the flexural tests. PA12/MWCNTs 5.0 wt.% shows a rather remarkable increase in the flexural strength while no significant changes were observed for filler’s loading at 2.5%. The maximum flexural stress exhibits a raise of approximately 46% and the flexural modulus of elasticity of about 44% for PA12/MWCNTs 5.0 wt.% when compared to pure PA12. Both tensile and flexural properties show a sharp deterioration when MWCNTs ratio increases to 10 wt.%.
Figure 4. (A) Representative flexural stress (MPa) curve to strain (mm/mm) of each tested material, (B) flexural stress (MPa) at 5% strain to filler loading (%) average values and deviation, (C) flexural modulus of elasticity (MPa) to filler loading (%) average values and deviation.
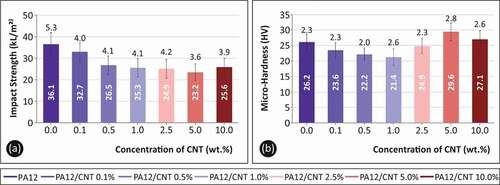
Impact strength and Vickers microhardness results are shown in . illustrates the average impact strength (kJ/m2) to filler’s ratio and its deviation, while in the corresponding Vickers microhardness (HV) results are presented. Impact strength exhibits a deteriorating trend as filler’s concentration increases in the nanocomposite materials. Specifically, the maximum decrease in the impact strength was observed in 5 wt.% MWCNTs concentration. Impact strength’s values are calculated to be approximately 30% lower when compared to pure PA12. Filler’s loading has no significant effect on the Vickers microhardness of the nanocomposites. A no remarkable increase in the Vickers microhardness of approximately 13% is observed at PA12/MWCNTs 5.0 wt.%.
Figure 5. (A) Impact strength (kJ/m2) to filler loading (%) average values and deviation, (B) Vickers Microhardness (HV) to filler loading (%) average values and deviation.
3.2. Raman spectra and morphological results
shows the Raman spectra of MWCNTs, PA12, and the PA12/MWCNT nanocomposite at 2.5% filler loading, all in the 300–3300 cm−1 spectral region. The D- and G-bands of MWCNTs can be observed, characteristic of CNT graphitic carbon allotrope materials [Citation85], centered at ca. 1338 cm−1 and 1572 cm−1, respectively. Moreover, the radial breathing mode (RBM) peaks typically found at ca. 100–300 cm−1 were absent, indicating that the CNTs in this study were of multi-walled (MWCNTs) type rather than single-wall carbon nanotubes (SWCNTs); being in good agreement with the supplier’s datasheet. Specifically, in the MWCNT spectrum, two distinct spectral regions can be observed: one at 1000 and 2000 cm−1 and the second one between 2300 and 3000 cm−1. The first one is governed by two broad bands, namely the G-band (G stands for ‘graphitic’) between 1500 and 1600 cm−1, and the D-band (D stands for ‘defects’ or disorder) at 1300–1400 cm−1, which results from a disorder-induced double resonant process due to the breakdown of the usual wave vector selection rule (A1g symmetry) [Citation86–89].
Figure 6. Raman Spectra of MWCNT, PA12 and PA12/MWCNTs nanocomposite (at 2.5% filler loading) at the spectral region of 300–3300 cm−1.
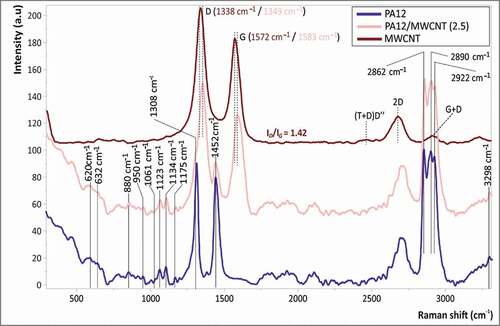
In the second-order region, three main bands between 2300 cm−1 and 3000 cm−1 could be observed, i.e. the (T + D)D′′ (2450 cm−1), 2D (2675 cm−1) and the G + D (2900 cm−1), which are assigned to overtones and combinations of the bands arising from the first-order region. The graphitization and degree of crystallinity of carbon nano allotropes have been several times correlated to the relative intensity ratio of the corresponding D and G-bands (ID/IG) [Citation86]. Specifically, the D and G band intensity ratio (ID/IG) for the MWCNTs in this work was 1.42. As it can be seen in the PA12/MWCNT spectrum (), there are characteristic peaks attributed to the PA12 matrix, as well as the graphitic fingerprints of MWCNTs. It is worth mentioning that the Raman spectra of PA12/MWCNT nanocomposites at higher filler loadings were governed by the carbon nano additive ‘characteristic’ spectroscopic responses that are highly resonant to the 532 nm laser excitation source used in this study, without any visible peaks arising from the PA12 polymeric matrix. Specifically the PA12 peaks are the bands at 611 cm−1 (N-H out-of-plane bending), 633 cm−1 (defined to Amide IV (d CO)), 715 cm−1 (CH2 rocking), 880 cm−1 (CH2 rocking), 953 cm−1 (C-CO stretch), 1061 cm−1 (C-C stretch), 1083 cm−1 (C-C stretch), 1112 cm−1 (C-C stretch), 1134 cm−1 (C-C stretch), several primary peaks at around 950–1200 cm−1 (CH2 stretching mode), 2850 cm−1 (CH2 symmetric. stretching), 2907 cm−1 (CH2 symmetric. stretching), 2922 cm−1 (CH2 asymmetric. stretching) and 3298 cm−1 (N-H stretch), corroborating the Raman spectroscopic responses of PA12 as reported elsewhere [Citation1].
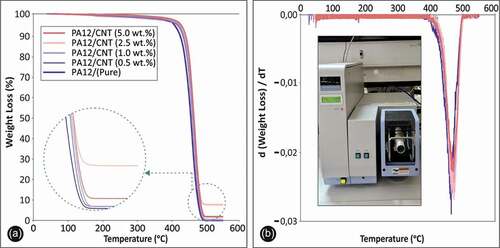
In TGA results are presented for the nanocomposite materials of this study. A thermal enhancement is shown under the effect of MWCNTs’ existence in the nanocomposite materials when compared to neat PA12. shows the weight loss (%) to temperature (oC) for all tested materials. shows, respectively, the rate of the weight loss change to temperature change. The effect of filler’s ratio in the thermal behavior is shown in this curve, as a decrease in the weight loss rate, when the MWCNTs ratio increases. According to the TGA results, the filler’s ratio in the nanocomposite material was verified. As it is shown in the zoomed area of , the remaining material after the steep weight-loss is approximately the weight ratio of the filler at each nanocomposite material. This is a qualitative estimation showing a well macro-dispersion of the MWCNTs in the polymer matrix.
Figure 7. Thermogravimetric analysis (A) weight loss (%) to temperature (oC), (B) calculated rate of weight loss to temperature (oC).
shows SEM images from the side of the 3D printed tensile test specimens for 0.5 wt.% ()), 1.0 wt.% ()), 2.5 wt.% ()), and 5.0 wt.% ()) filler’s ratio. Images show the side of specimens in two (2) different magnifications of x30 and x150, respectively. With the increase of the filler’s ratio in the matrix material, aggregates are getting more intense in the specimens. Morphology and consistency of the layer height and the interlayer fusion show a rather well behavior even when intense agglomeration exists in higher MWCNTs percentages.
Figure 8. Side area of representative tensile test specimens in magnification of ×30 and ×150 as follows (A) and (B) pure PA12, (C) and (D) PA12/MWCNTs 2.5 wt.%, (E) and (F) PA12/MWCNTs 5.0 wt.%, (G) and (H) PA12/MWCNTs 10.0 wt.%.
shows SEM images from the fractured areas of tensile test specimens in two (2) different magnifications of x30 and x1000. Through these captures, a porous cross-sectional area is shown, with this effect getting more intense when the MWCNTs ratio increases. The morphological analysis performed through the SEM images showed that some slight aggregates are visible, and although MWCNTs aggregates exist, the mechanical behavior is not significantly affected. This behavior may be attributed due to the micro-dispersion of the MWCNTs in the nanocomposites, while nano-dispersion needs further investigations to be determined.
Figure 9. Fracture area of representative tensile test specimens in magnification of ×30 and ×1000 as follows (A) and (B) pure PA12, (C) and (D) PA12/MWCNTs 2.5 wt.%, (E) and (F) PA12/MWCNTs 5.0 wt.%, (G) and (H) PA12/MWCNTs 10.0 wt.%.
3.3. DMA results
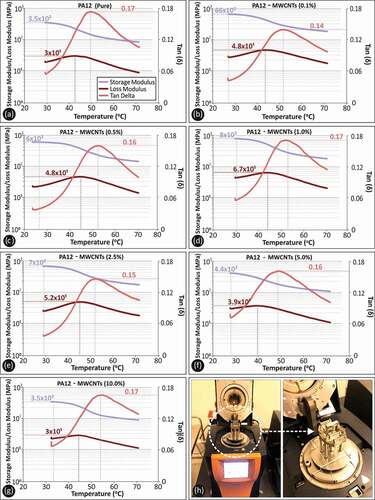
illustrates results extracted through the DMA analysis. Storage Modulus (E’, MPa), Loss Modulus (E”, MPa), and tan δ to temperature (oC) are shown for all tested materials of the study. Storage Modulus tends to increase when compared to neat PA12 until the 5 wt.% filler ratio which is probably a threshold for the specific nanocomposites. The same tendency is exhibited to the Loss Modulus, too. Tan delta is rather not affected regarding its peak values, while peak temperatures exhibit a slight increase. The highest storage modulus and loss modulus was measured at PA12 MWCNTs 1.0 wt.%. The trend of higher tan delta peak values in increased temperatures could exhibit an enhanced mechanical behavior to higher temperatures, compared to neat PA12 thermomechanical behavior. This thermomechanical enhancement could even reveal a higher engineering grade, as the increase of the temperature above the Vicat softening temperature of approximately 50–55°C does not have a steep effect on storage and loss modulus decreasing trend to temperature raise. This could achieve some ‘fail-safe’ mechanism to applications in which thermomechanical stresses are applied.
Figure 10. Storage Modulus (MPa), Loss Modulus (MPa), Tan (delta) to temperature (oC) for all tested materials as follows (A) Pure PA12, (B) PA12/MWCNTs 0.1 wt.%, (C) PA12/MWCNTs 0.5 wt.%, (D) PA12/MWCNTs 1.0 wt.%, (E) PA12/MWCNTs 2.5 wt.%, (F) PA12/MWCNTs 5.0 wt.%, (G) PA12/MWCNTs 10.0 wt.%, (H) Typical setup of the conducted DMA test.
3.4. Electrical conductivity results
In , electrical conductivity test results are illustrated. shows schematically the 2-point probe measurements in correspondence to the AM fabricated specimen. As previously mentioned, measurements were conducted in two different directions, since the manufacturing method (AM) could cause anisotropic electrical behavior to the specimen. shows the electrical conductivity values of PA12/MWCNTs nanocomposite materials in filler’s ratio of 2.5 wt.%, 5.0 wt.% and 10.0 wt.%. It is shown that filler’s ratio in the nanocomposite material has a clear effect on the electrical conductivity enhancement, while lower filler ratios exhibit a typical ‘conductor’ performance, as the electrical conductivity is measured higher than the electrical percolation threshold. Different measurements, as was expected, are shown when comparing the ‘3D printing’ direction (through direction) to the cross-sectional one. This anisotropy was expected since the 3D printing method creates a stronger fusion through the ‘3D printing’ direction against the interlayer and inter ‘strings’ fusion. Cross-sectional conductivity is still exhibiting a conductive performance. illustrates a curve of electrical conductivity to MWCNTs ratio. An increase of MWCNTs above approximately 6.0 wt.% is clearly shown that decrease the rate of the electrical conductivity effect. It could be mentioned that 5.0 wt.% of MWCNTs is the threshold point of acquiring the best electrical conductivity behavior, while at the same time, the processing of the material and its mechanical performance are still not significantly affected by the filler’s existence in the nanocomposite.
Figure 11. (A) Schematic presentation of probe points of the electrical conductivity measurements conducted on 3D printed specimens, (B) electrical conductivity (S/m) to filler loading (%) for both directions measured, (C) electrical conductivity (S/m) to filler loading (%) and a fitted curve, (D) typical Joule heating effect setup (left) and IR-T image captured after 30 sec, (E) typical setup of LED closed circuit test.
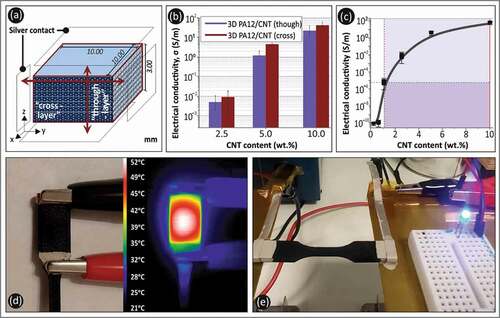
In the thermoelectrical performance of the highest measured electrical conductivity nanocomposite (PA12/MWCNTs 10.0 wt.%) is shown. A DC voltage was applied, using a conventional DC power supply of 15 V. Infrared thermography capture was taken after an applied voltage duration of 30 s. The peak temperature measured was approximately 52°C (below Vicat softening temp). This electrothermal phenomenon is referred to as the ‘Joule Heating’ [Citation89] and it describes the rise of temperature of the conductive material when a voltage difference (known as a voltage bias) is applied. Enough applications are based on this phenomenon exist. This test exhibits the potential of using polymeric conductive materials for thermoelectrical applications.
shows the operation of a LED lamp, while current is passing through the PA12/MWCNTs 10.0 wt.% specimen in a closed circuit of 15 V voltage bias. Through these experimental procedures, a potential of lightweight polymeric-based conductors is shown to applications of flexible circuits, wearable sensors, and/or any other thermoelectrical application that cannot be manufactured utilizing conventional manufacturing methods. Such applications reveal the utilization of Additive Manufacturing to even more advanced applications requiring multifunctional material’s behavior of not only mechanical but also thermoelectrical performance.
3.5. Antibacterial performance results
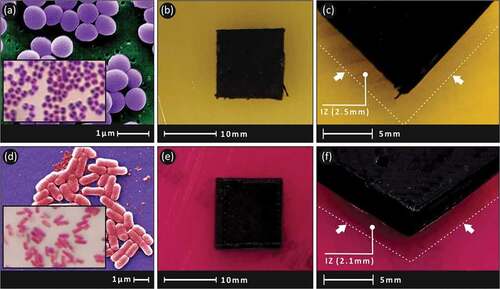
exhibits a clear view of the bacteria culture growth after 24 h. ) shows the typical morphology of the gram-negative E. coli and gram-positive S. aureus bacteria respectively. In the developed inhibition zone (IZ) of the 3D printed PA12/MWCNTs 10.0 wt.% nanocomposite specimen inside the petri dish with gram-positive S. aureus culture is shown. This inhibition zone was measured to be approximately 2.5 mm wide. In , the same material specimen is shown in gram-negative E. coli culture after 24 h. In this case, the inhibition zone was measured to be approximately 2.1 mm wide. In both cases, a mild antibacterial performance was observed. It should be mentioned that the agar well diffusion method followed in the current study is a screening method, exposing the nanocomposite materials in a severe bacteria environment. Lower filler’s loading nanocomposite materials exhibited non-measurable or no-inhibition zones. A potential of antibacterial performance still exists for PA12/MWCNTs nanocomposites at the concentrations tested in this work.
Figure 12. (A) Typical morphology of S. aureus (B) top view of S. aureus inhibition zone around 3D printed specimen of PA12/MWCNTs 10.0 wt.% (C) Closer view of same 3D Printed specimen (D) typical morphology of E. coli (E) top view of E. coli inhibition zone around 3D printed specimen of PA12/MWCNTs 10.0 wt.% (F) Closer view of same 3D printed specimen.
4 Discussion
4.1. Mechanical properties
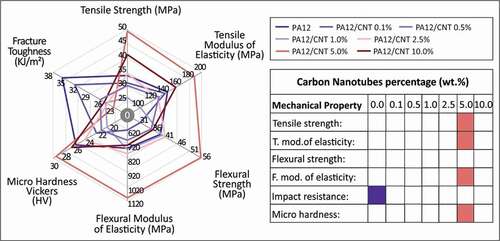
Mechanical tests of tensile, flexural, and Charpy-notched impact were conducted to determine the effect of MWCNTs filler loading in the PA12 polymer matrix. Additionally, Vickers microhardness measurements enhanced the overview of the filler’s effect in the mechanical response. In the overall results from the mechanical tests are shown. It is clear through the diagrams shown that MWCNTs enhance the tensile and the flexural strength of the matrix material. Maximum values for the tensile and the flexural strength were both observed at 5.0 wt.% filler’s ratio. This MWCNTs percentage seems to be a threshold for the nanocomposite since in higher filler loading (10.0 wt.%) the performance of the nanocomposite decreases.
Figure 13. Summary of the mechanical properties results along with a colored table, indicating the highest values measured of all tested materials.
The impact strength of the nanocomposites fabricated in the study was inferior to the neat PA12, which could be attributed to the increased nanomaterials stiffness, which has a negative effect on Charpy’s impact test. This can be attributed to the lower strain to yield ratio in the nanocomposite materials when compared to PA12 ones. Regarding the nanocomposites’ microhardness performance, the introduction of MWCNTs seems to have almost no effect when compared to the neat material. A further increase in the MWCNTs percentage in the nanocomposites could plausibly positively affect the microhardness, but higher filler concentrations would make the nanocomposite difficult to process in additive manufacturing applications.
4.2. Spectra and morphological properties
Raman Spectra, SEM captures of the side and the fractured area of the tensile specimens, and TGA analysis were conducted to morphologically analyze the nanocomposites fabricated in the study. Specimens’ images highlighted minor aggregates in the micro-scale, which had no negative effect on the mechanical properties, that overall showed a clear enhancement. This could be attributed to the good interface of the MWCNTs with the PA12 polymer. It can be concluded from the resulting mechanical properties of the fabricated nanocomposites, that the melt mixing process followed in this study, achieved a fair dispersion of the nano additive, at least in the micro-scale. Further studies are required to optimize such processes and to achieve and ensure nano-scale dispersion of the nanofiller materials. This could further increase the mechanical, thermal, and other properties performance in even lower nano additive loading ratios. MWCNTs dispersion in the micro-scale was also verified through the TGA analysis, in which () the remnants of the tested materials verified the MWCNT amount in the nanocomposites.
4.3. DMA properties
Analysis through the DMA test showed an enhanced performance of the nanocomposite materials during the bending and thermal stress test. The highest values were exhibited at the 1.0 wt.% MWCNTs ratio, which differs from the other mechanical and thermal results in the study. This difference in the performance of the nanocomposite materials could be attributed to the lower rate of aggregates in this filler’s ratio. Following what was described before regarding the morphology of the 3D printed material, aggregates were developed in the micro-scale and may have affected the performance of the specimens.
4.4. Electrical properties
The electrical properties of the PA12/MWCNTs nanocomposite materials were tested in the current study. According to the results shown in , the electrical conductivity is above the threshold values of conductors under all filler ratios. Through the electrical analysis conducted it was clearly shown that the introduction of MWCNTs develops functionality in the PA12 polymer matrix that makes it suitable in applications of flexible wires, wearable sensors, and the creation of complex electrically conductive structures, through AM. The highest electrical conductivity values were measured at 10.0 wt.% MWCNTs ratio, while the difference to the 5.0 wt.% one was not significant. According to these measures and considering the processability of the nanocomposites through melt mixing and FFF, it can be concluded that 5.0 wt.% MWCNTs is the more appropriate filler ratio for the creation of a valuable electrically conductive polyamide-based nanocomposite material, with a good mechanical and thermomechanical response.
4.5. Antibacterial properties
The antibacterial activity of the fabricated nanocomposites was evaluated through a standard microbiological test method. An antibacterial performance against gram-negative E. coli and gram-positive S. aureus was observed for the 10 wt.% PA12/MWCNTs nanocomposites that were fabricated in this work, while lower MWCNTs filler ratios still exhibited an antibacterial performance potential, although results were not measurable in this case. The method followed is proposed as a screening method and further research for the antibacterial properties of the PA12/MWCNTs nanocomposite materials is proposed. Generally, MWCNTs showed the ability to transfuse their properties to the PA12 matrix.
Mechanical enhancement in combination with electrical conductivity and antibacterial properties are noticeable properties for an AM nanocomposite material, although the melt mixing and extrusion process for filament fabrication and the specimens manufacturing during the 3D printing process still need to be further optimized, for industrial use. Higher filler’s loadings of over 5.0 wt.% showed noticeable difficulties in the materials processing and the melt mixing procedure needs to be further investigated for optimization. The potential of fabricating PA12/MWCNTs nanocomposite materials with 5.0 wt.% and higher loadings could create all the necessary potential for a multi-functional AM filament, able to create complex geometries, lower-cost parts, and many others, especially in the medical sector and wherever such specifications are required.
5 Conclusions
In this work multi-functional PA12/MWCNT nanocomposites at various filler loadings, from 0.1 wt.% to 10 wt.%, were developed with a thermomechanical process. Specimens were 3D printed with the FFF process and characterized with various methods for their mechanical, thermal, electrical, and antibacterial performance. The effect of the filler loading on the materials’ response was also considered in the work. In all cases, it was found that the thermal stability of the materials was not compromised with the addition of the filler. The highest mechanical response is reported in the 5 wt.% filler loading. The highest electrical conductivity and antibacterial performance are reported at the highest filler loading of 10 wt.% studied in this work, which also had improved mechanical response compared to the matrix material and at the same time exhibited Joule heating behavior, making it suitable for applications requiring such specifications. Since the mechanical response decreased compared to the 5 wt.% this can be assumed as a potential percolation threshold for the specific filler in this matrix material with the preparation process followed. This is also verified in the SEM images, in which voids, and defects can be observed on the side surface of the 3D printed specimens, indicating that processability issues are expected at higher loadings. When the mechanical response is the main specification required, the 5 wt.% had a significantly higher response than the remaining materials of this work.
With the process followed cost-effective multi-functional nanocomposites were prepared with an enhanced mechanical, electrical, and antibacterial response, compared to the matrix material. The cost-effectiveness is attributed to the fact that the materials cost increase is about 30% higher for the filler loadings studied. This cost is not the main cost of the process, and it was estimated for laboratory-scale quantities. For industrial-scale quantities, this increase can be decreased.
As future work, the nanocomposites preparation process can be further optimized and adjusted to industrial-scale processes, more bacteria can be tested, and statistical modeling can be applied to find the optimum process parameters.
Acknowledgements
Authors would like to thank Ms Aleka Manousaki from the Institute of Electronic Structure and Laser of the Foundation for Research and Technology, Hellas (IESL-FORTH), for taking the SEM images presented in this work.
Disclosure statement
No potential conflict of interest was reported by the author(s).
Data availability statement
The authors confirm that the data supporting the findings of this study are available within the article http://dx.doi.org/10.1080/09243046.2022.2076019.
References
- Goh GD, Yap YL, Tan HKJ, et al. Process–structure–properties in polymer additive manufacturing via material extrusion: a review. Critl Rev Solid State Mater Sci. 2020;45(2):113–133.
- Alcácer V, Cruz-Machado V. Scanning the industry 4.0: a literature review on technologies for manufacturing systems. Eng Sci Technol Int J. 2019;22(3):899–919.
- Ford S, Despeisse M. Additive manufacturing and sustainability: an exploratory study of the advantages and challenges. J Clean Prod. 2016;137:1573–1587.
- Savolainen J, Collan M. How additive manufacturing technology changes business models?– review of literature. Addit Manuf. 2020;32. DOI:10.1016/j.addma.2020.101070
- Ngo TD, Kashani A, Imbalzano G, et al. Additive manufacturing (3D printing): a review of materials, methods, applications, and challenges. Compos Part B Eng. 2018;143:172–196.
- Vidakis N, Petousis M, Vairis A, et al. On the compressive behavior of an FDM steward platform part. J Comput Des Eng. 2017;4(4):339–346.
- Vidakis N, Vairis A, Petousis M, et al. Fused deposition modelling parts tensile strength characterisation. Acad J Manuf Eng. 2016;14(2):87–94.
- Vidakis N, Petousis M, Vairis A, et al. A parametric determination of bending and Charpy’s impact strength of ABS and ABS-plus fused deposition modeling specimens. Prog Addit Manuf. 2019;4(3):323–330.
- Vairis A, Petousis M, Vidakis N, et al. On the strain rate sensitivity of ABS and ABS plus fused deposition modeling parts. J Mater Eng Perform. 2016;25(9):3558–3565.
- Vidakis N, Petousis M, Maniadi A, et al. Sustainable additive manufacturing: mechanical response of acrylonitrile-butadiene-styrene over multiple recycling processes. Sustainability (Switzerland). 2020;12. DOI:10.3390/SU12093568
- Valvez S, Santos P, Parente JM, et al. 3D printed continuous carbon fiber reinforced PLA composites: a short review. Procedia Struct Integr. 2020;25:394–399. (Elsevier B.V.).
- Tzounis L, Bangeas PI, Exadaktylos A, et al. Three-dimensional printed polylactic acid (PLA) surgical retractors with sonochemically immobilized silver nanoparticles: the next generation of low-cost antimicrobial surgery equipment. Nanomaterials. 2020;10(5):985.
- Vidakis N, Petousis M, Velidakis E, et al. Enhanced mechanical, thermal, and antimicrobial properties of additively manufactured polylactic acid with optimized nano-silica content. Nanomaterials. 2021;12(1):11.
- Czaniková K, Špitalský Z, Krupa I, et al. Electrical and mechanical properties of ethylene-vinyl acetate-based composites. Mater Sci Forum. 2012;714:193–199. (Trans Tech Publications Ltd).
- Carrasco PM, Tzounis L, Mompean FJ, et al. Thermoset magnetic materials based on poly(ionic liquid)s block copolymers. Macromolecules. 2013;46(5):1860–1867.
- Ferreira I, Melo C, Neto R, et al. Study of the annealing influence on the mechanical performance of PA12 and PA12 fiber-reinforced FFF printed specimens. Rapid Prototyping J. 2020;26(10):1761–1770.
- Vidakis N, Petousis M, Velidakis E, et al. On the strain rate sensitivity of fused filament fabrication (FFF) processed PLA, ABS, PETG, PA6, and PP thermoplastic polymers. Polymers. 2020;12(12):1–15.
- Cai C, Tey WS, Chen J, et al. Comparative study on 3D printing of polyamide 12 by selective laser sintering and multi-jet fusion. J Mater Process Technol. 2021;288:116882.
- Liu Y, Zhu L, Zhou L, et al. Microstructure and mechanical properties of reinforced polyamide 12 composites prepared by laser additive manufacturing. Rapid Prototyping J. 2019;25(6):1127–1134.
- Espera AH, Valino AD, Palaganas JO, et al. 3D printing of a robust polyamide-12-carbon black composite via selective laser sintering: thermal and electrical conductivity. Macromol Mater Eng. 2019;304. DOI:10.1002/mame.201800718.
- Vidakis N, Petousis M, Tzounis L, et al. Sustainable additive manufacturing: mechanical response of polyamide 12 over multiple recycling processes. Materials. 2021;14:1–15.
- Kim JH, Choe HC, Son MK. Evaluation of adhesion of reline resins to the thermoplastic denture base resin for non-metal clasp denture. Dent Mater J. 2014;33(1):32–38.
- Soygun K, Bolayir G, Boztug A. Mechanical and thermal properties of polyamide versus reinforced PMMA denture base materials. J Adv Prosthodont. 2013;5(2):153–160.
- Srinivasan N, Dhanraj G. Polyamide as a denture base material- a review. Int J Curr Adv Res. 2017;6(4):3272–3274 doi:10.24327/ijcar.2017.3274.0244.
- Durkan R, Ayaz EA, Bagis B, et al. Comparative effects of denture cleansers on physical properties of polyamide and polymethyl methacrylate base polymers. Dent Mater J. 2013;32(3):367–375.
- De Freitas Fernandes FS, Pereira-Cenci T, Da Silva WJ, et al. Efficacy of denture cleansers on Candida spp. biofilm formed on polyamide and polymethyl methacrylate resins. J Prosthet Dent. 2011;105(1):51–58. [Internet].
- Daelemans L, van der Heijden S, De Baere I, et al. Nanofibre bridging as a toughening mechanism in carbon/epoxy composite laminates interleaved with electrospun polyamide nanofibrous veils. Compos Sci Technol [Internet]. 2015;117:244–256.
- Heikkilä P, Harlin A. Parameter study of electrospinning of polyamide-6. Eur Polym J. 2008;44(10):3067–3079.
- Supaphol P, Mit-Uppatham C, Nithitanakul M. Ultrafine electrospun polyamide-6 fibers: effect of emitting electrode polarity on morphology and average fiber diameter. J Polym Sci Part B. 2005;43(24):3699–3712.
- Mit-Uppatham C, Nithitanakul M, Supaphol P. Ultrafine electrospun polyamide-6 fibers: effect of solution conditions on morphology and average fiber diameter. Macromol Chem Phys. 2004;205(17):2327–2338.
- De Schoenmaker B, Van Der Heijden S, De Baere I, et al. Effect of electrospun polyamide 6 nanofibers on the mechanical properties of a glass fibre/epoxy composite. Polym Test. 2013;32(8):1495–1501.
- Rahim TNAT, Abdullah AM, Akil HM, et al. The improvement of mechanical and thermal properties of polyamide 12 3D printed parts by fused deposition modelling. Express Polym Lett. 2017;11(12):963–982.
- Zhang X, Fan W, Liu T. Fused deposition modeling 3D printing of polyamide-based composites and its applications. Compos Commun. 2020;21:100413. [Internet].
- Polyakov IV, Vaganov GV, Yudin VE, et al. Investigation of properties of nanocomposite polyimide samples obtained by fused deposition modeling. Mech Compos Mater. 2018;54(1):33–40.
- Herrero M, Peng F, Núñez Carrero KC, et al. Renewable nanocomposites for additive manufacturing using fused filament fabrication. ACS Sustain Chem Eng. 2018;6(9):12393–12402.
- Zhu D, Ren Y, Liao G, et al. Thermal and mechanical properties of polyamide 12/graphene nanoplatelets nanocomposites and parts fabricated by fused deposition modeling. J Appl Polym Sci. 2017;134(39):1–13.
- Dul S, Fambri L, Pegoretti A. High-performance polyamide/carbon fiber composites for fused filament fabrication: mechanical and functional performances. J Mater Eng Perform [Internet]. 2021;30(7):5066–5085.
- Arigbabowo OK, Tate JS. Additive manufacturing of polyamide nanocomposites for electrostatic charge dissipation applications. Mater Sci Eng B Solid-State Mater Adv Technol [Internet]. 2021;271:115251.
- Kausar A. Trends in graphene reinforced polyamide nanocomposite for functional application: a review. Polym Technol Mater [Internet]. 2019;58:917–933.
- Chatterjee S, Nüesch FA, Chu BTT. Comparing carbon nanotubes and graphene nanoplatelets as reinforcements in polyamide 12 composites. Nanotechnology. 2011;22(27):275714. DOI:10.1088/0957-4484/22/27/275714.
- Zheng Y, Wang R, Dong X, et al. High strength conductive polyamide 6 nanocomposites reinforced by prebuilt three-dimensional carbon nanotube networks. ACS Appl Mater Interfaces. 2018;10(33):28103–28111.
- Fotouhi M, Jalalvand M, Wisnom MR. Notch insensitive orientation-dispersed pseudo-ductile thin-ply carbon/glass hybrid laminates. Compos Part A Appl Sci Manuf. 2018;110:29–44. [Internet].
- Doagou-Rad S, Islam A, Jensen JS. Influence of processing conditions on the mechanical behavior of MWCNT reinforced thermoplastic nanocomposites. Procedia CIRP (Elsevier B.V.). 2017;66:131–136.
- Jouni M, Djurado D, Massardier V, et al. A representative and comprehensive review of the electrical and thermal properties of polymer composites with carbon nanotube and other nanoparticle fillers. Poly Int. 2017;66(9):1237–1251.
- Raj A, Samuel C, Malladi N, et al. Enhanced (thermo)mechanical properties in biobased poly(l - lactide)/poly(amide-12) blends using high shear extrusion processing without compatibilizers. Polym Eng Sci. 2020;60(8):1902–1916.
- Charroux B, Daian F, Royet J. Drosophila aversive behavior toward Erwinia carotovora carotovora is mediated by bitter neurons and Leukokinin. iScience. 2020;23(6):101152.
- Narayan RJ, Berry CJ, Brigmon RL. Structural and biological properties of carbon nanotube composite films. Mater Sci Eng B: Solid-State Mater Adv Technol. 2005;123(2):123–129.
- Alizadeh A, Razmjou A, Ghaedi M, et al. Nanoporous solid-state membranes modified with multi-wall carbon nanotubes with anti-biofouling property. Int J Nanomedicine. 2019;14:1669–1685.
- Liu J, Wu D, Zhu N, et al. Antibacterial mechanisms and applications of metal-organic frameworks and their derived nanomaterials. Trends Food Sci Technol. 2021;109:413–434.
- Azizi-Lalabadi M, Hashemi H, Feng J, et al. Carbon nanomaterials against pathogens; the antimicrobial activity of carbon nanotubes, graphene/graphene oxide, fullerenes, and their nanocomposites. Adv Colloid Interface Sci [Internet]. 2020;284:102250.
- Yang C, Mamouni J, Tang Y, et al. Antimicrobial activity of single-walled carbon nanotubes: length effect. Langmuir. 2010;26(20):16013–16019.
- Nepal D, Balasubramanian S, Simonian AL, et al. Strong antimicrobial coatings: single-walled carbon nanotubes armored with biopolymers. Nano Lett. 2008;8(7):1896–1901.
- Dizaj SM, Mennati A, Jafari S, et al. Antimicrobial activity of carbon-based nanoparticles. Adv Pharm Bull. 2015;5(1):19–23.
- Kang S, Pinault M, Pfefferle LD, et al. Single-walled carbon nanotubes exhibit strong antimicrobial activity. Langmuir. 2007;23(17):8670–8673.
- Chaparro-Rico BDM, Martinello K, Fucile S, et al. User-Tailored Orthosis Design for 3D Printing with PLACTIVE: a Quick Methodology. Crystals. 2021;11(5):561.
- Lewis JS, Barani Z, Magana AS, et al. Thermal and electrical conductivity control in hybrid composites with graphene and boron nitride fillers. Mater Res Express. 2019;6(8): 085325. DOI:10.1088/2053-1591/ab2215.
- Mohd Radzuan NA, Sulong AB, Sahari J. A review of electrical conductivity models for conductive polymer composite. Int J Hydrogen Energy [Internet]. 2017;42(14):9262–9273.
- Yang Z, Peng H, Wang W, et al. Crystallization behavior of poly(ε-caprolactone)/layered double hydroxide nanocomposites. J Appl Polym Sci. 2010;116:2658–2667.
- Liu H, Li Q, Zhang S, et al. Electrically conductive polymer composites for smart flexible strain sensors: a critical review. J Mater Chem C. 2018;6(45):12121–12141.
- Chen J, Zhu Y, Guo Z, et al. Recent progress on thermo-electrical properties of conductive polymer composites and their application in temperature sensors. Eng Sci. 2020;12:13–22.
- Jianwen C, Yutian Z, Jinrui H, et al. Advances in responsively conductive polymer composites and sensing applications. Polymer Rev. 2021;61(1):157–193.
- Li J, Wang Y, Yue TN, et al. Robust electromagnetic interference shielding, joule heating, thermal conductivity, and anti-dripping performances of polyoxymethylene with uniform distribution and high content of carbon-based nanofillers. Compos Sci Technol [Internet]. 2021;206:108681.
- Cai JH, Tang XH, Chen XD, et al. Temperature and strain-induced tunable electromagnetic interference shielding in polydimethylsiloxane/multi-walled carbon nanotube composites with temperature-sensitive microspheres. Compos Part A Appl Sci Manuf [Internet]. 2021;140:106188.
- Wang M, Tang XH, Cai JH, et al. Construction, mechanism and prospective of conductive polymer composites with multiple interfaces for electromagnetic interference shielding: a review. Carbon N Y [Internet]. 2021;177:377–402.
- Cai JH, Li J, Chen XD, et al. Multifunctional polydimethylsiloxane foam with multi-walled carbon nanotube and thermo-expandable microsphere for temperature sensing, microwave shielding and piezoresistive sensor. Chem Eng J [Internet]. 2020;393:124805.
- Hong R, Zhao Z, Leng J, et al. Two-step approach based on selective laser sintering for high performance carbon black/ polyamide 12 composite with 3D segregated conductive network. Compos Part B Eng [Internet]. 2019;176:107214.
- Kazemi Y, Kakroodi AR, Mark LH, et al. Effects of polymer-filler interactions on controlling the conductive network formation in polyamide 6/multi-Walled carbon nanotube composites. Polymer (Guildf). 2019;178:121684. DOI:10.1016/j.polymer.2019.121684.
- Radoičić M, Ćirić-Marjanović G, Miličević D, et al. Fine-tuning of conductive and dielectric properties of polypyrrole/TiO2 nanocomposite-coated polyamide fabric. Compos Interfaces [Internet]. 2021;28(8):795–808.
- Socher R, Krause B, Hermasch S, et al. Electrical and thermal properties of polyamide 12 composites with hybrid fillers systems of multiwalled carbon nanotubes and carbon black. Compos Sci Technol [Internet]. 2011;71(8):1053–1059.
- Dorigato A, Pegoretti A. Novel electroactive polyamide 12 based nanocomposites filled with reduced graphene oxide. Polym Eng Sci. 2019;59(1):198–205.
- Barjasteh E, Sutanto C, Nepal D. Conductive polyamide-graphene composite fabric via interface engineering. Langmuir. 2019;35(6):2261–2269.
- Kim MJ, Cruz MA, Ye S, et al. One-step electrodeposition of copper on conductive 3D printed objects. Addit Manuf. 2019;27:318–326. [Internet].
- Roy S, Bilal Qureshi M, Asif S, et al. A model for 3D-printed microstrip transmission lines using conductive electrifi filament. 2017 IEEE Antennas Propag Soc Int Symp Proc. January 2017;2017: 1099–1100.
- Mitra D, Roy S, Striker R, et al. Conductive electrifi and nonconductive ninjaflex filaments based flexible microstrip antenna for changing conformal surface applications. Electron. 2021;10(7):821.
- Mitra D, Striker R, Cleveland J, et al. A 3D printed microstrip patch antenna using electrifi filament for in-space manufacturing. 2021 United States Natl Comm URSI Natl Radio Sci Meet Usn NRSM 2021 - Proc 2021; 216–217.
- Ibrahim M, Mogan Y, Shafiqah Jamry SN, et al. Resistivity study on conductive composite filament for freeform fabrication of functionality embedded products. ARPN J Eng Appl Sci. 2016;11:6525–6530.
- Flowers PF, Reyes C, Ye S, et al. 3D printing electronic components and circuits with conductive thermoplastic filament. Addit Manuf. 2017;18:156–163. [Internet].
- Florian Machui DI. Formulation of semiconductor solutions for organic photovoltaic devices formulierung von halbleiterlösungen für die organische photovoltaik. Nuremberg: Technischen Fakultät der Friedrich-Alexander-Universität Erlangen-Nürnberg; 2014.
- Kulkarni A, Mukhopadhyay N, Bhattacharyya AR, et al. Dispersion of non-covalently modified graphene in aqueous medium: a molecular dynamics simulation approach. RSC Adv. 2017;7(8):4460–4467.
- Linkov I, Steevens J. Nanomaterials: risks and benefits. Dordrecht: Springer; 2009.
- Haq MIU, Raina A, Ghazali MJ, et al. Potential of 3D printing technologies in developing applications of polymeric nanocomposites. In Jena H, Katiyar JK, Patnaik A editors. Tribology of polymer and polymer composites for industry 4.0. Composites science and technology. Springer: Singapore. 2021. 193–210. DOI:10.1007/978-981-16-3903-6_10.
- Clarissa WHY, Chia CH, Zakaria S, et al. Recent advancement in 3-D printing: nanocomposites with added functionality. Prog Addit Manuf. 2021. [Internet]. DOI:10.1007/s40964-021-00232-z.
- Vidakis N, Petousis M, Kechagias J. Parameter effects and process modeling of Polyamide 12 3D-printed parts strength and toughness. Mater Manuf Process. 2022;1–12. DOI:10.1080/10426914.2022.2030871
- Balouiri M, Sadiki M, Ibnsouda SK. Methods for in vitro evaluating antimicrobial activity: a review. J Pharm Anal. 2016;6(2):71–79.
- Tzounis L, Kirsten M, Simon F, et al. The interphase microstructure and electrical properties of glass fibers covalently and non-covalently bonded with multiwall carbon nanotubes. Carbon. 2014;73:310–324.
- Ferrari AC, Basko DM. Raman spectroscopy as a versatile tool for studying the properties of graphene. Nat Nanotechnol. 2013;8(4):235–246. PMID: 23552117.
- Tzounis L, Petousis M, Liebscher M, et al. Three-Dimensional (3D) Conductive Network of CNT-Modified short jute fiber-reinforced natural rubber: hierarchical CNT-enabled thermoelectric and electrically conductive composite interfaces. Materials. 2020;13(11):2668.
- Vidakis N, Petousis M, Tzounis L, et al. Polyamide 12/multiwalled carbon nanotube and carbon black nanocomposites manufactured by 3D printing fused filament fabrication: a comparison of the electrical, thermoelectric, and mechanical properties. C. 2021;7:38.
- Tzounis L, Petousis M, Grammatikos S, et al. 3D printed thermoelectric polyurethane/multiwalled carbon nanotube nanocomposites: a novel approach towards the fabrication of flexible and stretchable organic thermoelectrics. Materials. 2020;13(12):2879.