
ABSTRACT
Value-added (VA) measures are currently the predominant approach used to compare the effectiveness of schools. Recent educational effectiveness research, however, has developed alternative approaches including the regression discontinuity (RD) design, which also allows estimation of absolute school effects. Initial research suggests RD is a viable approach to measuring school effectiveness. The present study builds on this pioneering work by using RD and VA designs to estimate school effects at system and school level, comparing estimates from several measurement designs. The study uses a large English dataset (N = 148,135) spanning 342 schools, 10 local authorities, 6 consecutive school year groups (UK Years 3–9) across 3 years. RD is found to be a suitable approach for system-level absolute school effect estimates. Cross-sectional and longitudinal measures are found to lead to markedly different estimates when comparing individual schools. The results also reinforce the need to treat measures based on a single cohort with extreme caution.
Introduction and aims
Recent methodological advances in educational effectiveness research have developed a number of alternative designs for estimating school effects using different methodological logics (Sammons & Luyten, Citation2009). One promising alternative approach to measuring school effectiveness is the application of a quasi-experimental design known as the regression discontinuity (RD) design. The RD design has been developed and promoted as a tool for estimating school effectiveness in recent educational effectiveness research (Kyriakides & Luyten, Citation2009; Luyten, Citation2006; Luyten, Peschar, & Coe, Citation2008; Luyten, Tymms, & Jones, Citation2009). One of these papers compared cross-sectional RD estimates with longitudinal RD estimates (henceforth LRD), finding “hardly any difference” for system-level school effects (Luyten et al., Citation2009, p. 156). There were, however, some differences in the estimates for individual schools. The authors conclude that these two approaches produce fairly consistent estimates but note the relatively small dataset used, covering only one year group and only 18 schools. They observe the value of seeking to replicate their results in larger datasets and using other age ranges, a task which the present study sets out to accomplish.
The present study builds on this pioneering work by (a) comparing several RD and LRD estimates of the system-level absolute school effect (i.e., the mean effect of additional years of schooling for all schools) and (b) comparing the variances and correlations of several RD, LRD, and value-added (VA) measures at school level to examine the extent to which estimates for individual schools vary. All measures are calculated using a large English dataset (N = 148,135) spanning 342 schools, 10 local authorities, six consecutive school year groups (English school years 3–9) across 3 calendar years.
Comparing various measures using the same data isolates the key differences in measurement design and specification which lead to any discrepancies. The results are a test of inter-method reliability. As discussed below, however, reliability evidence is held to inform debates over validity and methodology in general. The results look both ways, shedding light on the viability of the RD design as an alternative method of estimating school effects as well as providing a source of comparison to understand the validity of VA estimates in this context.
Regression discontinuity measures are found to give consistent estimates of system-level absolute school effects but are found to be problematic for the estimation of school effects for individual schools due to volatility between cohort performances. The school-level VA estimates are found to be highly consistent with differences in the absolute levels of progress made by pupils but, by design, cannot estimate absolute effects. Before proceeding to describe the analyses and these results, it is important to (a) introduce the RD design, (b) review its current use within educational effectiveness research, and (c) explicate the differences in the methodological approaches to inference between various value-added and regression discontinuity designs to inform the subsequent analysis.
An alternative to value-added measures for the estimation of school effects: the regression discontinuity design
Introduction to the regression discontinuity design
RD-based measures estimate treatment effects by considering the outcomes either side of a known cut-off point for the treatment in question. The RD design estimates whether a regression line exhibits a “discontinuity” at the cut-off point. A sudden break in an otherwise continuous regression line yields strong evidence regarding a programme’s effectiveness, and the magnitude of the discontinuity can be used as an estimate of the programme’s effect (Bloom, Citation2012; Shadish, Cook, & Campbell, Citation2002; Trochim, Citation1984). The RD design can be applied to the estimation of school effectiveness: Many school systems admit young children to the 1st year of schooling on the basis of their age relative to a given cut-off date. In England, those born on 31 August will have received a whole year extra of schooling than pupils of almost the same age born a day later on 1 September. Also, within the same year group, there is a strong tendency for older pupils (e.g., those born in September) to outperform relatively younger pupils (e.g., those born in August) (Crawford, Dearden, & Meghir, Citation2010). This results in an upward sloping regression line for performance against pupil age which can be interpreted as pupil maturity. Any break in the regression line at the administrative cut-off point between adjacent year groups can be interpreted as the effect of an additional year of schooling (Luyten et al., Citation2009, p. 155). This organisational feature raises an opportunity to separate the effects of age and schooling and, thereby, estimate the absolute effects of schools individually and collectively (Luyten, Citation2006; Luyten et al., Citation2009).
Practical use of regression discontinuity designs
The use of the RD design in social research dates back to the mid-20th century (Shadish et al., Citation2002), and it has become increasingly used in educational research (e.g., Allen, Burgess, & McKenna, 2012; Vardardottir, Citation2013). The use of the RD specifically for the estimation of school effects is far less common. While there are early examples of RD-based school effects estimation (Cahan & Cohen, Citation1989; Cahan & Davis, Citation1987), the practice has only recently come to more general awareness amongst educational effectiveness researchers following research by Luyten (Citation2006), which demonstrated and assessed RD-based school effectiveness estimation, and subsequent work, which extended, tested, and applied the method (Kyriakides & Luyten, Citation2009; Luyten et al., Citation2008; Luyten et al., Citation2009). Building on these promising results, researchers are beginning to make use of RD in educational effectiveness studies (Heck & Moriyama, Citation2010), and it is being recognised as a “fruitful” methodological development in school effectiveness measurement (Reynolds et al., Citation2014, p. 204).
The existing evidence gives a positive picture of the design and its potential and identifies issues which must be considered. RD designs have been successfully used to estimate absolute school effects on academic outcomes and on attitudinal measures in international datasets such as the Third International Mathematics and Science Study (TIMSS) (Luyten, Citation2006; Luyten & Veldkamp, Citation2011) and the Programme for International Student Assessment (PISA) (Luyten et al., Citation2008), with follow-up studies refining the latter in light of the difficulties of using PISA data (Benton, Citation2014). For present purposes, this evidence seems to be to the credit of the RD design in that it has been used to estimate absolute school effects using only cross-sectional data. Moreover, regression discontinuity designs can be extended in numerous ways: to include interaction effects with the added-year effect (Luyten, Citation2006), correct for “the unmeasured variables determining assignment to grades” (Luyten & Veldkamp, Citation2011, p. 267), and encompass multiple cut-off points (i.e., a series of added-year effects across a number of consecutive school years) (Kyriakides & Luyten, Citation2009).
There are a number of examples, therefore, of studies using RD to estimate system-level absolute school effects and thereby comparing the effectiveness of national school systems across a range of outcomes. There are currently very few examples, however, of studies which have been in the position to compare the effectiveness of individual schools. The study by Kyriakides and Luyten (Citation2009) is one example which did compare the relative effects of individual schools but with only six schools in the sample did not find clear evidence of variable effectiveness. A study in a better position to make such comparisons was Luyten et al. (Citation2009). This study is of particular importance for the present study as it also compares effectiveness of schools using both cross-sectional (RD) and longitudinal (LRD) data. Luyten et al. (Citation2009) draw on data from the baseline assessment used within the Performance Indicators in Primary Schools (PIPS) project (Tymms, Citation1999; Tymms & Albone, Citation2002), estimating overall and relative school effects for 4- and 5-year-old pupils. In the PIPS data, “less than 1.5% of the pupils were in the ‘wrong’ grade given their date of birth” (Luyten et al., Citation2009, p. 146). This is therefore excellent for the calculation of RD estimates (see below). Their findings indicate that the overall (system-level) effect of an additional year of schooling is “very similar” in both the cross-sectional and longitudinal dataset for all three outcome areas (Luyten et al., Citation2009, p. 152). In terms of school-level differences in the added-year effect, variance of the cross-sectional (RD) estimates were consistently higher than for the longitudinal (LRD) estimates. Pairwise correlations of the RD and LRD school effectiveness estimates were 0.78, 0.71, and 0.52 for reading, mathematics, and phonics, respectively; the latter appearing to exhibit ceiling effects in the assessment across the 2 years. These results suggest that estimates produced in cross-sectional data comparing adjacent cohorts are fairly, but not entirely, consistent with longitudinal estimates following the same cohort. As Luyten et al. (Citation2009) compared estimates for only one year group for 18 schools, there is great value in replicating these results in a larger dataset including more schools and a greater range of ages, as is done here.
Threats to validity when using a RDD
At the simplest level, RD designs only need a measure of age and test scores for two consecutive year groups. Assuming a valid measure of the outcome is obtained, the key threat to validity of a RD design is non-adherence to the cut-off (Shadish et al., Citation2002) (i.e., pupils who are in the “wrong” year as predicted by their chronological age). It is common practice in some school systems to “hold back” lower attaining pupils by a year or to “promote” higher attaining pupils to a higher year. The extent of these practices differs substantially by country (Luyten & Veldkamp, Citation2011). Less than 5% non-adherence is often considered a level which will give reliable estimates (Trochim, Citation1984). English rates of non-adherence are generally found to be relatively low at around 1% to 2% (Luyten et al., Citation2008; Luyten et al., Citation2009; Luyten & Veldkamp, Citation2011).
The RD design uses the lower of two consecutive cohorts in a school as the baseline against which the absolute effect of schooling can be estimated. This raises a second problem: Cohort characteristics in a school fluctuate from year to year, and this may lead to unreliability in estimates of the effect of an additional year of schooling, a problem also faced by VA models (Teddlie & Reynolds, Citation2000, p. 72). To address this, RD can also be applied to longitudinal data to adjust cohorts’ progress over time by the estimated effect of maturity (Luyten et al., Citation2009), thus ruling out performance differences between adjacent cohorts as a source of variation. This negates one of the advantages of the RD design: that it can be used to estimate school effects using cross-sectional data.
As noted above, RD can be used across several adjacent year groups, using multiple cut-off points to estimate the added-year effect for each additional year of schooling (Kyriakides & Luyten, Citation2009). This raises an additional problem of suitable specification for the added-year effect and whether it should be estimated as fixed for all years, as having a non-linear relationship, or whether it should be allowed to vary on a year-by-year basis.
One final difficulty is a relative age effect within a school year. It may be the case that there are relative age effects, where being the oldest or youngest in a year group has an influence over and above this general function describing the link between performance and age. Previous research in this area, however, has concluded that the absolute age effect is approximately linear and that the pupil’s age when taking the test rather than a relative age effect is the overriding factor explaining the link between age and examination performance within a given cohort (Crawford, Dearden, & Greaves, Citation2013; Crawford et al., Citation2010).
Comparing value-added and regression discontinuity designs
Absolute versus relative effect
A major difference between VA and RD is that VA designs estimate the relative effectiveness of schools and require measures of prior attainment (Lenkeit, Citation2013) and that RD designs estimate the absolute effect and can be used in cross-sectional data. Other things being equal, where a school is highly effective and its pupils made higher rates of progress, this should be reflected in both designs. Absolute estimates have the advantage that all schools are able to improve, but the measure can face difficulties with capturing and comparing attainment over time on a meaningful common scale.
“Like-with-like” comparison
As noted above, cross-sectional RD measures assume that two consecutive cohorts are from a single population, with the lower year group being a suitable baseline to estimate the progress made by the upper year. Therefore, RD is at risk of differences between cohorts distorting the measured absolute effects, particularly when comparing estimates for individual schools. A lower cohort with relatively poor performance, for example, would exaggerate the estimated absolute school effect. Use of longitudinal data to track the same cohort over 2 or more years addresses this problem. Nonetheless, LRD may still be unfair when used to compare individual schools if the absolute added-year effect depends on pupil characteristics that are not controlled.
VA measures make the assumption that the most appropriate comparator against which to judge progress is a statistically similar pupil, as estimated using a regression model taking a number of non-school factors into account. A distinction is typically made between VA measures, which account for only prior attainment, and contextualised value-added (CVA) measures which take other pupil differences such as gender or disadvantage into account (e.g., Evans, Citation2008). Adding contextual variables to models will remove non-school factor biases from measures but can potentially also attenuate school effects (Organisation for Economic Co-operation and Development, Citation2008, p. 126). Theory is required to select contextual variables, and there are theoretical and practical limits to what is possible to measure and therefore control (Creemers, Kyriakides, & Sammons, Citation2010; Tymms, Citation1996). As a result, school effects produced using value-added designs are inevitably approximate to some degree and can contain unobserved biases, especially estimates for small or atypical school intakes.
Underlying measures and common problems
Finally, there are many problems common to both measurement designs which could render both measures invalid even if they prove to be in agreement. These problems include the validity of the underlying measure of performance used (discussed below) and problems of generalisation such as differential school effectiveness across ability levels, groups, time and various outcomes (Sammons, Citation1996; Thomas, Citation2001). These problems can raise slightly different difficulties for each design, such as the added requirement for the outcome measure used in the RD design to be equally applicable for both year groups in a way which appropriately measures progress across the 2 years (see Cahan & Elbaz, Citation2000). This study focuses on differences between the robustness and design of VA and RD measures rather than these common problems, although they are certainly important considerations.
Research questions
Several research questions for this paper follow on directly from those of Luyten et al. (Citation2009, p. 148), whose results this study seeks to replicate. These questions are extended to a greater range of concerns allowed by the more extensive data. The more extensive data, for example, allow interaction variables to be included and estimates from across the age range studied (ages 7–14) to be compared. Also, the intention to compare the designs of VA and RD also necessitates model variations to be compared to isolate which assumptions are driving any major differences.
What is the system-level absolute effect of additional years of schooling on pupil performance?
Do absolute school effects differ according to ability or other contextual factors?
To what extent does the absolute school effect vary between schools?
How similar are school-level estimates of effectiveness produced using a value-added (VA), contextualised value-added (CVA), cross-sectional regression discontinuity (RD) and a longitudinal regression discontinuity (LRD) design?
Method
Data source and measures
Data were taken from an English Department for Education (DfE) research study known as Making Good Progress (MGP). A report of the data titled, “How Do Pupils Progress During Key Stages 2 and 3?” was produced by the DfE (Citation2011). Note that Key Stages 2 and 3 correspond to National Curriculum (NC) years 3 to 9, or age 7 to 14. The DfE MGP report examined rates of progress over time, how progress related to various pupil characteristics, and how it translated into achievement of government threshold levels (DfE, Citation2011). The report also compared the sample across a range of pupil background variables with national data for these year groups, finding it to be “broadly representative” of pupils in Years 3 to 9 nationally (DfE, Citation2011, p. 6). gives an overview of the MGP sample, showing the number of pupils in each cohort (A–I) and their NC year group (3–9) for each of the three study years (T1–T3).
Table 1. Year group and number within each cohort by time period.
Outcome measures collected in the MGP data were teacher-assessed NC scores in reading, writing, and mathematics. In the present study, only mathematics data were used due to concerns over measure robustness (see below). The teacher-assessed NC scores and several additional variables were collected specifically for the study, and these were matched with National Pupil Database (NPD) data containing prior attainment data at key stages and a large number of pupil background variables. Summary statistics of the outcome and control variables used in the present study are given in . Further details of the MGP dataset more generally, including more details on the local educational authorities included, variables collected, and methodology of the data collection, can be found in the DfE report (DfE, Citation2011).
Table 2. Summary of Making Good Progress performance data.
Limitations of the MGP data
There are several notable weaknesses of the MGP data: First, the pupil date of birth (DOB) is given by month and year, and so the specific day is not identified. This is not considered a major difficulty given that, in keeping with previous studies (Luyten et al., Citation2009), age effects are estimated as fixed effects for the entire sample studied. Moreover, given that the age effect is found to be linear and calculated using the large MGP sample, this lack of fine-grained information will have little effect on a linear trend. It will mean, however, that there will be some level of error in controlling for the effect of maturity, especially for smaller groups. As each pupil’s DOB is recorded as the 15th of the month, pupils may be as much as half a month away from the recorded age value against which their results are adjusted. Given the small likely size of this discrepancy and the likelihood that some of the bias will be smoothed when considering school-level effects, the problem posed by these weaknesses for the present purposes is thought to be small. Also note that estimating the age effect using an entire cohort or several cohorts makes the school-level estimates less sensitive to problems of volatility in the model fitting: If there were few pupils near the cut-off or if the pupils at the cut-off were disproportionately high or low attaining, a model allowing the age effect to vary at school level may attribute too much or too little variance to maturity, biasing the added-year effect.
In some respects, the NC scale is highly suitable for RD analysis as the NC levels are designed to be a single scale tracking attainment from age 5 to age 14. Also, these levels are widely understood by teachers and are aligned with tests at age 7, 11, and 14. Nevertheless, the quality of the teacher-assessed performance measures is less than ideal. Scores are recorded in NC sublevels, with each sublevel representing about eight months of typical progress. Teachers used evidence of pupils’ work, their professional knowledge, and the results of classroom tests to assess pupils’ attainment level against best-fit NC level descriptors. It is questionable whether teacher assessment is entirely reliable and whether the interpretation of the level criteria will be consistent across teachers or the full age range. To examine this problem, the MGP report compares the teacher-assessed levels to those obtained in the Key Stage (KS) 2 and 3 examinations (DfE, Citation2011, p. 41). Agreement between the teacher-assessed levels varied from 56% to 77% in KS2 writing, from 36% to 95% for KS2 reading, and from 64% to 89% in KS2 mathematics. Some of the discrepancy stems from differences in timing between the two measures, with teachers’ scores being lower than the examined results due to being recorded some time earlier (DfE, Citation2011). The correspondence between the teacher-assessed levels and the examination levels increased over the time period from 2008 to 2010 due to moderation activities which took place in schools during the study. The quality was found to improve as the “processes bedded” (DfE, Citation2011, p. 7). The analysis in the present paper is confined to the mathematics outcome data, which had higher consistency and showed little systematic tendency to be biased in a particular direction.
Another weakness of the data relates to the NC scale used for the performance measures: As well as not being as finely grained as would be desired, it is questionable whether the NC levels can be considered an interval scale (where the magnitude of differences between levels is consistent across the scale). On inspection, however, the scores were normally distributed with no obvious ceiling or floor effects. It is likely that the school-level estimates, especially for smaller cohorts, will be affected by these problems in the data. Note, however, that the problems will affect all measures (e.g., inconsistency in teacher assessment across adjacent NC years will also be present for longitudinal estimates as pupils move across NC years).
Model specifications – value-added models
In the analysis which follows in the next section, performance (P) of pupils (i), within cohorts (j), within schools (k) was compared across the 3 years (t) for which data are available. Note that performance (P) strictly refers to the teacher-assessed mathematics point scores at Time periods 1, 2, and 3, where the time period is given in subscript.
The value-added measure used in this study is a simple contextualised value-added measure. As well as controlling for performance in the previous time period, the CVA model used controls for prior attainment at age 7 (Key Stage 1), free school meals status (a binary measure of poverty), and gender. This is thought a good compromise between the risk of non-school factor bias and overcorrection of the model (see above). School-level averages were also considered in earlier analyses but found to have a negligible effect on overall results and are not included in what follows.
Value-added scores for school cohorts were estimated using multilevel models, where the residual variance was partitioned between school level (u) and pupil level (e) and the school-level residual recorded as the value-added score of the school for time period t. The school-level residual can be considered a value-added score for the school as it gives the mean difference of the schools’ pupils’ actual scores from their predicted scores based on the model. The model is formally specified as follows:
School- and pupil-level residuals are calculated in a multilevel model such that:
Ten CVA measures were produced, one for each cohort-time combination emboldened and italicised in . These are referred to below as cohort-time combinations i to x, where i to v refer to NC Years 4, 5, 6, 8, and 9 in T2, respectively, and vi to x refer to the same NC years in T3. All of these had a prior performance score for the given individuals available, and a corresponding RD estimate could be produced for two consecutive year groups within a single school (i.e., not spanning separate primary and secondary schools as would be the case between Year 6 and Year 7).
In summary, the CVA measure estimates cohort performances by comparing each cohort’s level of attainment to its attainment in the previous time period, adjusting this for KS1 attainment and a small number of contextual variables. The CVA estimates look at a given cohort’s attainment across two time periods (left to right in ).
Model specifications – regression discontinuity models
The RD model separates an age effect (pupil maturity) from an added-year effect (the school effect) using two or more consecutive school year groups. The first RD estimate (RD_i) is calculated using Year 3 cohort B and Year 4 cohort C, both from Time period 2, so looking vertically up . The corresponding CVA score for Year 4 cohort C (CVA_i) is calculated using the performance of Year 4 cohort C in Time period 2 compared with its performance in Time period 1. Both of these are designed to estimate a school effect for Year 4 cohort C in Time period 2. The basic model used is identical to that used in Luyten et al. (Citation2009) with the exception that age is recorded in months rather than days, as discussed above.
The basic RD model (RD1) is formally stated below. In this case, the cohort (j) refers to the cohort for which the school effect estimate is desired pooled with the consecutive cohort below it. The age variable is calculated as the difference in age in months from the August before the cut-off, with July scored as 1, June as 2, and so forth.
Note that the intercept term, β0k, and the coefficient on the added-year effect (Year) both refer to a specific school (k). To estimate a school effect, the coefficient on the added-year effect (β2k) can be separated into an overall fixed effect of an added year of schooling for all schools and a school-specific deviation (S2j) (Luyten et al., Citation2009), as follows:
This was calculated for each cohort (j) at a time. Each school-specific deviation, above, therefore corresponds to a given cohort in a given school. This RD model is specified based on that in Luyten et al. (Citation2009, p. 147), whose results this study replicates in relation to the two RD applications (cross-sectional and longitudinal). One technical difference to note is that the age-within year variable is used rather than an age relative to the cut-off variable. This saves computing a new variable for when pupils are used (a) as the lower year and baseline for performance estimates of the year above and (b) as the upper year for estimates of their own performance. The difference in interpretation of the results this has is that the coefficient on the added-year effect gives the gross added-year effect. To estimate the added-year effect net of the age (maturity) effect, one can multiply the age effect coefficient by 12 and subtract this from the gross added-year effect (as below). This minor technical difference also applies to the second RD model, discussed presently.
There are two key concerns with this basic RD model. First, the RD design makes the simplifying assumption that the consecutive cohort below the cohort in question acts as a suitable control group. To estimate the impact of this assumption, what will be called a longitudinal RD model (LRD) will be calculated. In line with the longitudinal estimates in Luyten et al. (Citation2009), this model is actually a gain score (difference in performance between two time periods) calculated using the longitudinal data from which the monthly age effect, as calculated in a RD model (and multiplied by 12), is subtracted. The LRD model combines simple arithmetic and the RD design to estimate an absolute added-year effect of schooling (with the effects of maturity accounted for). While this loses the cross-sectional advantages of RD, it ensures that the added-year effect can be attributed to improvement in the cohort’s performance rather than potential variability across cohorts and allows this assumption to be tested.
The second concern with the RD design related to whether it can produce like-for-like comparisons between school performances. RD estimates the absolute effect of an added year. If the improvement due to an extra year of schooling differs according to pupil ability or other characteristics, differences in school scores will reflect differences in intake as well as school effects. While still an accurate measure of absolute effect size, comparisons across schools’ relative scores will not be like for like, and comparison with the CVA estimates would be problematic. To take this possibility into account, a further model for the RD (RD2) was produced where the school-specific added-year effects were adjusted to account for any interaction between the added year effect and pupil characteristics (Luyten et al., Citation2009). The RD2 measure was produced from the original RD1 measure by adding interaction terms as in Luyten (Citation2006). Further details are given in the relevant results section.
In the school-level analysis, each CVA estimate is compared with three other models: RD1, a basic regression discontinuity model estimating the added-year effect using two consecutive year groups; RD2, a RD model which corrects for cohort prior attainment and takes any interaction between contextual factors and the added-year effect into account; and LRD, which calculates a simple gain score across two time periods and adjusts this by age effects estimated using a RD design, producing a longitudinal measure of the absolute school effect.
Results
RDD estimates – initial inspection
An initial inspection of the data indicated that the data were suitable for VA and RD analysis. This analysis found that 0.5% of pupils were in the “wrong” year group according to the age cut-off. Also 3.1% of the cases were missing age data or had conflicting data across time periods. These cases (n = 5372, 3.6% of the total) were omitted from the analysis. These cases were generally spread across schools: 54.4% of schools had none, 43.9% of schools had more than zero but fewer than 5%, and six schools (of 342) had between 5.7% and 11.1% of pupils who had missing or conflicting age data.
Rates of missing data were also low for other variables: Compliance with the DfE study was high. There were multiple opportunities to collect contextual data, across time periods (T1 to T3) and datasets (NPD and MGP). Missingness for gender and free school meals (poverty) variables was almost 0%. The highest rate of missingness for the contextual variables was the KS1 prior attainment score, for which 5.7% of pupils had no score. For the main mathematics performance outcomes, Study years T1, T2, and T3 had 1.6%, 0.9%, and 0.8% of pupil scores missing, respectively.
Initial estimates showed generally consistent age and grade effects (see below), although some volatility was apparent in the monthly scores (age effect). In this dataset, there are approximately 1,000 pupils for each month, and this volatility did not obscure the clear overall linear trend. This might, however, be a concern for future use of the RD as this linearity is likely to break down to exhibit a “saw tooth” pattern in smaller samples, making the effect of maturity difficult to discern.
1. What is the system-level absolute effect of additional years of schooling on pupil performance?
The system-level absolute school effects were estimated in several ways, which were then compared: first, within the RD1 model looking across two consecutive year groups at a time; second, using the multiple cut-off design used in Kyriakides and Luyten (Citation2009); and, third, using a series of linear regressions of National Curriculum (NC) level on age within year. All gave highly similar results. The similarity of these models is to be expected given that they are only minor variations of functional form fitted to the same data. Minor differences stemmed from the precise samples and specifications used for each estimate. The RD1 design, for example, calculated the age effect across 2 consecutive years, the linear regression calculated it for a single NC year at a time, and the multiple cut-off design made the estimate depend on the precise functional form of the age effect and added-year effect. In relation to specifying the age effect, the impact of adding quadratic and cubic forms of the age effect was negligible across all models. This result contrasts with that of Luyten et al. (Citation2009), who found a quadratic term improved model fit. It may be that the more fine-grained measure for age used in Luyten et al. (Citation2009) increased the explanatory power of the quadratic term.
The most appropriate fit for the added-year effect was to treat each NC year effect independently (either in a series of linear regressions or by using a dummy variable for each NC year). This was because the rate of annual progress was neither constant nor followed a clear trend: The average progress made in a year of schooling across the whole sample was approximately 3 NC points, with Year 6 – a year when national examinations are taken – exceeding this and other NC years tending to be slightly lower. This is in line with the design of the NC where 3 points are expected per year, see , below.
Table 3. Added-year effects by national curriculum year.
can be used to calculate the mean NC point score for the average pupil. This can be found by taking pupils’ relative age within the year (where August = 0, July = 1… September = 11), multiplying this by the age effect and adding this to the constant for their year group. The fitted values for the NC score by age given in are illustrated in . Note that the age effect is allowed to vary in this model, giving small differences in slope gradients.
Figure 1. Mean pupil performance (NC Scores) by pupil relative age in months.
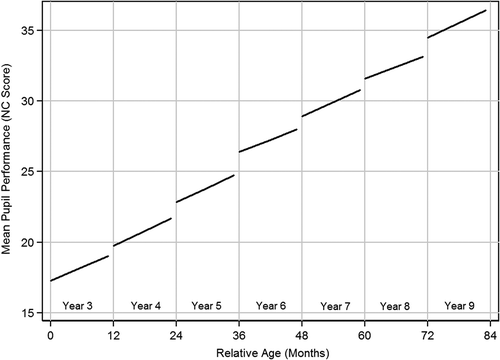
The overall mean age effect (per month) is approximately 0.17. This means that each year will see pupils making 2.04 points (12 x 0.17) of progress due to maturity alone. In this sense then, 2.04/3.00 (68%) of the observed improvement from year to year by pupils across this sample is due to pupil maturity, and 32% is attributed to the effect of schooling. This is slightly lower than the estimate of 38% for England found in Luyten (Citation2006) and much lower than his figures for other countries studied (55%–75%). Looking at English reception (age 4–5) classes, Luyten et al. (Citation2009) found around 50% of the effect was attributable to the school.
2. Do absolute school effects differ according to ability or other contextual factors?
To test whether the size of the added-year effect systematically varied according to pupil characteristics, the basic RD measure (RD1) was extended to include interaction effects. Three contextual variables were examined: gender, free school meals (FSM) eligibility (a measure of poverty), and mean cohort prior attainment, as measured by the cohorts’ Key Stage 1 (age 7) national examination scores.
Entering prior ability into the model proved problematic as the strength of prior attainment variables as predictors resulted in value-added-like models being produced when specifying prior attainment as per the other interaction variables. The intention was to keep the model analogous to the RD1 but to ensure that there were no systematic biases which would reduce the value of the comparison with the CVA measure. To achieve this, a two-step procedure was followed where, first, adjusted measures were produced from the original RD1 measure by adding contextual and interaction terms as described in Luyten (Citation2006). This step added the gender and free school meals variables, in line with the CVA measure (see above). As in Luyten (Citation2006), the main effects of these variables as well as their interaction with the added year were examined. The full results of this first step for all measures (i to x) are given in Appendix 1 and are summarised below. The cohort added-year effects which were produced using this design were then adjusted using a linear regression of the added-year effect on cohort-level mean KS1 attainment. The residual from this model was used as the final RD2 measure.
The results of the first step of the analysis can be summarised as follows: A pupil’s gender being male predicted lower mathematics scores by between about a fifth and two fifths of a NC point, but the interaction effect with this and the added-year effect was inconsistent. FSM status predicted between about 1.5 and 2.5 NC levels lower attainment (or about a year’s progress) as a main effect. It also had a substantial interaction effect of about 0.2 to 0.4 NC points, or about 1 to 2 months’ lower progress (per year) than pupils not eligible for free school meals. This suggests that not only are pupils who are eligible for FSM about a year behind their peers, on average, they also fall further behind each year. The interaction effect between FSM and progress was fairly consistent across all measures with the exception of the measures concerning progress from Year 5 to 6 and the final estimate. In these years, FSM had smaller and more inconsistent effects (one of which was positive). This is most likely due to the influence of the Key Stage 2 national examinations in this year and the fall in sample size in the final year (see ).
The second step of the analysis, examining the relationship between the adjusted RD estimate (Step 1) and cohort mean performance, gave inconsistent results. It might be that controlling for prior attainment in a second step resulted in the contextual variables from the first step acting as a proxy for prior attainment due to multicollinearity. This may have inflated the estimates from the first step as well as causing inconsistent results in the second. This should be kept in mind when interpreting the associations between the contextual factors and attainment or progress. As the intention is to create an unbiased measure which can be compared with a CVA measure, however, this is not held to be especially problematic.
3. To what extent does the absolute school effect vary between schools?
To this point, overall school effects across the whole sample have been examined. We now look at the relative school effect. Correlations between all four measures are compared in the final research question (Research question 4, below). Before this, the distributions of each measure are examined. gives summary statistics for the distribution created using each measurement, including the range and standard deviation.
Table 4. Estimated school (cohort) effects on attainment for each measurement design.
These results show large differences in the average annual rate of progress for each cohort. These are most clearly seen in the LRD. Some cohorts made as much as a year’s more or less progress than the expected rate. The adjusted models produced estimates less extreme than this with the RD1 and RD2 measures giving the least extreme differences between rates of progress between schools.
4. How similar are school-level estimates of effectiveness produced using a value-added (VA), contextualised value-added (CVA), cross-sectional regression discontinuity (RD) and a longitudinal regression discontinuity (LRD) design?
The key intention of this paper was to compare various VA and RD measures of the school effect. shows the correlation between the CVA measure for each study year and national curriculum year combination and the three measures created using variations on a regression discontinuity design.
Table 5. The correlation between the value-added measure and four regression discontinuity measures for the corresponding study/national curriculum year.
These correlations can be summarised as follows: the CVA and LRD measures have high to very high correlations. The RD designs generally yield moderate correlations with the CVA measure, but in some cases correlations are as low as 0.28. Correlations between LRD and RD1 (not shown) range from 0.26 to 0.65 with a mean of 0.46; this correlation between school effects for individual schools is lower than the figure of 0.71 (in mathematics) found in Luyten et al. (Citation2009), although Luyten et al.’s (Citation2009) result was for English 4- and 5-year-olds in 18 schools.
Recall that the LRD is an estimate of absolute progress using the actual recorded progress in longitudinal data, whereas the RD makes the assumption that the lower cohort of two consecutive cohorts can be used as a control group for the upper cohort. The simple explanation for these results, then, is that the assumption that the lower year in a RD acts as a suitable baseline to judge the absolute effect of the year does not consistently hold and, therefore, differences between the estimates are driven by volatility between different cohorts within the same school. This explanation was supported by follow-up analyses which found (a) considerable differences in (CVA and LRD) performance for different cohorts in a given school at a single point in time and (b) a high degree of instability in the measures over time.
Discussion
Main findings
The CVA and RD1 estimates in this paper were consistently positively related but showed only small to moderate correlations (0.28 to 0.64). These are lower than the correlation of 0.71 between VA and RD mathematics measures found in Luyten et al. (Citation2009). The LRD model clearly demonstrated the key reason for the discrepancy between the CVA and RD models by testing the assumption that consecutive cohorts are equivalent. The CVA and LRD measures showed high to very high correlations, indicating that both measures captured the differing rates of progress for the cohorts concerned almost identically.
Implications for the use of value-added measures
This research has found that estimates produced using the CVA model were very highly correlated to an absolute gain score produced using longitudinal changes in performance on a common scale. In this sense, the CVA measure is working as intended to capture difference in relative performance of pupils using measures of prior attainment. There are, however, a couple of caveats to note.
School-level differences in relative progress imply but do not necessarily entail that the difference can be causally attributed to performance of the school in question. As observed in an earlier section, value-added estimates are approximate to some degree and are vulnerable to unobserved biases, particularly in estimates for individual schools or their comparison. Also, additional analyses highlighted a substantial degree of inconsistency between the performance of cohorts and instability in the measures over time. Much of this is likely to be due to the limitations in the teacher-assessed performance measure which have been discussed. Nonetheless, causal attribution, consistency, and stability have been a longstanding concern with value-added measures more generally (see, e.g., Coe & Fitz‐Gibbon, Citation1998; Dumay, Coe, & Anumendem, Citation2014; Mandeville & Anderson, Citation1987; Marsh, Nagengast, Fletcher, & Televantou, Citation2011; Teddlie & Reynolds, Citation2000; Telhaj, Adnett, Davies, Hutton, & Coe, Citation2009), leading to advice on best research practice such as the following:
On the basis of existing research it is apparent that estimates of schools’ effectiveness based on one or two measures of students’ educational outcomes in a single year are of limited value. Ideally, data for several years (three being the minimum to identify any trends over time) and several outcomes are needed. (Teddlie & Reynolds, Citation2000, p. 126)
This study also concludes that the use of estimates based on single cohorts in single years is likely to be highly misleading.
The validity and use of regression discontinuity designs to estimate school effects
These results suggest that results obtained using the cross-sectional RD design at the level of individual schools are likely to reflect differences between cohorts in addition to the added-year effect as intended. The RD suffers from the problem of instability between cohorts to a far greater extent than the CVA and LRD measures as it relies on the assumption that a smaller group of pupils within the same school (but in the lower cohort) are a suitable baseline for estimating the progress made by the cohort in question. The ability of value added to draw on the whole sample to produce statistical expectations of performance has, in this study, led to results which are almost identical in terms of correlation to the absolute school effect produced using a LRD measure. Despite these difficulties at school level, results suggest that regression discontinuity remains a powerful design for larger cross-sectional studies where this problem will not be apparent and absolute measures of performance are valuable. The RD design produced very clear and consistent estimates of how performance varies with maturity and schooling. Indeed, a focus on system-level performance and the factors influencing school effectiveness over a large sample has been the more common use of the RD to date. Where, unlike VA, RD produces estimates which are not relative and so can be used to identify changes in system-level or area-level performance over time, as has been demonstrated here using recent English data.
Conclusion
These results have proved a valuable test of the RD and VA measurement designs. Strengths and weaknesses of each measure were discussed above. The results suggest that VA is capturing genuine differences in the performances of pupils, insofar as the underlying performance measure is valid, and that RD is suitable for producing absolute measures across systems and large groups of schools. For the school-level estimates from all measurement designs, the problem of causal attribution remains. Moreover, given the levels of instability found, questions remain on the extent to which any measured school outcomes reflect meaningful and stable properties of the schools, departments, and teachers in question. Certainly, the principle that measures spanning several years, cohorts, and outcomes are vital to say anything meaningful about school performance and avoid misleading results is emphasised by this study.
Acknowledgements
The author would like to thank Peter Davies and Stephen Gorard for their ongoing support and helpful comments for this paper. Thanks also go to the ESRC for funding the author’s doctoral research programme from which this paper arises.
Disclosure statement
No potential conflict of interest was reported by the authors.
Additional information
Funding
Notes on contributors
Thomas Perry
Thomas Perry is a Research Fellow at the University of Birmingham currently working on an evaluation project funded by the Educational Endowment Foundation (EEF). His current research focuses on school performance measurement across academic and wider outcomes of schooling. He is particularly interested in education policy relating to school improvement, organisation, and governance.
References
- Allen, R., & Burgess, S. (2012). How should we treat under-performing schools? A regression discontinuity analysis of school inspections in England. Bristol, UK: CMPO.
- Benton, T. (2014). The relationship between time in education and achievement in PISA in England (Working paper). Cambridge, UK: Cambridge Assessment.
- Bloom, H. S. (2012). Modern regression discontinuity analysis. Journal of Research on Educational Effectiveness, 5, 43–82.
- Cahan, S., & Cohen, N. (1989). Age versus schooling effects on intelligence development. Child Development, 60, 1239–1249.
- Cahan, S., & Davis, D. (1987). A between-grade-levels approach to the investigation of the absolute effects of schooling on achievement. American Educational Research Journal, 24, 1–12. doi:10.2307/1162850
- Cahan, S., & Elbaz, J. G. (2000). The measurement of school effectiveness. Studies in Educational Evaluation, 26, 127–142.
- Coe, R., & Fitz‐Gibbon, C. T. (1998). School effectiveness research: Criticisms and recommendations. Oxford Review of Education, 24, 421–438.
- Crawford, C., Dearden, L., & Greaves, E. (2013). The drivers of month of birth differences in children’s cognitive and non-cognitive skills: A regression discontinuity analysis (IFS Working Paper W13/08). Retrieved from http://www.ifs.org.uk/wps/wp201308.pdf
- Crawford, C., Dearden, L., & Meghir, C. (2010). When you are born matters: The impact of date of birth on educational outcomes in England (IFS Working Paper W10/06). Retrieved from http://www.ifs.org.uk/wps/wp1006.pdf
- Creemers, B. P. M., Kyriakides, L., & Sammons, P. (2010). Methodological advances in educational effectiveness research. Abingdon, UK: Routledge.
- Department for Education. (2011). How do pupils progress during Key Stages 2 and 3? (Research Report DFE-RR096). Retrieved from https://www.gov.uk/government/uploads/system/uploads/attachment_data/file/182413/DFE-RR096.pdf
- Dumay, X., Coe, R., & Anumendem, D. N. (2014). Stability over time of different methods of estimating school performance. School Effectiveness and School Improvement, 25, 64–82. doi:10.1080/09243453.2012.759599
- Evans, H. (2008). Value-added in English schools. Retrieved from http://citeseerx.ist.psu.edu/viewdoc/download?doi=10.1.1.178.9363&rep=rep1&type=pdf
- Heck, R., & Moriyama, K. (2010). Examining relationships among elementary schools’ contexts, leadership, instructional practices, and added-year outcomes: A regression discontinuity approach. School Effectiveness and School Improvement, 21, 377–408.
- Kyriakides, L., & Luyten, H. (2009). The contribution of schooling to the cognitive development of secondary education students in Cyprus: An application of regression discontinuity with multiple cut-off points. School Effectiveness and School Improvement, 20, 167–186.
- Lenkeit, J. (2013). Effectiveness measures for cross-sectional studies: A comparison of value-added models and contextualised attainment models. School Effectiveness and School Improvement, 24, 39–63. doi:10.1080/09243453.2012.680892
- Luyten, H. (2006). An empirical assessment of the absolute effect of schooling: Regression-discontinuity applied to TIMSS-95. Oxford Review of Education, 32, 397–429.
- Luyten, H., Peschar, J., & Coe, R. (2008). Effects of schooling on reading performance, reading engagement, and reading activities of 15-year-olds in England. American Educational Research Journal, 45, 319–342. doi:10.3102/0002831207313345
- Luyten, H., Tymms, P., & Jones, P. (2009). Assessing school effects without controlling for prior achievement? School Effectiveness and School Improvement, 20, 145–165.
- Luyten, H., & Veldkamp, B. (2011). Assessing effects of schooling with cross-sectional data: Between-grades differences addressed as a selection-bias problem. Journal of Research on Educational Effectiveness, 4, 264–288.
- Mandeville, G. K., & Anderson, L. W. (1987). The stability of school effectiveness indices across grade levels and subject areas. Journal of Educational Measurement, 24, 203–216.
- Marsh, H. W., Nagengast, B., Fletcher, J., & Televantou, I. (2011). Assessing educational effectiveness: Policy implications from diverse areas of research. Fiscal Studies, 32, 279–295. doi:10.1111/j.1475-5890.2011.00137.x
- Organisation for Economic Co-operation and Development. (2008). Measuring improvements in learning outcomes: Best practices to assess the value-added of schools. Paris, France: Author.
- Reynolds, D., Sammons, P., De Fraine, B., Van Damme, J., Townsend, T., Teddlie, C., & Stringfield, S. (2014). Educational effectiveness research (EER): A state-of-the-art review. School Effectiveness and School Improvement, 25, 197–230. doi:10.1080/09243453.2014.885450
- Sammons, P. (1996). Complexities in the judgement of school effectiveness. Educational Research and Evaluation, 2, 113–149.
- Sammons, P., & Luyten, H. (2009). Editorial article for special issue on alternative methods for assessing school effects and schooling effects. School Effectiveness and School Improvement, 20, 133–143. doi:10.1080/09243450902879753
- Shadish, W. R., Cook, T. D., & Campbell, D. T. (2002). Experimental and quasi-experimental designs for generalized causal inference. Belmont, CA: Wadsworth Cengage learning.
- Teddlie, C., & Reynolds, D. (2000). The international handbook of school effectiveness research. Abingdon, UK: Routledge.
- Telhaj, S., Adnett, N., Davies, P., Hutton, D., & Coe, R. (2009). Increasing within‐school competition: A case for department level performance indicators? Research Papers in Education, 24, 45–55.
- Thomas, S. (2001). Dimensions of secondary school effectiveness: Comparative analyses across regions. School Effectiveness and School Improvement, 12, 285–322.
- Trochim, W. M. K. (1984). Research design for program evaluation: The regression-discontinuity approach. Newbury Park, CA: Sage.
- Tymms, P. (1996). Theories, models and simulations: School effectiveness at an impasse. In J. Gray, D. Reynolds, C. Fitz-Gibbon, & D. Jesson (Eds.), Merging traditions: The future of research on school effectiveness and school improvement (pp. 121–135). London, UK: Cassell.
- Tymms, P. (1999). Baseline assessment and monitoring in primary schools: Achievements, attitudes and value-added indicators. London, UK: David Fulton.
- Tymms, P., & Albone, S. (2002). Performance indicators in primary schools. In A. J. Visscher & R. Coe (Eds.), School improvement through performance feedback (pp. 191–218). Lisse, The Netherlands: Swets & Zeitlinger.
- Vardardottir, A. (2013). Peer effects and academic achievement: A regression discontinuity approach. Economics of Education Review, 36, 108–121.