
ABSTRACT
In a constantly changing world, schools need to adapt. Difficulties, successes, and experienced challenges can be important driving forces for school improvement. This study aims to develop a comprehensive understanding of the situation and decision-making processes related to school improvement strategies in socially disadvantaged areas, where schools face particularly challenging circumstances. The study comprises data from 100 Austrian schools, that is, answers to open-ended questions in a survey. A mixed-methods approach was applied. The qualitative data were analyzed using qualitative content analysis. The data were processed, frequencies of themes were determined, and latent profile analysis was applied. The results show the diversity of challenges, difficulties, strengths, and development perspectives reported by schools. The results of the latent profile analysis indicate that there are different underlying profiles in the orientation of development perspectives towards strengths, difficulties, challenges, and/or not identified factors.
Introduction
In a constantly evolving world, it is necessary for all schools to learn and adapt to a changing external environment, facilitating and sustaining organizational change and innovation (Creemers & Kyriakides, Citation2008; Kools et al., Citation2020; Schechter et al., Citation2004). There are schools that face particularly challenging circumstances. The challenges are manifold. A major challenge of schools in socially deprived areas is, for example, the high number of students from socially disadvantaged families who have lower educational aspirations and less access to institutionalized educational resources, which in turn can create an unfavorable learning environment (Baumert et al., Citation2006; Klein, Citation2017). Because of the various challenges, schools in socially deprived areas tendentially need to put more effort into their school development to overcome difficulties.
Schools can change and improve through intentional development processes, undertaken by the members of the schools themselves (Emmerich & Maag Merki, Citation2014; Holtappels & Rolff, Citation2010). This change can occur at a specific time and with a specific goal in mind or in an ongoing process. For a continuous school development process, it is essential to establish structures and processes that facilitate ongoing growth, enabling the school to effectively address its evolving challenges. A school in an ongoing development process can be understood as a learning organization (Klein, Citation2017). The overall goal of this study is to gain a deeper understanding of schools in socially deprived areas and their school improvement process.
School improvement processes
Schools as learning organizations
Learning organizations are defined “as those with a capacity to adapt and compete through learning” (Organisation for Economic Co-operation and Development [OECD], Citation2010, p. 20). Learning organizations are considered a multilevel concept. This means that it is assumed that learning is required at the individual, group, and school levels in order for schools to adapt to changing environmental conditions (OECD, Citation2010).
Learning at the group and/or school level implies a social framework and is therefore a social activity. The school principal and teachers interact with each other and are shaped by collaboration and discourse (Reusser & Pauli, Citation2015). Learning occurs when members of the teaching staff collaboratively engage in continual review of their pedagogical work, considering structures, processes, and outcomes. Through this process, they develop problem-solving skills and foster a shared vision (Holtappels & Rolff, Citation2010; Klein, Citation2017; Michalsky & Schechter, Citation2013; Pauli & Reusser, Citation2000). These learning processes at the group and school level require a school principal to create organizational structures (e.g., time and space) and an organizational culture, which encourage learning, cooperation, and participation.
Literature on learning processes of organizations strongly focuses on learning from failures and difficulties. It is argued that individuals in organizations tend to learn consciously when frustrated in the face of failure and disruption or by irritations (Faulstich, Citation2014; Schechter et al., Citation2004). Situations of failure thus encourage individuals in organizations to consider alternatives and to question usual work patterns. While situations of failure prompt individuals in organizations to explore alternative options for usual work patterns, it is argued that learning from success only leads to confirmation of previous expectations. Reinforcing old routines would limit the search for new approaches while increasing risk aversion (Benoliel & Berkovich, Citation2021; Zakay et al., Citation2004). In this sense, a crisis can be seen as a strong motivator for learning. However, it is not certain that learning from failures and crises always succeeds. Focusing solely on learning outcomes following failure excludes other important avenues of organizational learning. First, it can be argued that even changes that are not a threat but rather a challenge in the sense of a demanding event that requires an effort to be successfully mastered can stimulate learning (Karsten et al., Citation2000). Second, success can be an important driving force for learning and change too (Karsten et al., Citation2000; Schechter et al., Citation2004). It is argued that learning from successes (Edmondson, Citation2011; Ellis et al., Citation2014; Schechter et al., Citation2004): (a) has motivational benefits, (b) reduces defensiveness, (c) increases awareness of effective practices and leads to change by drawing attention to practices that are different from those that are less successful, (d) reduces defensiveness because employees’ self-esteem and positive social image are not threatened as they are with failures, and (e) creates positive organizational memory. In summary, following the literature on learning processes in organizations, not only failures or difficulties but also challenges and successes can serve as valuable learning opportunities.
Evidence-based school improvement processes
Schools are increasingly expected to base their improvement strategies on evidence. It is assumed that analyzing the situation of schools using data will increase informed decision making about development perspectives, particular interventions, and the corresponding allocation of resources, thereby improving teaching and learning in a cost-effective manner (Ikemoto & Marsh, Citation2007; Schildkamp, Citation2019).
According to Ikemoto and Marsh’s (Citation2007) framework for data-based decision making, various forms of data, such as data on structural and process characteristics, student outcomes, and the satisfaction of various stakeholders, first need to be transformed into information through analysis. The analysis results in an overview about the situation of schools (e.g., strengths, difficulties, and/or challenges). Then teachers and school principals convert information into actionable knowledge by judging the priority of information. The emerged actionable knowledge can in turn be used to support different decisions on school improvement processes. For example, schools can decide for development perspectives that build on existing strengths, reduce difficulties, or address challenges. Depending on the analysis of data and prioritization of information, similar raw data can lead to different decisions. Ikemoto and Marsh also point out that data-based decision making in practice is not necessarily linear or continuous. In real-world school settings, teachers and school principals face challenges and competing demands on their time and attention. It is therefore possible that they may skip steps in the process or rely on their intuition.
Current research results on (evidence-based) school improvement processes
There are only a few studies that investigate how school staff’s use of data affects the academic achievements of students. Most of these studies examine the effect of interventions that focus on solving educational problems by analyzing and using data. Some of these studies showed that analyzing and using data had a positive impact on student achievement (Lai et al., Citation2014; Slavin et al., Citation2013). Other studies revealed mixed results. Poortman and Schildkamp’s (Citation2016) intervention study showed that about half of the data use teams were unable to solve their problem. About half of the data teams could significantly increase student achievement. The intervention study of Carlson et al. (Citation2011) found subject-related differences. They found that analyzing data and adopting and implementing well-evaluated interventions had a positive effect on students’ mathematics achievement, but not on reading achievement. Michalsky and Schechter (Citation2013) have integrated systematic learning from problematic and successful experiences into teacher preparation programs. Using a quasi-experimental design, they examined how this learning affects pre-service teachers’ ability to teach self-regulated learning to students. The results suggest that pre-service teachers who referred to both problematic and successful experiences when reflecting with mentors and peers improved more in their actual teaching of self-regulated learning strategies and their actual design of self-regulated learning environments. Research on evidence-based school improvement also shows that teachers vary in the extent to which they base their decisions on data and that many teachers collect data more intuitively (Demski, Citation2017; Vanlommel & Schildkamp, Citation2019). These differences also become manifest at the school level, as there are schools that use data more intensively than other schools (Demski, Citation2017).
To date, there have been few studies on differences between school types in the school improvement process. There is some evidence indicating school form differences. For example, it was shown that primary school principals spend more time in the classroom observing lessons and are more likely to use the various staff development tools than principals in other school types (Heck, Citation1992; Thillmann et al., Citation2015). Demski’s (Citation2017) findings also suggest that teachers from primary schools are more likely to use data.
Evidence-based school improvement of schools in socially deprived areas
There is limited research on the learning processes and evidence-based school improvement of schools in socially deprived areas. Research findings on evidence-based school improvement of schools in socially deprived areas are twofold. On the one hand, research shows that analyzing and using data is particularly effective for schools with a high proportion of students with low socioeconomic status (van Geel et al., Citation2016). On the other hand, there is also evidence that evidence-based school improvement increases pressure on schools in socially deprived areas, which can lead to negative consequences. Thus, pressures might tempt or force schools to (a) adopt instructional strategies that are more likely to be effective but not necessarily good or even unproblematic, (b) focus more on improving evaluation results instead of addressing individual needs, and (c) choose technical-rational strategies that are more likely to avoid risk (Morley, Citation2006; West et al., Citation2006).
Purpose of the study and research questions
The overall goal of this study is to gain a deeper understanding of schools in socially deprived areas and their school improvement process. Thus, in order to obtain an overall picture, the strengths, difficulties, challenges, and development perspectives of schools in socially deprived areas are examined. The first research question is:
(RQ1) What (a) strengths, (b) difficulties, (c) challenges, and (d) development perspectives are reported by school principals of schools in socially deprived areas?
According to literature on learning processes of organizations, failures or difficulties, challenges, as well as successes or strengths can be considered learning opportunities (Faulstich, Citation2014; Karsten et al., Citation2000; Schechter et al., Citation2004). However, there is also evidence that schools do not make school improvement decisions on a purely rational basis, for example, on the basis of objective data. There is a research desideratum, as existing research focuses strongly on failure or difficulty, there is limited research on learning organizations in relation to student achievement, and there are few findings on evidence-based school development in different school types. This study aims to examine whether schools attempt to build on existing strengths, reduce difficulties, address challenges, and/or base decisions on neither the strengths, difficulties, nor challenges analyzed by the schools (we refer to this latter as “not identified factors”).
According to the literature on data-driven decision making, schools use different sources of data. Decisions in the school improvement process are made depending on the analysis of the data and the prioritization of the information. The study also aims to explore possible differences in the school improvement process of primary and middle schools as well as successful and less successful schools in terms of student achievement. This results in the research question:
(RQ2) What are the underlying profiles of the orientation of development perspectives towards strengths, difficulties, challenges, and/or not identified factors in (a) schools in socially deprived areas, (b) primary schools, (c) middle schools, (d) schools that perform above the statistically expected value in the educational standard assessment, and (e) schools that perform under the statistically expected value in the educational standard assessment?
Method
Sample
This study focuses on schools in socially deprived areas in Austria. The classification as a school in a socially deprived area was based on an index provided by the Federal Institute for Quality Assurance in the Austrian School System (IQS), which depicts the composition of the students in relation to their socioeconomic situation (everyday language of the students, educational background, and socioeconomic factors of the parental home). The sample comprises 100 schools in socially deprived areas, including 55 elementary schools and 45 middle schools. Based on the 2018 educational standards in the domains German and mathematics conducted by IQS, not only the actual scores achieved in both domains can be determined but also the value that would have been expected taking into account various control variables (e.g., students’ socioeconomic background) – the so-called statistically expected value. Forty schools were selected that were above the statistically expected value in both domains, 41 schools were selected that were below the statistically expected value in both domains, and 19 schools had mixed profiles, for example, performing below in German and above in mathematics.
Data collection
The data have been collected within a project conducted in cooperation between the Federal Ministry of Education, Science and Research of Austria and the University of Vienna. The goal of this project is to gain a better understanding of how schools deal with particular conditions. The schools in the project receive additional resources according to specific needs. These resources are to be linked to a sustainable school improvement process.
In 2021, as a first step of the project, school principals were asked (after consulting with teachers) to analyze their current situation in a questionnaire with open-response format. Among other things, the questionnaire asked what the schools’ strengths, difficulties, and challenges in their daily work are (maximum 1,500 characters per question):
Within the framework of the project “100 schools – 1000 opportunities”, challenges of their special situation are to be addressed pedagogically by schools in order to give students fair educational opportunities.
With regard to this goal, we as a school succeed particularly well …
With regard to this goal, we as a school are not yet succeeding …
What makes it difficult for us to achieve this goal. The three biggest challenges …
Data analysis
To answer the research questions, a mixed-method-approach was used. The methodological procedure includes multiple steps:
Qualitative analysis: The qualitative data were analyzed using qualitative content analysis (Mayring, Citation2012):
Basic models of educational effectiveness distinguish between three basic dimensions: structural conditions (input), actions/interventions (process), and student learning outcomes (outcome). They also take into account the levels of action: educational system, school, classroom, and student level (Ditton, Citation2000). In line with these theoretical assumptions, a category system was developed that comprises two dimensions: (i) the basic dimensions of educational effectiveness and (ii) the levels of actions in the school system. Combining both dimensions creates a grid of 4 by 3 boxes. Categories were assigned to each box based on theory and empirical findings. The categories were complemented by our data.
Two researchers independently applied the category system to the data.
The labels assigned independently by both researchers were cross-checked. The assignment of labels was finalized and a joint probability of agreement calculated (is good; ω = .88).
Quantitative analysis:
The data were prepared for further analyses in that the codes were converted into numerical values. Matches between development perspectives and strengths, difficulties, as well as challenges were determined. For example, when they report that cooperation between teachers is not going well and they want to implement interventions to improve cooperation, this is one match between a developmental perspective and a difficulty. The frequencies of matches between development perspectives and strengths, development perspectives and difficulties, and development perspectives and challenges were determined per school. The frequency of development perspectives that match neither strengths, difficulties, nor challenges was also determined (referred to as not identified factors).
The frequencies of the categories mentioned in relation to strengths, difficulties, challenges, and development perspectives (RQ 1a–d) were calculated (IBM SPSS, Version 27). A latent profile analysis was conducted using Mplus 8.7 (Muthén & Muthén 1998–2021) to examine the underlying profiles in the orientation of development perspectives towards strengths, difficulties, challenges, or not identified factors (RQ 2a–e). Latent profile analysis is a person-centered mixture modeling analysis. It is used to identify subgroups of an underlying latent variable with data from cross-sectional designs. The number of profiles was determined by two statistical criteria. The Bayesian information criterion (BIC) is used to select the model (Magidson & Vermunt, Citation2004; Nylund et al., Citation2007). The model with the lowest BIC is preferable. The entropy index is used to evaluate the separability of latent profiles (Celeux & Soromenho, Citation1996). The index indicates the predicted probabilities for profile membership and ranges from 0 to 1 (from complete absence of separability to perfect separation of profiles). Moreover, to decide on the best fitting model and the number of profiles, in addition to relying on model fit indicators, we took theoretical and content-related considerations into account (Spurk et al., Citation2020). In this respect, we considered it a substantive criterion that the profile solution was also suitable for addressing the research questions.
Results
Strengths, difficulties, challenges, and development perspectives of schools in socially deprived areas (RQ1)
In the questionnaire, schools report various strengths, difficulties, challenges, and development perspectives. For each of these issues, the three most frequently mentioned aspects are presented.
Strengths of schools (RQ 1a)
Participating schools see many of their own strengths (see for a complete overview of reported strengths). A majority of schools report that they are doing well in creating a positive school culture (76 schools) and positively highlight the principles of good teaching at the school (72 schools). Cooperation between teachers is also frequently mentioned as a strength (57 schools).
Table 1. Frequency table – strength of schools in socially deprived areas.
Difficulties of schools (RQ 1b)
When schools were asked about their difficulties, many schools reported (see for a complete overview of reported difficulties) the cooperation with families and parental work (68 schools), the disadvantageous prerequisites (e.g., due to insufficient language skills), and an unfavorable composition of the student body (53 schools), as well as principles of good teaching (e.g., team teaching; 49 schools).
Table 2. Frequency table – difficulties of schools in socially deprived areas.
Challenges of schools (RQ 1c)
Schools report a wide variety of challenges (see for a complete overview of reported challenges). Most schools report that they are challenged by the lack of human resources (68 schools), the poor condition of the school building and the facilities in the rooms (64 schools), and the disadvantageous prerequisites of the students and an unfavorable composition of the student body (64 schools).
Table 3. Frequency table – challenges of schools in socially deprived areas.
Development perspectives of schools (RQ 1d)
In the questionnaire, participating schools were also asked in which scope(s) they would like to develop as a school (see for a complete overview of reported development perspectives). Many schools report that they want to improve in the area of principles for good teaching (67 schools), formal structure within the school (e.g., internal school evaluations; 32 schools), and school culture (31 schools).
Table 4. Frequency table – development perspective of schools in socially deprived areas.
Orientation of development perspectives (RQ2)
A latent profile analysis was conducted to examine the underlying profiles in the orientation of development perspectives towards strength, difficulties, challenges, or not identified factors. Using latent profile analysis, this study shows that schools can be separated along their overall frequency of orientations towards strength, difficulties, challenges, or not identified factors rather than their specific preference for one orientation or another.
All schools (RQ 2a)
The model fits of the latent profile analyses with all schools indicate that there are three basic profiles in the orientation of development perspectives (see and ). One group of schools (Profile A) shows a low but balanced orientation of development perspectives towards reported strengths, difficulties, and challenges. Compared to these orientations, this group of schools has a higher mean score for development perspectives that are based on not identified factors. Another group of schools (Profile B) shows a frequent orientation of development perspectives towards difficulties, while being less orientated towards strengths and challenges. Compared to these orientations, this group of schools has a higher mean score for the development perspectives that are based on not identified factors. A third group of schools (Profile C) shows a frequent orientation of development perspectives towards strengths and not identified factors, while being less orientated towards challenges and difficulties.
Figure 1. Latent profile analysis – all schools.
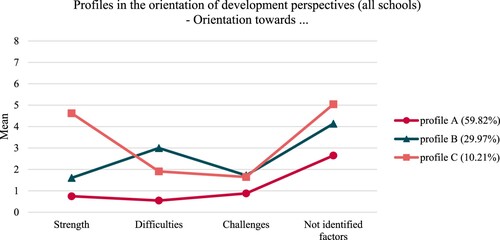
Table 5. Model fit for latent profile analysis with different numbers of profiles.
Primary schools (RQ 2b)
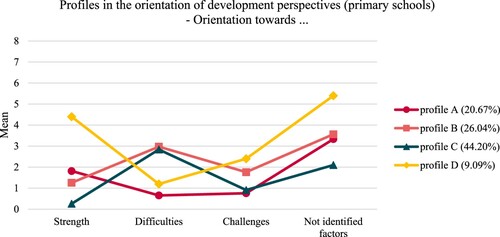
In primary schools, four profiles were detected (see and ). One group of primary schools (Profile A) shows a low but balanced orientation of development perspectives towards strengths, difficulties, and challenges. Compared to these orientations, Profile A schools have a higher mean score of development perspectives that are based on not identified factors. Another group of primary schools (Profile B) shows a frequent orientation of development perspectives towards strengths, while being less orientated towards challenges and difficulties. Compared to these orientations, this group of schools has a higher mean score for development perspectives that are based on not identified factors. A third group of primary schools (Profile C) shows a frequent orientation of development perspectives towards difficulties and not identified factors, while being orientated less towards strengths and challenges. A fourth group of primary schools (Profile D) shows (similar to Profile C schools) a moderate orientation of development perspectives towards difficulties, while being less orientated towards strengths and challenges. Profile D schools, however, have lower mean scores than Profile C schools. Compared to the orientation towards strengths, difficulties, and challenges, primary schools of Profile D have a higher mean score for development perspectives that are based on not identified factors.
Figure 2. Latent profile analysis – primary schools.
Middle schools (RQ 2c)
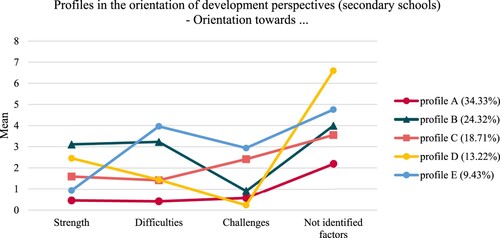
Five profiles were identified in middle schools (see and ). One group of middle schools (Profile A) has a low but balanced orientation of development perspectives towards strengths, difficulties, and challenges. Compared to these orientations, Profile A schools have a higher mean score of development perspectives that are based on not identified factors. A second group of middle schools (Profile B) shows a strong orientation towards strengths, difficulties, and not identified factors, while being less orientated towards challenges. Another group of middle schools (Profile C) shows a moderate orientation towards strengths and difficulties, while being slightly more orientated towards challenges and not identified factors. A fourth group of middle schools (Profile D) shows a relatively strong orientation towards strengths, while being moderately orientated towards difficulties and hardly orientated towards challenges. However, this group of middle schools has a higher mean score on development perspectives that are based on not identified factors than on orientations towards strengths, difficulties, or challenges. A fifth group of middle schools (Profile E) is less orientated towards strength, while being more orientated towards difficulties and challenges. Profile E schools show a higher mean score on development perspectives that are based on not identified factors than on orientations towards strengths, difficulties, or challenges.
Figure 3. Latent profile analysis – middle schools.
Schools that perform above the statistically expected value in the educational standard assessment (RQ 2d)
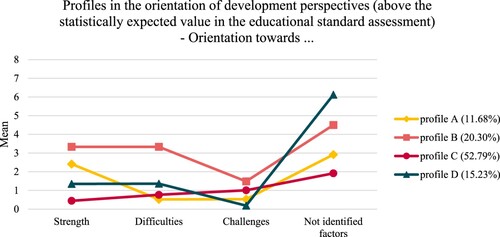
In schools that perform above the statistically expected value in the educational standard assessment, four profiles were detected (see and ). One group of schools that perform above the statistically expected value in the educational standard assessment (Profile A) shows a strong orientation towards strengths and not identified factors, while being less orientated towards challenges and difficulties. A second group of schools that perform above the statistically expected value in the educational standard assessment (Profile B) shows a strong orientation towards strengths, difficulties, and not identified factors, while being less orientated towards challenges. A third group of schools that perform above the statistically expected value in the educational standard assessment (Profile C) shows a low orientation of development perspectives towards strengths, difficulties, and challenges, with a slight tendency towards difficulties, challenges, and development perspectives that are based on not identified factors. A fourth group of schools that perform above the statistically expected value in the educational standard assessment (Profile D) shows a moderate orientation towards strengths and difficulties, while being hardly orientated towards challenges. The Profile D group has a higher mean score of development perspectives that are based on not identified factors.
Figure 4. Latent profile analysis – schools that perform above the statistically expected value in the educational standard assessment.
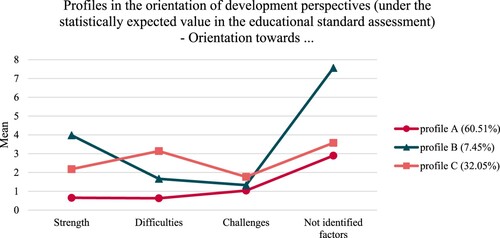
Schools that perform under the statistically expected value in the educational standard assessment (RQ 2e)
In schools that perform under the statistically expected value in the educational standard assessment, three profiles were detected (see and ). One group of schools that perform under the statistically expected value in the educational standard assessment (Profile A) shows a low but balanced orientation of development perspectives towards strengths, difficulties, and challenges, while being more orientated towards development perspectives that are based on not identified factors. Another group of schools that perform under the statistically expected value in the educational standard assessment (Profile B) shows a strong orientation of development perspectives towards strength, while being less orientated towards challenges and difficulties. Compared to these orientations, this group of schools has a higher mean score of development perspectives that are based on not identified factors. A third group of schools that perform under the statistically expected value in the educational standard assessment (Profile C) shows a strong orientation of development perspectives towards difficulties and not identified factors, while being less orientated towards strength and challenges.
Figure 5. Latent profile analysis – schools that perform under the statistically expected value in the educational standard assessment.
Discussion
The overall goal of this study was to broaden the previous focus in research on problems and to gain a deeper understanding of schools in socially deprived areas. Research results that the high number of students from socially disadvantaged families is experienced as a challenge by schools in socially deprived areas can be confirmed (e.g., Klein, Citation2016).
The results of this study regarding the first research question show that the most commonly reported strengths, difficulties, and challenges are consistent with findings from previous studies (e.g., Meyers & Murphy, Citation2007; Muijs et al., Citation2004; Racherbäumer & van Ackeren, Citation2015). The results show the diversity of challenges and difficulties faced by schools in socially deprived areas, but also the diverse strengths and development perspectives. While some self-reported challenges, strengths, difficulties, and development perspectives are mentioned occasionally, there was a high level of agreement on other aspects. The differences that are evident in schools in socially disadvantaged areas – despite a similar composition of the student body – have already been highlighted in other studies (e.g., Racherbäumer & van Ackeren, Citation2015). The differences between schools in socially deprived areas emphasize the importance of context, as already stated by various authors (e.g., Teddlie & Stringfield, Citation2006). There is consensus among researchers and practitioners that there are no easy solutions, no quick fixes, and no “one solution for all” when it comes to school improvement challenges (Harris, Citation2002; Huber, Citation2018; Muijs et al., Citation2004). Rather, the differences between schools require school improvement strategies that are tailored to the particular context, the unique circumstances, and the particular development need of the individual school (Harris, Citation2002; Huber, Citation2018).
A second aim of this study was to examine whether schools attempt to build on existing strengths, reduce difficulties, address challenges, or base their decisions about development perspectives on factors that were not identified in the course of the present research. The results of the latent profile analysis regarding the second research question show that there are different underlying profiles in the orientation of development perspectives towards strengths, difficulties, challenges, or not identified factors. One group of schools (Profile A) based their decisions regarding development perspective more strongly on strength and not identified factors. In the school improvement process, this group of schools tends to build, at least in part, on the school’s strengths. Another group (Profile B) based their decisions regarding development perspective mainly on difficulties and not identified factors. This group of schools mostly directs the school development process at reducing the difficulties of the school. A third group of schools shows a strong orientation towards not identified factors while being less orientated towards strength, difficulties, and challenges.
In general, the results of this study show a notable amount of development perspectives that are based on not identified factors. As noted by Ikemoto and Marsh (Citation2007), principals and teachers in real settings may skip steps in the process of data-driven decision making or rely on their intuition due to a lack of resources (e.g., lack of time and teaching staff). This may be especially the case for schools in socially deprived areas that face particularly challenging circumstances and possibly even more so for the third group of schools (Profile C). It is also possible that principals and teachers in these groups of schools may have less data literacy. As a result, they may be less able to collect and analyze data, generate actionable knowledge, and derive actions from it. Because of the pressures of evidence-based school improvement, it is also possible that schools may be adopting strategies that they believe other stakeholders expect to see or strategies that they expect to have a quick impact on students (Morley, Citation2006; West et al., Citation2006). It is also worth noting that the mean values of the development perspective based on the not identified factors vary in the different profiles. In line with research results of Vanlommel and Schildkamp (Citation2019) and Demski (Citation2017), this could indicate that school principals (and their teachers) use data to varying degrees.
The profile groups in elementary and middle schools seem to differ. The only group of schools found in both elementary and secondary schools orients their development perspectives more towards not identified factors and less towards strengths, difficulties, and challenges. The findings further suggest that school principals (and their teachers) of elementary and middle schools differ in their emphasis on orientation towards strengths, difficulties, challenges, and not identified factors. Due to the small sample size, significance could not be tested, so the differences between primary and middle schools should be interpreted very carefully. However, Demski’s (Citation2017) research finding that elementary schools are more likely to use data cannot be supported by the findings of this study.
The profile groups in schools that perform above and under the statistically expected value in the educational standard assessment also seem to differ. The only group of schools found to be very similar orient their development perspectives more towards not identified factors and less towards strengths, difficulties, and challenges. The orientation of development perspectives towards strengths and difficulties tends to be more balanced across several groups in schools that perform above the statistically expected value on educational standard assessment. This supports the findings of Schechter et al. (Citation2008), which show that pre-service teachers who referred to both problematic and successful experiences when reflecting with mentors and peers improved their teaching more. Tendentially, development perspectives based on not identified factors occur somewhat more frequently in schools that score under the statistically expected value on educational standard assessment. It is possible that principals (and teachers) in schools that perform under the statistically expected value on educational standard assessment may have less data literacy. This means that they may be less able to collect data, analyze them, generate actionable knowledge, and derive actions from it. In consequence, they could rely more on their intuition. However, again, these differences should be interpreted very carefully, as significance tests could not be performed due to the small sample size.
Conclusion and implications
Results for the first research question show the heterogeneity of reported strengths, difficulties, challenges, and development perspectives. These results emphasize the importance of school contexts. Rather than quick fixes or one-size-fits-all solutions, school improvement strategies or approaches are needed that are tailored to each school’s particular context, unique circumstances, and development needs (Harris, Citation2002; Huber, Citation2018).
The results for the second research question also show heterogeneity in the approach to school improvement processes as schools do not only orient themselves in one direction. Schools therefore try to build on existing strengths, reduce difficulties or overcome challenges, and/or base decisions about development perspectives on not identified factors. The heterogeneity of answers – especially with regard to the development perspective – and the diversity of development approaches suggest that there is no one right reform, intervention, or development approach for all schools in socially deprived areas. This underlines the importance of schools themselves to actively contribute to school improvement. However, the high orientation of development perspectives on not identified factors suggests that schools may not have the resources to always go through all steps of data-based decision making, may have a low data literacy, or act on (assumed) expectations of other stakeholders (external factors). Hence, teachers and school principals may still have difficulty analyzing different data sources, processing the resulting information, and deriving development actions from the resulting knowledge. In order to successfully and sustainably implement evidence-based school improvement in schools, schools need to be provided with enough resources and trained in data literacy.
Limitations, strengths, and outlook
A limitation of this paper can be seen in the fact that the study is based on self-reports. Thus, the results are based on self-perceived and not objectively determined strengths, difficulties, and challenges. Another limitation is that the latent profile analysis is based on a small sample. This limits the power of the analyses. Therefore, the analyses had to be performed separately for the school types and schools that performed above and below the statistically expected value in educational standard assessment. Thus, the differences must be interpreted very carefully, as it is not possible to test for significance. Future large-scale studies should investigate if the group differences are significant. Future studies should also examine the effect of different orientation profiles on student outcomes (e.g., student achievement, learning motivation, or student’s well-being). The motivations behind the identified orientations could also be examined in more detail, as previous studies have shown that the pressure on schools in socially disadvantaged areas facing particularly difficult conditions is very high. This could give valuable insights into the reasons why schools want to build on existing strengths, reduce difficulties, address challenges, or base decisions on not identified factors.
Despite the limitations of this study, the results of this study provide an important insight into the different school improvement approaches of successful and less successful schools as well as primary and middle schools. This study showcases notable strengths by successfully challenging a deficit-oriented perspective and adopting an innovative mixed-method approach.
Acknowledgements
The data used in this paper were collected within a project conducted in cooperation between the Federal Ministry of Education, Science and Research and the University of Vienna. The aim of this project is to provide empirically validated evidence for the specific support of compulsory schools in challenging situations and for the effectiveness of these supportive interventions. Prior to conducting the research, the complete survey instrument as well as the planned procedure and a description of the research objectives were submitted to the Federal Ministry of Education, Science and Research, which approved of the study.
Disclosure statement
No potential conflict of interest was reported by the authors.
Correction Statement
This article has been corrected with minor changes. These changes do not impact the academic content of the article.
Additional information
Funding
Notes on contributors
Luisa Grützmacher
Luisa Grützmacher holds a PhD in Educational Science and is currently a post-doc researcher at the Centre for Teacher Education at the University of Vienna. Her research interests include educational effectiveness research and in particular the suitability of school effectiveness criteria, consistency of school effects, and educational equity. At present, her primary focus lies in the intensive examination of school development processes within socially deprived educational settings.
Julia Holzer
Julia Holzer is a post-doctoral researcher at the Department of Developmental and Educational Psychology at the University of Vienna. Her research focuses on lifelong learning in terms of educational motivation, well-being in educational contexts, and self-regulated learning, learning and teaching in schools with special challenges, as well as transfer and implementation of scientific findings into practice.
Marko Lüftenegger
Marko Lüftenegger is an associate professor for developmental and educational psychology of school age at the Centre for Teacher Education and the Faculty of Psychology at the University of Vienna. His research focuses on students’ development of motivation, social emotions, and self-regulated learning competencies in different domains from adolescence to early adulthood. In more applied orientated research, he focuses furthermore on the development and evaluation of trainings and intervention programs in different contexts.
Barbara Schober
Barbara Schober is Professor of “Psychological Research on Education and Transfer” at the Faculty of Psychology at the University of Vienna. She is co-chair of the faculty research topic “Psychology of Lifelong Learning”. Her research activities are focusing on lifelong learning, learning motivation and its development, gender differences in educational contexts and in careers, self-regulation, teacher training, development, evaluation, and implementation of intervention programs in educational contexts, gender differences, and implementation research.
Manfred Prenzel
Manfred Prenzel is Professor of Educational Research at the University of Vienna and serves there as director of the Centre for Teacher Education. The main topics of his research relate to issues of learning and teaching in different domains (science, mathematics, medicine, economics). He coordinated several quality development programmes as well as international large-scale assessments (PISA in Germany).
References
- Baumert, J., Stanat, P., & Watermann, R. (2006). Schulstruktur und die Entstehung differenzieller Lern- und Entwicklungsmilieus [School structure and the emergence of differential learning and development environments]. In J. Baumert, P. Stanat, & R. Watermann (Eds.), Herkunftsbedingte Disparitäten im Bildungswesen: Differenzielle Bildungsprozesse und Probleme der Verteilungsgerechtigkeit: Vertiefende Analysen im Rahmen von PISA 2000 (pp. 95–188). VS Verlag für Sozialwissenschaften.
- Benoliel, P., & Berkovich, I. (2021). Learning from intelligent failure: An organizational resource for school improvement. Journal of Educational Administration, 59(4), 402–421. https://doi.org/10.1108/JEA-07-2020-0155
- Carlson, D., Borman, G. D., & Robinson, M. (2011). A multistate district-level cluster randomized trial of the impact of data-driven reform on reading and mathematics achievement. Educational Evaluation and Policy Analysis, 33(3), 378–398. https://doi.org/10.3102/016237371141276
- Celeux, G., & Soromenho, G. (1996). An entropy criterion for assessing the number of clusters in a mixture model. Journal of Classification, 13(2), 195–212. https://doi.org/10.1007/BF01246098
- Creemers, B. P. M., & Kyriakides, L. (2008). The dynamics of educational effectiveness: A contribution to policy, practice and theory in contemporary schools. Routledge.
- Demski, D. (2017). Schulentwicklungsforschung: Vol. 2. Evidenzbasierte Schulentwicklung: Empirische Analyse eines Steuerungsparadigmas [School improvement research: Vol. 2. Evidence-based school improvement: Empirical analysis of a governance paradigm]. Springer VS.
- Ditton, H. (2000). Qualitätskontrolle und Qualitätssicherung in Schule und Unterricht. Ein Überblick zum Stand der empirischen Forschung [Quality monitoring and quality assurance in schools and classrooms. An overview of the state of empirical research]. In A. Helmke, W. Hornstein, & E. Terhart (Eds.), Qualität und Qualitätssicherung im Bildungsbereich; Schule, Sozialpädagogik, Hochschule (pp. 73–92). Beltz. https://doi.org/10.25656/01:8486
- Edmondson, A. C. (2011). Strategies for learning from failure. Harvard Business Review, 89(4), 48–55.
- Ellis, S., Carette, B., Anseel, F., & Lievens, F. (2014). Systematic reflection: Implications for learning from failures and successes. Current Directions in Psychological Science, 23(1), 67–72. https://doi.org/10.1177/0963721413504106
- Emmerich, M., & Maag Merki, K. (2014). Die Entwicklung von Schule. Theorie – Forschung – Praxis [The development of school. Theory – Research – Practice]. In B. Dippelhofer-Stiem & S. Dippelhofer (Eds.), Enzyklopädie Erziehungswissenschaft online: Erziehungs- und Bildungssoziologie, Makrosoziologische Analysen: Funktionen, Strukturen und Institutionen. Beltz Juventa. https://doi.org/10.3262/EEO20140338
- Faulstich, P. (2014). Lerndebatten [Learning debates]. In P. Faulstich (Ed.), Theorie Bilden: Vol. 34. Lerndebatten: Phänomenologische, pragmatistische und kritische Lerntheorien in der Diskussion (pp. 11–34). transcript.
- Harris, A. (2002). School improvement: What's in it for schools? Routledge.
- Heck, R. H. (1992). Principals’ instructional leadership and school performance: Implications for policy development. Educational Evaluation and Policy Analysis, 14(1), 21–34. https://doi.org/10.2307/1164525
- Holtappels, H. G., & Rolff, H.-G. (2010). Einführung: Theorien der Schulentwicklung [Introduction: Theories of school development]. In T. Bohl, W. Helsper, H. G. Holtappels, & C. Schelle (Eds.), UTB Schulpädagogik: Vol. 8443. Handbuch Schulentwicklung: Theorie – Forschungsbefunde – Entwicklungsprozesse – Methodenrepertoire (pp. 73–78). Julius Klinkhardt.
- Huber, S. G. (2018). No simple fixes for schools in challenging circumstances: Contextualization for Germany. In C. V. Meyers & M. J. Darwin (Eds.), International perspectives on leading low-performing schools (pp. 243–266). Information Age Publishing.
- Ikemoto, G. S., & Marsh, J. A. (2007). Cutting through the “data-driven” mantra: Different conceptions of data-driven decision making. Teachers College Record, 109(13), 105–131. https://doi.org/10.1177/016146810710901310
- Karsten, S., Voncken, E., & Voorthuis, M. (2000). Dutch primary schools and the concept of the learning organization. The Learning Organization, 7(3), 145–156. https://doi.org/10.1108/09696470010335863
- Klein, E. D. (2016). Zwillinge oder entfernte Verwandte? Strategien der Schulleitung in Schulen in deprivierter Lage in Deutschland und den USA [Twins or distant relatives? Strategies used by school leaders in schools in challenging contexts in Germany and the USA]. Zeitschrift für Bildungsforschung, 6(1), 5–23. https://doi.org/10.1007/s35834-015-0138-8
- Klein, E. D. (2017). Bedingungen und Formen erfolgreicher Schulentwicklung in Schulen in sozial deprivierter Lage: Eine Expertise im Auftrag der Wübben Stiftung [Conditions and patterns of successful school improvement in schools serving disadvantaged communities: A report commissioned by the Wübben Foundation] (SHIP Working Paper No. 01). https://doi.org/10.17185/duepublico/4438
- Kools, M., Stoll, L., George, B., Steijn, B., Bekkers, V., & Gouëdard, P. (2020). The school as a learning organisation: The concept and its measurement. European Journal of Education, 55(1), 24–42. https://doi.org/10.1111/ejed.12383
- Lai, M. K., Wilson, A., McNaughton, S., & Hsiao, S. (2014). Improving achievement in secondary schools: Impact of a literacy project on reading comprehension and secondary school qualifications. Reading Research Quarterly, 49(3), 305–334. https://doi.org/10.1002/rrq.73
- Magidson, J., & Vermunt, J. K. (2004). Latent class models. In D. Kaplan (Ed.), The SAGE handbook of quantitative methodology for the social sciences (pp. 175–198). SAGE Publications.
- Mayring, P. (2012). Qualitative Inhaltsanalyse – Ein Beispiel für Mixed Methods [Qualitative content analysis – An example of mixed methods]. In M. Gläser-Zikuda, T. Seidel, C. Rohlfs, A. Gröschner, & S. Ziegelbauer (Eds.), Mixed Methods in der empirischen Bildungsforschung (pp. 27–36). Waxmann.
- Meyers, C. V., & Murphy, J. (2007). Turning around failing schools: An analysis. Journal of School Leadership, 17(5), 631–659. https://doi.org/10.1177/105268460701700504
- Michalsky, T., & Schechter, C. (2013). Preservice teachers’ capacity to teach self-regulated learning: Integrating learning from problems and learning from successes. Teaching and Teacher Education, 30, 60–73. https://doi.org/10.1016/j.tate.2012.10.009
- Morley, A. (2006). The development of leadership capacity in a school facing challenging circumstances. In M. Ainscow & M. West (Eds.), Improving urban schools: Leadership and collaboration (pp. 24–34). Open University Press.
- Muijs, D., Harris, A., Chapman, C., Stoll, L., & Russ, J. (2004). Improving schools in socioeconomically disadvantaged areas – A review of research evidence. School Effectiveness and School Improvement, 15(2), 149–175. https://doi.org/10.1076/sesi.15.2.149.30433
- Nylund, K. L., Asparouhov, T., & Muthén, B. O. (2007). Deciding on the number of classes in latent class analysis and growth mixture modeling: A Monte Carlo simulation study. Structural Equation Modeling: A Multidisciplinary Journal, 14(4), 535–569. https://doi.org/10.1080/10705510701575396
- Organisation for Economic Co-operation and Development. (2010). Innovative workplaces: Making better use of skills within organisations. https://doi.org/10.1787/9789264095687-en
- Pauli, C., & Reusser, K. (2000). Zur Rolle der Lehrperson beim kooperativen Lernen [On the role of the teacher in cooperative learning]. Schweizerische Zeitschrift für Bildungswissenschaften, 22(3), 421–442. https://doi.org/10.25656/01:3747
- Poortman, C. L., & Schildkamp, K. (2016). Solving student achievement problems with a data use intervention for teachers. Teaching and Teacher Education, 60, 425–433. https://doi.org/10.1016/j.tate.2016.06.010
- Racherbäumer, K., & van Ackeren, I. (2015). Was ist eine (gute) Schule in schwieriger Lage? Befunde einer Studie im kontrastiven Fallstudiendesign an Schulen in der Metropolregion Ruhr [What is a (good) school in a challenging situation? Findings of a study in a contrastive case study design at schools in the Ruhr metropolitan region]. In L. Fölker, T. Hertel, & N. Pfaff (Eds.), Brennpunkt(-)Schule: Zum Verhältnis von Schule, Bildung und Urbaner Segregation (pp. 189–208). Verlag Barbara Budrich. https://doi.org/10.2307/j.ctvdf0dt8.13
- Reusser, K., & Pauli, C. (2015). Co-constructivism in educational theory and practice. In J. D. Wright (Ed.), International encyclopedia of the social & behavioral sciences (2nd ed., pp. 913–917). Elsevier. https://doi.org/10.1016/B978-0-08-097086-8.92026-9
- Schechter, C., Sykes, I., & Rosenfeld, J. (2004). Learning from success: A leverage for transforming schools into learning communities. Planning and Changing, 35(3/4), 154–168.
- Schechter, C., Sykes, I., & Rosenfeld, J. (2008). Learning from success as leverage for school learning: Lessons from a national programme in Israel. International Journal of Leadership in Education, 11(3), 301–318. https://doi.org/10.1080/13603120701576274
- Schildkamp, K. (2019). Data-based decision-making for school improvement: Research insights and gaps. Educational Research, 61(3), 257–273. https://doi.org/10.1080/00131881.2019.1625716
- Slavin, R. E., Cheung, A., Holmes, G., Madden, N. A., & Chamberlain, A. (2013). Effects of a data-driven district reform model on state assessment outcomes. American Educational Research Journal, 50(2), 371–396. https://doi.org/10.3102/0002831212466909
- Spurk, D., Hirschi, A., Wang, M., Valero, D., & Kauffeld, S. (2020). Latent profile analysis: A review and “how to” guide of its application within vocational behavior research. Journal of Vocational Behavior, 120, Article 103445. https://doi.org/10.1016/j.jvb.2020.103445
- Teddlie, C., & Stringfield, S. (2006). A brief history of school improvement research in the USA. In A. Harris & J. H. Chrispeels (Eds.), Improving schools and educational systems: International perspectives (pp. 23–38). Routledge.
- Thillmann, K., Brauckmann, S., Herrmann, C., & Thiel, F. (2015). Praxis schulischer Personalentwicklung unter den Bedingungen der Neuen Steuerung [Practice of school personnel development under the conditions of New Management]. In H. J. Abs, T. Brüsemeister, M. Schemmann, & J. Wissinger (Eds.), Educational governance: Vol. 26. Governance im Bildungssystem: Analysen zur Mehrebenenperspektive, Steuerung und Koordination (pp. 195–228). Springer VS. https://doi.org/10.1007/978-3-658-06523-2_8
- van Geel, M., Keuning, T., Visscher, A. J., & Fox, J.-P. (2016). Assessing the effects of a school-wide data-based decision-making intervention on student achievement growth in primary schools. American Educational Research Journal, 53(2), 360–394. https://doi.org/10.3102/0002831216637346
- Vanlommel, K., & Schildkamp, K. (2019). How do teachers make sense of data in the context of high-stakes decision making? American Educational Research Journal, 56(3), 792–821. https://doi.org/10.3102/0002831218803891
- West, M., Ainscow, M., & Stanford, J. (2006). Achieving sustainable improvements in urban schools. In M. Ainscow & M. West (Eds.), Improving urban schools: Leadership and collaboration (pp. 46–57). Open University Press.
- Zakay, D., Ellis, S., & Shevalsky, M. (2004). Outcome value and early warning indications as determinants of willingness to learn from experience. Experimental Psychology, 51(2), 150–157. https://doi.org/10.1027/1618-3169.51.2.150