
Abstract
Similarity is an important concept in music cognition research since the similarity between (parts of) musical pieces determines perception of stylistic categories and structural relationships between parts of musical works. The purpose of the present research is to develop and test models of musical similarity perception inspired by a transformational approach which conceives of similarity between two perceptual objects in terms of the complexity of the cognitive operations required to transform the representation of the first object into that of the second, a process which has been formulated in information-theoretic terms. Specifically, computational simulations are developed based on compression distance in which a probabilistic model is trained on one piece of music and then used to predict, or compress, the notes in a second piece. The more predictable the second piece according to the model, the more efficiently it can be encoded and the greater the similarity between the two pieces. The present research extends an existing information-theoretic model of auditory expectation (IDyOM) to compute compression distances varying in symmetry and normalisation using high-level symbolic features representing aspects of pitch and rhythmic structure. Comparing these compression distances with listeners’ similarity ratings between pairs of melodies collected in three experiments demonstrates that the compression-based model provides a good fit to the data and allows the identification of representations, model parameters and compression-based metrics that best account for musical similarity perception. The compression-based model also shows comparable performance to the best-performing algorithms on the MIREX 2005 melodic similarity task.
1. Introduction
Similarity is fundamental to the perception and understanding of musical works. It is necessary for identifying repeated patterns within music, which in turn informs the perception of motifs, grouping structure and form. Without some measure of similarity we would be unable to make cultural or stylistic judgements about music or to categorise musical works by genre. Consequently, similarity also plays a fundamental role in Music Information Retrieval (MIR) where content-based retrieval of music requires a similarity measure to compute the distance between the query and potential matches in the datastore. Such methods have largely relied on the extraction of acoustic feature vectors from audio (e.g. MFCCs, chromagrams) and using machine learning methods to classify audio files into groups. Reviewing this research, Casey et al. (Citation2008) suggest that: ‘To improve the performance of MIR systems, the findings and methods of music perception and cognition could lead to better understanding of how humans interpret music and what humans expect from music searches’ (p. 692).
In the present research, a cognitively motivated computational model of musical similarity is developed and tested. The model is based on information-theoretic principles capturing the simplicity of the transformation required to transform one melody into another. Specifically two musical objects are similar to the extent that a model of one can be used to generate a compressed representation of the other. Previous research in MIR has used compression distance to classify music using symbolic representations such as MIDI (Hilleware, Manderick, & Conklin, Citation2012; Cataltepe, Yaslan, & Sonmez, Citation2007; Li & Sleep, Citation2004; Cilibrasi, Vitányi, & de Wolf, Citation2004; Meredith, Citation2014) and audio representations (Ahonen, Citation2010; Cataltepe et al., Citation2007; Li & Sleep, Citation2005; Foster, Mauch, & Dixon, Citation2014). Compression distance is applied to high-level musical features known to be used in cognitive representationsof musical melody and the resulting system is evaluated as a cognitive model by comparing its similarity ratings with human judgements of perceived musical similarity.
The paper is organised as follows. First, different approaches to modelling similarity in psychology and cognitive science (Section 1.1) and the application of these models in research on the perception of musical similarity specifically (Section 1.2) are reviewed. A formal introduction to compression distance is provided (Section 1.3) and discussed in terms of its use in MIR research on music classification (Section 1.4). Section 2 contains a formal introduction to the IDyOM model of auditory expectation and its extension to modelling compression distance. Section 3 contains a summary of the method of three existing empirical studies of similarity perception (Müllensiefen & Frieler, Citation2004; Müllensiefen, Citation2004) providing perceptual similarity ratings for pairs of melodies that are used to assess the compression-based model. Section 4 presents a new analysis of the resulting data which assesses different compression-based similarity measures (varying in symmetry and normalisation), representational features concerning the pitch and timing of notes and other model parameters in terms of fit to the perceptual similarity ratings (including comparisons with other models not based on compression distance). Finally, the resulting compression-based models are compared to existing similarity algorithms in terms of performance on the MIREX 2005 melodic similarity task. Section 5 contains a discussion of the results, their relation to other work and important directions for future research.
1.1. Similarity in psychology and cognitive science
Similarity is a fundamental concept in psychology and cognitive science (Goldstone & Son, Citation2005); perceiving similarity between stimuli is necessary for categorisation of perceptual objects and generalisation of predictive inference across object categories. Broadly speaking, four approaches have been taken to building cognitive models of psychological similarity. First, geometric models (Shepard, Citation1987) represent objects of interest as points in a dimensionally organised metric space, often constructed using multi-dimensional scaling (MDS) on an original set of dimensions corresponding to object features. Second, set-theoretic models were introduced by Tversky (Citation1977) to address concerns that subjective perception of similarity does not always satisfy the assumptions (e.g. the triangle inequality and symmetry) of geometric models. In Tversky’s approach, similarity between two objects is a function of the number of categorical features that are common and distinctive between them. The third approach, alignment-based models (Markman & Gentner, Citation1993; Goldstone, Citation1996), were partly motivated by difficulties encountered by geometric and featural models in handling complex, structured representations. Inspired by research on analogical reasoning, these models emphasise the importance of matching between features that have some kind of structural correspondence within the two stimuli, following principles such as one-to-one mapping. Finally, transformational models conceive of similarity in terms of the number or complexity of operations needed to transform one object into another (Hahn & Chater, Citation1998; Hahn, Chater, & Richardson, Citation2003). Recent incarnations of this approach have operationalised the theory in terms information theory (Chater, Citation1996; Chater, Citation1999) and Kolmogorov complexity (Chater and Vitányi, Citation2003b; Chater and Vitányi, Citation2003a) as discussed further in Section 1.3. While alignment-based models have tended to be used to model high-level conceptual relations, research with transformational models has focused on issues of perception, such as those considered here (Goldstone & Son, Citation2005). Furthermore, the two approaches may be complementary if one views alignment as a process of minimising transformational distance (Hodgetts, Hahn, & Chater, Citation2009).
1.2. Modelling musical similarity perception
This section contains a review of computational models of musical, and in particular melodic, similarity perception that have been developed to date. Current approaches rely on two components: first, the representation of the musical surface; and second, the way in which similarity is computed. Musical representations vary from representations of melodic structure (e.g. pitch, melodic contour, pitch interval, inter-onset interval) to complex representations derived from music theory (e.g. features computed according to Narmour’s implication-realization model, (Graachten, Arcos, and de Mántaras, Citation2005)). Different approaches to modelling similarity have also been used, as discussed below.
1.2.1. Geometric models
Geometric models simply compute the Euclidean distance between two melodies represented as points in a geometrical space. In a study of similarity perception of folk song phrases, (Eerola and Bregman, Citation2007) analysed correlations between the behavioural similarity data and various structural features of the musical phrases representing contour (mean pitch, melodic direction), pitch content (entropy, range, proportion of tonic and dominant pitches), interval content (mean interval size, stepwise motion and triadic movement) and contour periodicity. MDS identified two dimensions: the first correlated significantly with pitch direction; the second was strongly correlated with pitch range. This featural approach towards musical similarity has a long tradition in ethnomusicology where, for example, it has been used to assist with the classification of folk songs (e.g. Bartók and Lord, Citation1951; Jesser, Citation1990).
1.2.2. Set-theoretic models
Set-theoretic models often use the original formulation of a ratio model by Tversky (Citation1977) in which two objects a and b are considered similar to the extent that they share salient categorical features:
where A and B are the set of features exhibited by a and b, respectively. The salience function f may reflect any factors that contribute to overall perceptual salience. In a study of musical plagiarism, Müllensiefen & Pendzich (Citation2009) tested a salience function based on the inverted document frequency (Manning & Schütze, Citation1999). However, the use of statistical information in defining salience blurs the boundary between this model and the transformational model described below.
1.2.3. Alignment-based models
Recent approaches have drawn on research in MIR (Gómez, Abad-Mota, & Ruckhaus, Citation2007) which has adapted the Needleman–Wunsch–Gotoh algorithm (Needleman & Wunsch, Citation1970; Gotoh, Citation1982) to music. For example, *vanKranenburgVolkEtAl09 used this similarity algorithm to test various scoring functions based on pitch features, harmonic relations, melodic contour, rhythm and metrical accent.
1.2.4. Transformational models
Edit distance (e.g. Levenshtein distance) may be viewed as a simple transformational model. Edit distance is defined as the minimum number of operation (insertions, deletions and substitutions) necessary to transform one sequence of symbols into another sequence of symbols. Edit distance has found many applications in symbolic MIR and analysis (e.g. Mongeau & Sankoff, Citation1990; Cambouropoulos, Crawford, & Iliopoulos, Citation1999; Uitdenbogerd, Citation2002). Although it has been considered a ‘crude’ measure in the psychological literature (Hahn et al., Citation2003), the results of (Müllensiefen and Frieler, Citation2004) suggest that edit distance can predict perception of melodic similarity fairly well. Nonetheless, compression distance provides a potentially more general and powerful approach. Although it has been used in MIR research on music classification by genre, composer and style (see Section 1.4), we are not aware of any research that has applied compression distance to modelling music similarity ratings. The present research aims to address this situation. The remainder of the introduction provides a formal introduction to compression distance (Section 1.3) and a discussion of its use in MIR research on music classification (Section 1.4).
1.3. Compression distance
(Li,Chen, Li, Ma, and Vitányi, Citation2004) introduce a compression-based measure of similarity called information distance. Given two sequences x and y, the conditional Kolmogorov complexity K(x|y) is the length in bits of the shortest binary program that can generate x as its only output from y, while K(x) is the special case when y is the empty sequence. The information distance between x and y can be defined as the shortest binary program that computes x given y and also computes y given x. Since the Kolmogorov complexity is non-computable, however, a compression algorithm is typically used to estimate the length of compressed encodings of x and y. Research has used dictionary compression software such as gzip based on Lempel–Ziv compression (Ziv & Lempel, Citation1977), block-sorting compression software such as bzip2 based on Burrows–Wheeler compression (Burrows and Wheeler, Citation1994; Seward, Citation2010) or statistical compression algorithms such as Prediction by Partial Match (PPM, Cleary & Witten, Citation1984; Cleary and Teahan, Citation1997). Given such an algorithm, the Normalised Compression Distance (NCD) between x and y is given by:(1)
where C(x) and C(y) are the length of compressed encodings of x and y, respectively, C(x|y) is the length of a compressed encoding of x given a model trained on y and C(x|y) is the length of a compressed encoding of x given a model trained on y. NCD satisfies the properties of a metric (Li et al., Citation2004):
For reasons of practicality when using existing compression software, C(x|y) is often computed as giving the following expression for NCD (Li et al., Citation2004):
1.4. Compression distance in MIR
MIR research has used NCD for music classification tasks. Cilibrasi et al. (Citation2004) used NCD to cluster MIDI files by genre (Rock, Jazz and Classical) and composer (Buxtehude, Bach, Haydn, Mozart, Beethoven, Chopin, Debussy) with some success. They used a standard lossless compression algorithm (bzip2) and binary MIDI files, which contain performance instructions for digital instruments and other formatting requirements in addition to relevant information about the pitch and timing of musical events. These representational issues plausibly limit performance (Li & Sleep, Citation2004) and certainly raise questions about cognitive plausibility. Furthermore, the evaluation consisted only of intuitive judgements about the trees returned by the system. Subsequent research has addressed these limitations to some extent.
(Li and Sleep, Citation2004) used NCD, operationalised using the LZW variant of LZ78 dictionary compression (Ziv & Lempel, Citation1978; Welch, Citation1984), in combination with a 1 Nearest Neighbour (1-NN) classifier to classify a collection 771 MIDI files into 4 categories: Beethoven, Haydn, Chinese and Jazz. They compare both relative and absolute pitch representations of melodies extracted from MIDI files by taking the highest sounding pitch at any given time point. The results were promising, yielding classification accuracies up to 92.4%, with NCD outperforming rival methods based on bigrams and trigrams and pitch interval representations outperforming absolute pitch representations. The authors note that the size of the respective categories in their data-set was not balanced and that future research should examine whether duration features also improves performance. (Li and Sleep, Citation2005) applied the same method to an audio data-set consisting of 100 30s examples from 10 musical genres. They investigated MFCC representations using various codebook sizes and audio frame lengths. Again the results were promising, yielding classification accuracies up to 80.72%.
Subsequent work failed to replicate such relatively good performance. Cataltepe et al. (Citation2007) used NCD and a 10-NN classifier to classify a data-set of 225 MIDI files by genre using absolute pitch representations of melody extracted from MIDI in the same way as Li & Sleep (Citation2004) and audio files generated from the MIDI files. Classification accuracy (75, 86 and 93% for MIDI, audio and a combined classifier, respectively) was worse than the performance of 95% previously obtained on the same data-set using a feature-based approach (McKay & Fujinaga, Citation2004). Ahonen (Citation2010) used NCD with bzip2 to classify 1000 30s audio excerpts by genre (10 genres, 100 pieces each) using MFCC features. The results yielded precision and recall scores between 40 and 50%.
Hilleware et al. (Citation2012) compared the performance of a range of different clustering methods, including NCD with bzip2 and a 1-NN classifier, for classifying 2198 folk songs according to the type of dance they represent. Pitch interval and inter-onset interval (IOI) representations were used. They also examine an n-gram method due to Conklin (Citation2013b) which, given a set of class labels c and event sequences e, uses supervised learning and Bayesian inference to compute the posterior probability of the class label given the sequence, p(c|e). Unlike NCD, it does not explicitly compute similarity between different sequences. The results revealed that the n-gram method outperformed all others, that higher-order n-gram models ( vs
) produced better performance and that rhythmic features yielded better classification than pitch features. The n-gram method yielded classification accuracies of 66.1% (pitch interval) and 76.1% (IOI) compared to 48% and 68% for NCD. Using an expanded set of corpora labelled by geographical region and genre, Conklin (Citation2013b) obtains further performance improvements using the n-gram method with larger sets of multiple viewpoint systems. In the present research, compression distance is implemented within a multiple viewpoint framework and applied to modelling musical similarity perception.
Meredith (Citation2014) suggests that rather than using general purpose compression algorithms such as gzip and bzip2, better classification performance might be obtained with compression algorithms specifically designed for producing compact structural analyses of symbolically encoded music, such as the SIA family of algorithms (Meredith, Lemström, & Wiggins, Citation2002). The algorithms were applied to the task of classifying 360 Dutch folk songs into tune families assigned by expert musicologists. A 1-NN classifier and leave-one-out cross-validation were used. The results showed that NCD classification performance was much better for SIA-based compression algorithms (COSIATEC in particular) yielding accuracies of up to 84%, than for bzip2, yielding a classification accuracy of 13%. Louboutin & Meredith (Citation2016) further examine the performance of LZ77 (Ziv & Lempel, Citation1977), LZ78 (Ziv & Lempel, Citation1978), Burrows–Wheeler compression (Burrows & Wheeler, Citation1994) and COSIATEC using different viewpoint representations (see Section 2.2) in classifying the Dutch folk songs. Using single viewpoint models, their own implementation of Burrows–Wheeler compression showed improved classification accuracy over bzip2 (73%), LZ77 performed reasonably well (up to 82% accuracy) but was outperformed by COSIATEC (85%). Ensembles of classifiers improved performance with the highest classification accuracy of 94% resulting from a combination of eight models (seven of which used LZ77). Performance is still lower than the method of Conklin (Citation2013b) (see above) which achieved a classification accuracy of 97% on the same corpus. In a second task, (Louboutin and Meredith, Citation2016) use LZ77 and COSIATEC to identify subject and countersubject entries in fugues by J. S. Bach. Although COSIATEC vastly outperformed LZ77 when notes were ordered by onset time and pitch, LZ77 showed a slight performance advantage over COSIATEC when the input was ordered by voice.
The present research differs from this previous work using NCD in two important respects. First, while previous work focuses on classification, the present research is concerned with compression distance as a model of similarity itself. This is important because the classification task used in the studies reviewed above plausibly has a sizeable impact on the results. For example, the fact that temporal features outperformed pitch features in results reported by Hilleware et al. (Citation2012) may be related to the fact that the classification task was specifically related to varieties of dance. Second, the present research is focused on understanding the perception of musical similarity while the work reviewed above has focused on practical tasks such as genre classification, composer identification or stylistic judgement (or in some cases, combinations of these) rather than perception. Although in some cases (e.g. Meredith, Citation2014), the target categories are derived from human judgements, the knowledge-driven analytical decisions of highly trained musicologists with specialist expertise is somewhat removed from the direct perception of musical similarity under investigation in the present research.
2. A Compression-based similarity model
2.1. Compression-based similarity measures
As discussed in Section 1.3, the implementation of compression distance requires a compression algorithm. Rather than using real-world compression software, a model is used to estimate the compressed length of musical sequences. This relies on the insight that it often proves useful to separate universal, lossless data compression algorithms into two parts (Bell, Witten, & Cleary, Citation1989; Rissanen & Langdon, Citation1981; Sayood, Citation2012): first, a model that describes any redundancy within the data (e.g. characters in text, bytes in a binary file or notes in a melody); second, an encoder that constructs a compressed representation of the message with respect to the information provided by the model. Under this interpretation, computing the compression-based similarity between two items only requires the model, it does not require the items actually to be compressed using the encoder. In the present research, a probabilistic model is used that estimates the probability of each element in the data.
In more detail, given a sequence x of length k, a model is required that returns the probability of each event in x, . Various models are possible but the focus here is on finite-context models (Bell, Cleary, & Witten, Citation1990; Bunton, Citation1997), which estimate the conditional probability of an event, given a context consisting of the n immediately preceding events:
(2)
The information content of an event given a model m, is:
(3)
and represents a lower bound on the number of bits required to encode a compressed representation of (Bell et al., Citation1990). Assuming that the model m is initially empty, C(x) in Equation (Equation1
(1) ) can be estimated by summing the information content of each event in x:
C(x|y), the compression distance between x and another sequence y, is obtained using a model
with prior training on y, yielding an unnormalised, asymmetric compression distance:
(4)
Since the two sequences being compared may be of different lengths, NCD (Li et al., Citation2004) normalises the compression distance between two sequences x and y with respect to the largest of their individual compressed lengths (see Equation (Equation1(1) )). It is also possible to normalise directly with respect to length. Li et al. (Citation2004) consider this possibility and note that it raises the question of whether to normalise with respect to the length of x or y (or the sum or maximum) and also that the resulting measure does not satisfy the triangle inequality. The first question may be addressed by dividing the sum expressed in Equation (Equation4
(4) ) by k, yielding the average per-event compression distance:
(5)
This is equivalent to an estimate of cross entropy used in computational linguistics to assess the accuracy of a model trained on a corpus in predicting a test set (Manning & Schütze, Citation1999). A symmetric version of this distance follows naturally:(6)
This has efficiency advantages since C(x) and C(y) need not be computed. Furthermore, the failure to satisfy the triangle inequality is not necessarily a concern here, given that the present goal is to model psychological similarity which may also violate the triangle inequality (see, e.g. Tverskey & Gati, Citation1982).
In the present research, (unnormalised, asymmetric),
(normalised, asymmetric) and
(normalised, symmetric) are assessed as models of human musical similarity perception and compared to
(see Equation (Equation1
(1) )) as a point of reference. To estimate the conditional probability of each note in a melody (see Equation (Equation2
(2) )), an existing probabilistic model of auditory expectation called IDyOM (Pearce, Citation2005) is used.Footnote1 IDyOM generates conditional event probabilities using a variable-order Markov model (Begleiter, El-Yaniv, & Yona, Citation2004) implementing the PPM* (Prediction by Partial Match) data compression scheme (Cleary & Witten, Citation1984; Cleary and Teahan, Citation1997; Bunton, Citation1997) to smooth together estimates from models of different order, thereby avoiding the limitations of fixed-order Markov models (Bell et al., Citation1990).
IDyOM also makes use of multiple viewpoint representations to enable the generation of predictions using different parallel representations of musical structure (Conklin & Witten, Citation1995; Pearce, Conklin, & Wiggins, Citation2005). This allows us to assess high-level symbolic representations of musical structure and identify those representations providing the best fit to human perception of musical similarity. Note that the use of different viewpoint representations does not supply IDyOM directly with information about the sequential structure of music, merely an enlarged set of representations for learning sequential structure from one of the stimulus pairs, which it can use to predict the other.
IDyOM has been found to predict accurately listeners’ melodic pitch expectations in behavioural, physiological and EEG studies (e.g. Pearce, Citation2005; Pearce, Ruiz, Kapasi, Wiggins, & Bhattacharya, Citation2010; Omigie, Pearce, & Stewart, Citation2012; Omigie, Pearce, & Stewart, Citation2013; Egermann, Pearce, Wiggins, & McAdams, Citation2013; Hansen & Pearce, Citation2014). Information content and entropy provide more accurate models of listeners’ pitch expectations and uncertainty, respectively, than rule-based models (e.g. Narmour, Citation1990; Schellenberg, Citation1996; Schellenberg, Citation1997), suggesting that expectation reflects a process of statistical learning and probabilistic generation of predictions (Hansen & Pearce, Citation2014; Pearce, Citation2005; Pearce et al., Citation2010). IDyOM has also been used to predict perceived phrase endings at troughs in the information content profile (Pearce & Wiggins, Citation2006; Pearce, Müllensiefen, & Wiggins, Citation2010). The present work extends IDyOM to modelling perceived similarity between musical sequences using the compression distances defined above. IDyOM has been presented in detail in previous research (Pearce, Citation2005) but the key features used in the present research are introduced in Section 2.2.
2.2. IDyOM
IDyOM (Pearce, Citation2005) predicts the likelihood of individual events in sequences of sounding events, implementing Equation (Equation2(2) ). The limitations of fixed-order Markov models (Witten & Bell, Citation1991) are avoided using smoothing to combine the distributions generated by an order-h model with distributions less sparsely estimated from lower order models. This has two consequences: first, the order h can vary for each sequential context (i.e. by choosing the longest matching context) making IDyOM a variable-order Markov model; second, IDyOM benefits both from the structural specificity of high-order contexts and the statistical power and generalisation afforded by low-order contexts. IDyOM uses an interpolated smoothing strategy (Cleary & Witten, Citation1984; Moffat, Citation1990; Cleary and Teahan, Citation1997; Bunton, Citation1997) in which probabilities are estimated by a weighted linear combination of all models with order lower than the maximum order h selected in a given context.
Following Conklin & Witten (Citation1995), IDyOM incorporates a multiple viewpoint framework that allows for modelling and combining different features present in and derived from the events making up the musical surface. Melodies are represented as sequences of discrete events each composed of a conjunction of basic features. In the present work, the musical surface consists of the basic features onset and pitch: melodies are composed of events that have an onset time and a pitch. A viewpoint is a partial function mapping from sequences of events to the domain (or alphabet of symbols) associated with the viewpoint. Basic viewpoints are simply projection functions returning the attribute of the final event in the melodic sequence. Derived viewpoints are partial functions mapping onto a feature that is not present in the basic musical surface but can be derived from one or more basic features. In the present research, the following viewpoints derived from pitch are used: interval and contour which represent the pitch interval in semitones between a note and the preceding note in the melody and pitch contour (rising, falling, unison), respectively. The following viewpoints derived from Onset are also used: IOI and IOI contour which represent the inter-onset interval between a note and the preceding note in the melody and whether the IOI increases, decreases or remains the same as the preceding IOI in the melody, respectively. Since the function is partial, it may be undefined for some events (e.g. Interval and Contour are undefined for the first note in a melody).
A collection of viewpoints used for modelling forms a multiple viewpoint system. Prediction within a multiple viewpoint system uses a set of models, one for each viewpoint in the system. The models are trained on sequences of viewpoint elements and return distributions over the alphabet of the individual viewpoints. Therefore, the resulting distributions for derived viewpoints are mapped into distributions over the alphabet of the basic viewpoint from which the viewpoint is derived (e.g. pitch in the case of interval and contour). The resulting distributions can then be combined for each basic viewpoint separately. In the present work, this is achieved using a geometric mean, weighted by the entropy of the individual distributions such that models making higher entropy (i.e. more uncertain) predictions are associated with a lower weight (Conklin, Citation1990; Pearce et al., Citation2005). This yields a single distribution for each of the basic features of interest (pitch and onset in the present research).
Finally, IDyOM combines these distributions by computing the joint probability of the individual basic features. For an event sequence of length j, composed of events in an event space
, which itself consists of m basic viewpoints
:
Full details of these steps and other aspects of multiple viewpoint systems not used in the present research are available elsewhere (Pearce, Citation2005; Conklin & Witten, Citation1995).
3. Method
The compression-based IDyOM model is evaluated by comparison with data from three experiments in which human participants judged the similarity of pairs of melodies. The human rating data and the corresponding performance of a range of feature-based similarity measures have been published previously (Müllensiefen & Frieler, Citation2004; Müllensiefen, Citation2004) which enables us to compare compression distance with existing similarity models. As summarised below, the three experiments differ in terms of the reference melodies used, how the variants were constructed, the number of levels in the rating scale and the sample of participants. For full details see Müllensiefen & Frieler (Citation2004), for Experiments 1 and 2, and Müllensiefen (Citation2004), for Experiment 3.
The similarity models examined in this research are deterministic and do not contain any principled way of accounting for variability within or between participants. Therefore for the purposes of evaluation, a single perceptual similarity rating is required for each pair of stimuli. To ensure that the mean ratings thus obtained were coherent, Müllensiefen & Frieler (Citation2004) applied well-known psychometric principles of criterion validity, test–retest reliability and inter-participant agreement (Messick, Citation1995; Rust & Golombok, Citation2008). As a measure of criterion validity, they required participants to give high similarity ratings for pairs of identical stimuli. As a measure of reliability, they required participants to give consistent similarity ratings when a stimulus pair was presented a second time. Data from participants who did not meet these criteria was not retained for further analysis (see Section 3.1 for details). For consistency with previous research, we apply the same validity and reliability criteria as Müllensiefen & Frieler (Citation2004). We also assess inter-participant reliability before averaging similarity ratings across participants (see Section 4.1). There is a potential danger in selecting data by these validity and reliability criteria that the results of our study might model an unrepresentative sample of the population, so we also checked those results against the full set of data, finding no indication of bias (see the Appendix).
3.1. Participants
3.1.1. Experiment 1
Eighty-two participants were recruited from an undergraduate programme in Musicology to take part in the experiment. Twenty-three participants gave similarity judgements that satisfied both criteria of reliability (a value of Kendall’s of at least 0.5 for test–retest ratings of the same stimuli) and criterion validity (at least 85% of identical melody pairs rated at least 6 on the seven-point rating scale). These 23 participants had a mean age of 23.2 years (
) and 10 were female. They reported having played a musical instrument for an average of 12.5 years (
) and a mean of six years (
) of paid instrumental lessons. Fifteen participants had received formal ear training.
3.1.2. Experiment 2
Sixteen participants were recruited from an undergraduate programme in Musicology. Twelve participants satisfied the criteria of validity and reliability: they rated a pair of identical melodies as highly similar (minimum of 6 on the seven-point rating scale) and gave consistent ratings for stimulus pairs that were repeated on a later trial in the same session (a maximum difference of 1 between the ratings). The 12 participants had a mean age of 24.5 years () and 6 were female. They reported having played a musical instrument for an average of 14.6 years (
) and a mean of 10.2 years (
) of paid instrumental lessons. All participants had received formal ear training.
3.1.3. Experiment 3
Ten participants were recruited from an undergraduate programme in Musicology. Five participants satisfied the two criteria of validity and reliability: they rated a pair of identical melodies as highly similar (minimum of 9 on the 10-point rating scale) and gave consistent ratings for stimulus pairs that were repeated on a later trial in the same session (a maximum difference of 1 between the ratings). These participants had a mean age of 29 years () and were all male. They reported having played a musical instrument for an average of 16.2 years (
) and a mean of 6.3 years (
) of paid instrumental lessons. All participants had received formal ear training.
3.2. Stimuli
3.2.1. Experiment 1
Fourteen existing melodies from Western popular songs were chosen as stimulus material. All melodies were between seven and ten bars long (15–20 s) and were selected to contain at least three different phrases and two thematically distinct motives. Melodies were generally unknown to the participants as indicated in a post-test questionnaire, except in a very few cases. However, the ratings in these few instances did not differ systematically from the remainder of the ratings in any respect and therefore they were included. For each melody, six comparison variants with ‘errors’ were constructed by changing individual notes, resulting in 84 variants of the 14 original melodies. The error types and their distribution were created according to the literature on human memory errors for melodies (Sloboda & Parker, Citation1985; Oura & Hatano, Citation1988; Zielinska & Miklaszewski, Citation1992; McNab, Smith, Witten, Henderson, & Cunningham, Citation1996; Meek & Birmingham, Citation2002; Pauws, Citation2002). Five error types with their respective probabilities were defined: (1) Rhythm errors with a probability of to occur in any given melody; (2) pitch errors not changing pitch contour (
); (3) pitch errors changing the contour (
); (4) errors in phrase order (
); (5) modulation errors (pitch errors that result in a transition into a new key;
). Every error type had three possible degrees: 3, 6 and 9 errors per melody for rhythm, contour and pitch errors, and 1, 2 and 3 errors per melody for errors of phrase order and modulation. For the construction of the individual variants, error types and degrees were randomly combined, except for the two types of pitch errors (with and without contour change) that were never combined within a single variant. The number of errors ranged from 0 to 16 with at least 50 of the variants having between 4 and 12 errors.
3.2.2. Experiment 2
Two of the reference melodies in Experiment 1 were chosen as reference melodies for Experiment 2. The variants for comparison consisted of the same six variants as in Experiment 1 augmented by six new variants derived from different reference melodies but where an alignment-based similarity algorithm (Sailer, Citation2006) indicated a relatively high similarity with a different reference melody. Thus, Experiment 2 contained 24 melody pairs in total. Unlike Experiment 1, every variant was transposed to a different key from the reference melody and therefore participants could not make use of absolute pitch information. Transpositions were made to maximise the overlap in pitch range between the reference melody and variant while also avoiding any patterns in keys or transpositions across subsequent trials.
3.2.3. Experiment 3
Four reference melodies from Experiment 1 were used as reference melodies for Experiment 3 and for each of these, 8 variants were created which were always modifications of the original reference melody. This yielded 32 melody pairs in total. The error probabilities for the modifications were the same as in Experiment 1 except for interval errors with and without contour change, which were merged to a single error type with a probability of . All possible combinations of the different degrees of interval and contour errors (0, 3, 6, 9 possible errors per variant for interval and contour, respectively) were created and distributed evenly across the 21 melody variants with interval errors. This amounted to 10 errors per variant on average (range: 0 to 25 errors). All variants were presented transposed relative to the key of the reference melody following the same principles as in Experiment 2.
3.3. Procedure
The general procedure was the same for all three experiments. Participants were instructed to rate the similarity of pairs of melodies on a seven-point scale with seven representing maximal similarity. A 10-point similarity rating scale was used in Experiment 3. The first item in each comparison pair was always the reference melody and the second item of each pair was the variant. Participants were informed that sometimes the variants would contain many errors, sometimes only a few errors and that there could be variants with no errors at all. They were instructed to judge the degree of the overall deviation of the variant from the reference melody. Participants were encouraged to make use of the whole range of the rating scale. None of the participants in any of the three experiments indicated that they were unable to perform the task or had any difficulty understanding what was required of them. Each trial started with a single exposure to the original reference melody. After 4 s of silence, trials consisting of pairs of reference melody and variant were played to the subjects. On each trial, there was an interval of 2 s of silence between reference and variant and adjacent trials were separated by 4 seconds of silence. Participants were tested in groups in their normal teaching rooms. Stimuli were played from a CD over loudspeakers using a piano sound at a comfortable listening level (around 65 dB). At the end of the testing sessions, participants completed a questionnaire asking about their previous and current musical activities. The retest session for Experiment 1 took place one week after the first session and was identical to that session, but used pairs of reference melodies, except for one reference melody which was repeated including all its variants. This made it possible to compare the judgments of the same six stimulus pairs from the two sessions. Participants in Experiment 1 were informed of the retest in the subsequent week but they were led to believe that they would be re-tested with entirely different melodies. Experiments 2 and 3 were conducted within a single session.
4. Results
4.1. Inter-participant agreement
The compression-based model (like all other similarity models discussed in this paper) is deterministic and lacks any principled way of accounting for variability in similarity perception between or within participants. Therefore, similarity ratings must be averaged across participants to obtain a single aggregate perceptual similarity rating for each stimulus pair. However, there must be high inter-participant agreement for such averaging to be warranted. As described above, participants’ responses were assessed for criterion validity (‘participants must rate identical melodies as highly similar’) and test–retest reliability (‘participants must give consistent ratings to a melody pair when it is presented on two different occasions’). While criterion validity (as it is operationalised here) ensures high inter-participant agreement for pairs of identical stimuli, test–retest reliability does not ensure high inter-participant agreement for the reference-variant pairs.
Table 1. Measures of inter-participant agreement (internal reliability) for those participants whose ratings met the criteria of test–retest reliability and criterion validity. For the KMO, a value of at least .5 is usually required and values of .8 are considered ‘meritorious’ (Kaiser, Citation1974). A significant p-value on the Bartlett test indicates that correlations exist in the population and for Cronbach’s alpha values of
.7 are generally considered ‘good’.
Therefore, we computed four measures of inter-participant reliability: (1) the Kaiser–Meyer–Olkin measure (KMO) reflects the global coherence in a correlation matrix and is frequently used to assess the suitability of correlation matrices for subsequent factor analysis; (2) the Measure of Sampling Adequacy (MSA) indicates for each variable (i.e. participant) the appropriateness of a subsequent factor analysis; (3) Bartlett’s Test of Sphericity tests the null hypothesis that there are no correlations among the variables (i.e. participants) in the population; (4) Cronbach’s alpha is a coefficient that indicates the internal reliability of participants’ judgements. Table gives the values of the four measures for all three experiments. All measures indicate a very high inter-participant agreement for the data from each of the three experiments. Thus, participants who adhered to the criteria of test–retest reliability and criterion validity also judged the melody pairs in very similar ways.
4.2. Modelling with Known stimulus characteristics
Experiment 1 comprised 84 reference-variant stimulus pairs where variants were created systematically by introducing errors of different types. Because the number (and position) of the errors are known for each variant, this provides an opportunity to evaluate the relative influence of the different error types on human similarity judgements. Note that in most studies of melodic similarity that investigate naturally occurring variants of melodies this is usually not possible because it is generally unknown how a variant was derived from a reference melody. Using linear regression we modelled participants’ mean similarity ratings as the dependent variable and used the number of errors for the five error types (interval error, contour error, rhythm error, phrase-order error and modulation error) as predictor variables. All predictors are highly significant () and the model accounts for 79% of the variance in the data,
. Table gives the
weights for the five predictor variables which suggest that rhythm errors seem to have a smaller influence on similarity judgements than all other error types. Because the probability of interval errors and their range (0 to 9) and variance was different for contour, modulation and phrase errors the relative sizes of their standardised and non-standardised beta weights differ. However, on both metrics errors of phrase error have a stronger influence on similarity judgements than modulation errors.
Table 2. Regression coefficients for a linear model predicting mean similarity ratings by types and numbers of errors.
In a subsequent modelling step, we add information about the position of errors to the model. This follows findings by Dewar et al. (Citation1977) and Cuddy & Lyons (Citation1981) that the position of differences between two melodic sequences can have an impact on melodic memory performance, especially with differences towards the beginning of sequences being more impactful (a primacy effect). Therefore, as an additional factor, we took error density into account implementing the hypothesis that the accumulation of errors in a shorter amount of musical time (measured in bars) would lead to a decrease in similarity ratings. We computed an indicator that measures the average error position weighted by error density. The creation of the error position indicator variable was only meaningful for contour, interval and rhythm errors because errors were not independent for phrase order and modulation errors. When entered into the regression model along with the five error frequency variables, only the weighted position error for interval proved to be a significant predictor. A model including weighted interval error position and the five error frequency variables accounted for 81% of the variance in the mean ratings, .
4.3. Testing the compression-based model
The compression-based IDyOM model is tested by correlating its output with the mean similarity ratings from Experiments 1-3. A logarithmic relationship was observed between compression distance and the mean similarity ratings, so the compression distance was log-transformed prior to all analyses reported below. Three variants of compression distance are assessed: first, an unnormalised, asymmetric measure given in Equation (Equation4
(4) ); second, a normalised, asymmetric measure
given in Equation (Equation5
(5) ); and third, a normalised, symmetric measure given in Equation (Equation6
(6) ). These are compared to Normalised Compression Distance (NCD) as defined by Li et al. (Citation2004) and given in Equation (Equation1
(1) ). We also compare the results to a subset of the similarity algorithms reported in Müllensiefen & Frieler (Citation2004), including the best-fitting hybrid algorithms achieved using multiple regression.
Using these distance measures, three pitch representations and three corresponding temporal representations are evaluated using IDyOM’s multiple viewpoint framework. The pitch viewpoints are: pitch, representing the chromatic pitch of a note as a MIDI note number (60 middle C); Interval, representing the size in semitones of the pitch interval between a note and its predecessor, with sign distinguishing ascending and descending intervals; and contour, representing pitch contour as 1 for rising intervals, 0 for unisons and -1 for descending intervals. The temporal viewpoints are: Onset, representing onset time in basic time units (crotchet
24 units); IOI, representing the inter-onset interval between a note and its predecessor; and IOI-Contour representing whether an IOI is greater (1), smaller (
) or the same (0) as the preceding IOI. Combinations of these viewpoints are also assessed using the procedures presented in Section 2.2: First, distributions are combined for viewpoints predicting each basic viewpoint using the weighted geometric mean; second, a joint distribution is computed for onset and pitch. It is hypothesised, based on the results presented in Section 4.2, that pitch viewpoints will yield a better fit to the data than temporal viewpoints and that relative pitch representations (Interval, Contour) will fit the data better in Experiments 2 and 3 (which used transposed variants) than in Experiment 1.
4.3.1. Pitch representations
The results for pitch representations are shown in the upper panels of Tables – for ,
,
and
, respectively.
Table 3. Pearson correlation coefficients between (asymmetric, unnormalised) and listeners’ mean similarity ratings in Experiments 1–3. The top section shows results for viewpoints predicting pitch, the middle section results for viewpoints predicting Onset and the bottom section shows the best performing viewpoint systems for predicting both pitch and onset. The three rows in the bottom section indicate the viewpoint systems yielding the highest correlation for Experiments 1, 2 and 3, respectively.
Table 4. Pearson correlation coefficients between (asymmetric, normalised) and listeners’ mean similarity ratings in Experiments 1–3. The top section shows results for viewpoints predicting Pitch, the middle section results for viewpoints predicting Onset and the bottom section shows the best performing viewpoint systems for predicting both pitch and onset. The three rows in the bottom section indicate the viewpoint systems yielding the highest correlation for Experiments 1, 2 and 3, respectively.
Table 5. Pearson correlation coefficients between (symmetric, normalised) and listeners’ mean similarity ratings in Experiments 1–3. The top section shows results for viewpoints predicting pitch, the middle section results for viewpoints predicting Onset and the bottom section shows the best performing viewpoint systems for predicting both pitch and onset. The three rows in the bottom section indicate the viewpoint systems yielding the highest correlation for Experiments 1, 2 and 3, respectively.
Table 6. Pearson correlation coefficients between (Li et al., Citation2004) and listeners’ mean similarity ratings in Experiments 1–3. The top section shows results for viewpoints predicting pitch, the middle section results for viewpoints predicting Onset and the bottom section shows the best performing viewpoint systems for predicting both pitch and onset. The three rows in the bottom section indicate the viewpoint systems yielding the highest correlation for Experiments 1, 2 and 3, respectively.
For Experiment 1, pitch in general yields the best fit with lower correlation coefficients resulting from the addition of interval and contour. The only exception is for where the combination of pitch and interval provides the best fit to the empirical data. Contour representations perform especially poorly. Overall,
using a Pitch viewpoint yields the highest correlation with the mean similarity ratings, accounting for approximately 80% of the variance,
.
For Experiment 2, pitch models do not correlate significantly with the mean similarity ratings for any of the distance measures, while of the two relative pitch viewpoints, interval yields higher correlations than Contour for all distance measures. For and
, combining interval with contour and pitch, both individually and in isolation, yields higher correlations, while for
this is only true for the addition of contour. Overall,
using interval and contour viewpoints yields the highest correlation with the mean similarity ratings, accounting for approximately 76% of the variance,
.
For Experiment 3, the correlations are in general much lower. does not yield any significant correlations.
yields significant correlations for interval, while
and
yield significant correlations for interval and contour. For
, but not
, the addition of pitch and contour, both individually and in combination, yields stronger correlations than interval alone. Overall,
using pitch, interval and contour viewpoints yields the highest correlation with the mean similarity ratings, accounting for approximately 66% of the variance,
.
4.3.2. Temporal representations
The results for temporal representations are shown in the middle panels of Tables – and for ,
,
and
, respectively.
In general, temporal representations give smaller correlation coefficients than pitch representations, especially for Experiments 1 and 3. For Experiment 1, Onset yields the strongest correlation for all similarity measures, with accounting for the greatest proportion of variance, 15%, in the mean similarity ratings,
.
For Experiment 2, temporal representations yield reasonably strong negative correlations with the mean similarity ratings. For , IOI yields the strongest correlation for single viewpoint systems, while the addition of IOI Contour improves the correlation slightly. For
, Onset yields the strongest correlation and this is not improved by adding further temporal viewpoints. For
both Onset and IOI yield significant correlations and the combination of both improves the strength of the correlation further. For
, IOI yields the strongest correlation and this is not improved by addition of further viewpoints. Overall,
using IOI and IOI Contour viewpoints yields the highest correlation with the mean similarity ratings, accounting for approximately 63% of the variance,
.
For Experiment 3, there are no significant correlations for and
, while for
and
, IOI Contour gives the highest correlation. Overall,
using the IOI Contour viewpoint yields the highest correlation with the mean similarity ratings, accounting for approximately 28% of the variance,
.
4.3.3. Combined representations
Can a combination of pitch and temporal viewpoints yield compression distances that better account for listeners’ perceptual similarity? To answer this question, IDyOM is configured to predict both the onset and the pitch of each note. This analysis considers all possible viewpoint systems (i.e. sets of viewpoints) capable of predicting both Pitch and Onset, of which there are 49 for each experiment (147 in total). The results are shown in the lower panels of Tables – for ,
,
and
, respectively.
For Experiment 1, combining pitch and temporal representations does not yield a better fit to the data for any of the similarity measures. For Experiment 2, however, combining pitch and temporal representations yields stronger correlations than those obtained with pitch or temporal representations used in isolation for all similarity measures. For Experiment 3, the same is true for all but , where no combination of viewpoints produces a significant correlation.
For Experiment 2, using a set of viewpoints comprising pitch, interval and onset yields the strongest correlation with the mean similarity ratings, accounting for approximately 88% of the variance,
, very slightly ahead of
with the same set of viewpoints.
exhibits a slightly weaker correlation using a different set of viewpoints comprising Interval, Contour and IOI Contour.
For Experiment 3, again yields the strongest correlation using a set of viewpoints comprising pitch, interval, onset and IOI Contour, accounting for approximately 75% of the variance,
, ahead of
with the same set of viewpoints, which in turn is ahead of
using a subset of these viewpoints: Interval, Onset and IOI Contour.
Overall, the models accounting for the greatest proportion of the variance are with pitch for Experiment 1,
with pitch, Interval and Onset for Experiment 2 and
with pitch, interval, onset and IOI contour for Experiment 3 (see Table ).
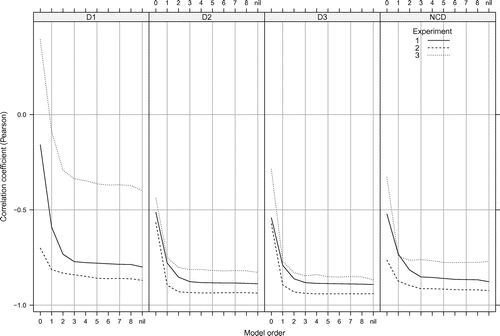
4.3.4. Context length
We turn now to the question of context length in listeners’ structural representations of the stimuli by varying the order of the best-fitting IDyOM models for each similarity measure. In the previous analyses, IDyOM was configured as a variable-order model (Begleiter et al., Citation2004; Bunton, Citation1997; Cleary and Teahan, Citation1997), choosing the longest matching context for each note prediction. In the present simulations, the maximum order used in prediction is limited to values ranging from 0 to 8 (although note that the model still uses smoothing to combine output from models of order lower than the specified order bound). The viewpoint systems used correspond to those with the best performance on each experiment for each similarity measure, marked with an asterisk in Tables – and for ,
,
and
, respectively.
The results are shown in Figure . In all cases, there is tendency for correlations to become stronger with increasing order bound, especially for orders up to up to 3. Performance generally converges above orders 3, 4 or 5 depending on the similarity measure and experiment. Nonetheless, the variable order model yields a stronger correlation than any lower order model in all but two cases where models with a fixed order bound yield numerically slightly higher correlations than the unbounded-order model: for Experiment 2 with Order 4,
, and
for Experiment 3 with Order 6,
(cf. the corresponding values in Tables and , respectively). In all other cases, the unbounded-order model gives the strongest correlation with the perceptual similarity ratings.
Figure 1. Correlation between mean similarity ratings and compression distance from the best-fitting IDyOM model on each experiment for each similarity measure (see models marked with an asterisk in Tables – for ,
,
and
, respectively) using order bounds ranging from 0 to 8. The variable-order model with unbounded order is indicated by ‘nil’.
4.3.5. Comparison with similarity algorithms reported in (Müllensiefen and Frieler, Citation2004)
To assess the relative performance of the compression-based IDyOM model, it is useful to compare it with previous model performance on the same dataset. (Müllensiefen and Frieler, Citation2004) compare 34 feature-based similarity measures and hybrid measures which combine individual feature-based measures with the mean similarity ratings from Experiments 1 and 2 while Müllensiefen (Citation2004) does the same for Experiment 3. For comparison with the compression-based model, we reproduce here the performance of a simple, commonly-used distance measure: edit distance (see Section 1.2) operating on pitch information only. Edit distance is implemented using a well-known dynamic-programming algorithm [see][for further details]MongeauSankoff90.
We also reproduce, for comparison, results for the best performing hybrid similarity measure reported by Müllensiefen & Frieler (Citation2004) termed opti3. This model consists of a weighted linear combination of feature-based predictors selected from a set of 34 features with weights derived from multiple regression on the mean similarity ratings from Experiments 1–3. opti3 combines three component features: first, the edit distance of the implied bar-wise tonality of the two melodies (harmcore); second, a measure that sums the differences of the frequencies of pitch sequences (3-8 notes) occurring in one but not both melodies (ngrukkon); and third, edit distance based on note duration classes (very short, short, normal, long, very long; rhythfuzz). See Müllensiefen & Frieler (Citation2004) for full details of the individual predictors and regression weights for this hybrid similarity measure.
Pearson correlation coefficients between mean participant ratings, edit distance and the hybrid similarity measure opti3 are given in Table together with confidence intervals computed via bootstrap sampling using 1000 samples each. A comparison with results from the compression-based models in Table indicates that opti3 shows slightly higher correlations with participant ratings than the compression-based model (
) for Experiments 1 and 2, while the converse is true for Experiment 3. These models yield higher correlations than the edit distance measure for all experiments. However, the confidence intervals given in Table suggest that the performance of all three similarity measures is statistically indistinguishable, with the exception of Experiment 1 where edit distance performs slightly worse than opti3 and the compression-based model.
Table 7. Coefficients for the Pearson correlation between the edit distance and opti3 similarity measures reported by Müllensiefen & Frieler (Citation2004) and listeners’ mean similarity ratings in Experiments 1–3. Figures in brackets indicate 95 confidence intervals. See main text for details of the algorithms. In the lower panel, results for the best-fitting models for each experiment are reproduced from Table for comparison.
We also computed the mean similarity ratings for all participants and found them to be almost identical to those reported by Müllensiefen & Frieler (Citation2004) for the subsets of participants who met the criteria of criterion validity and test–retest reliability. The results are summarised in the Appendix.
4.4. Validation with the MIREX 2005 dataset
A useful way of validating the compression-based IDyOM model is to apply it (using the best-fitting parameters from Experiments 1-3) to similarity data gathered in a very different way. The Music Information Retrieval Evaluation eXchange (MIREX Downie, Citation2008; Downie, Ehmann, Bay, & Jones, Citation2010) is a framework for the formal evaluation of MIR systems, consisting of a number of tasks defined each year by the MIR community. Tasks include artist identification, mood/genre classification, beat tracking and melody extraction. In 2005, MIREX included a melodic similarity task for which algorithms had to compute the similarity of 558 melodic incipits (the candidates) to each of 11 melodic incipits (the queries). The incipits were taken from the RISM A/II bibliographic database of music manuscripts from 1600.Footnote2 Algorithms were evaluated by comparison with human performance on a task that involved ranking a subset of about 50 incipits by similarity to each query. The task was completed by 35 musical experts and both the score and a midi rendition were provided for each incipit. For each query, (Typke, den Hoed, de Nooijer, Wiering, and Veltkamp, Citation2005) ordered the candidates by their median rank, then by their mean rank and then aggregated candidates into groups whenever the median rank did not differ significantly (according to a Wilcoxon rank sum test) from that of the candidate ranked one place higher. For each query, a subset of relevant candidates was defined by removing those incipits that were ranked by less than 25% of the participants who ranked a given query (participants were not required to rank all candidates for all queries). The stimuli and data are available online.Footnote3
In MIREX 2005, algorithms were evaluated using four variants of recall (the proportion of relevant documents present in the result list) and precision (the proportion of results that are relevant).
Average dynamic recall (ADR)is the average recall over the first N candidates, where N is the number of relevant candidates for a given query (Typke, Citation2007; Typke, Veltkamp, & Wiering, Citation2006).
Normalised recall at group boundaries (NRGB)computes recall at the position of the first candidate in each group and averages the resulting values, weighting by group size.
Average precision (AP)computes precision at the position of each relevant document in the result list and averages the resulting values.
Precision at N Documents (PND)computes the precision of the top N results, where N in this case corresponds to the number of relevant candidates for a given query.
Table 8. Results for the MIREX 2005 melodic similarity task taken from Typke et al. (Citation2005). Algorithms are ordered by performance in terms of ADR. Results for the compression-based model are in italics and superscript numbers indicate the rank for the four best-performing algorithms in terms of NRGB, AP and PND. ADR is ADR, NRGB is Normalised Recall at Group Boundaries, AP is Average Precision and PND is Precision at N Documents. See text for further details.
Table compares the performance of the best-fitting compression-based models from Experiments 1–3 (i.e. those shown in Table ) along with the algorithms originally evaluated in MIREX 2005. The results show that the compression-based model performs comparatively well. The
(pitch, interval, onset) model from Experiment 2 achieves the highest ADR of all algorithms, coming in second place by AP and fourth place by NRGB and PND. The
(pitch, interval, onset, IOI Contour) model from Experiment 3 comes in fourth place by ADR, third place by AP and second place by NRGB and PND. This suggests that the compression-based model generalises naturally to a very different kind of similarity data for rather different stimuli.
5. Discussion
This paper introduces and evaluates a compression-based model of musical similarity, based on an existing computational model of auditory expectation, IDyOM (Pearce, Citation2005), which consists of a variable-order Markov model (Begleiter et al., Citation2004) using PPM data compression techniques (Cleary & Witten, Citation1984; Cleary and Teahan, Citation1997; Bunton, Citation1997) and operating within a multiple viewpoint system (Conklin & Witten, Citation1995). In previous research, IDyOM has been found to account accurately for listeners’ expectations and uncertainty while listening to music (Pearce, Citation2005; Pearce et al., Citation2010; Omigie et al., Citation2012; Omigie et al., Citation2013; Egermann et al., Citation2013; Hansen & Pearce, Citation2014). The present research extends IDyOM to modelling similarity perception. The results from all three experiments show that the compression-based model accounts for a large proportion of the variance in the participants’ mean similarity ratings equivalent to that explained by previous models (see below for further discussion of the differences between these models). Overall, pitch viewpoints provide a better fit to the perceptual similarity data than temporal viewpoints (cf. Conklin, Citation2013a). For Experiments 2 and 3, multiple viewpoint combinations of pitch and temporal viewpoints yielded the best models of similarity perception, accounting for more variance than single viewpoint models. For all three experiments, the normalised, symmetric similarity measure provided the best compression-based simulation of perceptual similarity, accounting for more variance than NCD (Li et al., Citation2004), which is normalised with respect to the overall complexity (i.e, the compressed length) of the sequences rather than just their length (in terms of number of notes). Overall, the variable-order model provided the most accurate simulation of perceptual similarity, although in many cases, models with a lower order bound approached the performance of the variable-order model. This compression-based IDyOM model, using viewpoints selected on the data from Experiments 2 and 3, also performed well on the MIREX 2005 melodic similarity task, achieving comparable performance to the best performing algorithms.
The compression-based model’s performance for Experiment 1 is only slightly lower (: .800 vs .808) than that of a multiple regression model with predictors based on prior knowledge of the error types, counts and positions used to construct the stimuli. Across all experiments, its fit to the human perceptual similarity data is statistically indistinguishable from (though numerically slightly lower than) that of the optimal hybrid similarity measures reported in Müllensiefen & Frieler (Citation2004). As described in Section 4.3.5, these measures consist of weighted linear combinations of feature-based predictors where the features were selected (from a set of 34) and the weights determined using multiple regression on the mean similarity ratings in each experiment. In machine-learning parlance, least-squared regression is a supervised procedure and since these features and weights were estimated using the same training and testing set, the hybrid measures are likely to be overfitted to the data which would compromise the degree to which they generalise to other stimuli. IDyOM itself and the compression-based similarity models evaluated here operate in an entirely unsupervised manner in that they are not optimised to fit the similarity data (with the exception of viewpoint selection, which is discussed further below).
Another difference is that the hybrid similarity measure from Müllensiefen & Frieler (Citation2004) (opti3) includes a feature (harmcore) that assumes knowledge of the metrical and tonal structure of the melodies that is not assumed by the compression-based models reported here (though viewpoints could be added to represent these aspects of musical structure, see below). More generally, the features making up opti3 are very specific to musical sequences. One potential advantage of the compression-based approach is that it introduces a clear distinction between the similarity measure itself and the representation of the sequences to which it is applied. The former is universal in the sense that it can be applied to sequences of any type (e.g. music, text, images, DNA and so on). This is appealing on the grounds of parsimony and in terms of providing a principled and universal approach to cognitive modelling of psychological similarity (Chater and Vitányi, Citation2003b).
It is possible, of course, that performance would be affected by the details of the underlying compression model (see, e.g. Louboutin & Meredith, Citation2016). IDyOM uses a model based on PPM* data compression techniques (Cleary & Witten, Citation1984; Bell et al., Citation1990; Moffat, Citation1990; Cleary and Teahan, Citation1997; Bunton, Citation1997) and, in fact, the results indicate that varying the order-bound has a significant impact on fit to the perceptual similarity data. Future research should examine the impact of using different models including dictionary-based compression (e.g. Ziv & Lempel, Citation1977; Ziv & Lempel, Citation1978; Welch, Citation1984), block-sorting compression (e.g. Burrows and Wheeler, Citation1994) and Dynamic Markov Compression (DMC, Cormack & Horspool, Citation1987). From a psychological perspective, it is important to understand the implications of such model comparisons for the cognitive processes involved in musical similarity perception. In this respect, DMC is interesting since it is more powerful than finite-context models (Bunton, Citation1996) in the sense that it recognises a broader class of formal languages, placing it higher in the Chomsky hierarchy (Hopcroft & Ullman, Citation1979).
This of course leaves the question of how the representations for a particular similarity judgement are determined. The present models and empirical results do not provide an answer to this question. However, we hypothesise that given several different cognitive representations of incoming sensory information, listeners select those that allow more efficient encodings of the sensory stimulus (i.e. those yielding greater predictive performance or, equivalently, greater compression, indicated by reduced information content). This would provide an objective, data-driven means for selecting representations independently of prior assumptions about the sensory stimuli. This proposal connects with more general research in cognitive science and neuroscience which views perception as a process of acquiring predictive, compressed representations of the sensory environment (Barlow, Citation1959); Chater99; ChaterVitanyi03a; Friston05 but remains to be tested in future research on perception of musical similarity.
One goal of the present research was to investigate which viewpoints increase the model’s fit to the mean similarity ratings as a way of identifying the cognitive representations of melody underlying similarity perception. As hypothesised, pitch viewpoints accounted for greater proportions of the variance than temporal viewpoints and relative pitch viewpoints (Interval, Contour) yielded a better fit than absolute pitch viewpoints (Pitch) for the transposed variants used in Experiments 2 and 3. In Experiment 1, a single viewpoint system (Pitch) produced a higher correlation than any multiple viewpoint system, probably because the variants were not transposed, so absolute pitch differences outweighed all others. In Experiments 2 and 3, however, we see that combining viewpoints, especially those based on both pitch and rhythm, leads to models that more accurately simulate perceptual similarity. The notable influence of rhythmic structure in improving the pitch models in Experiments 2 and 3 may be a result of the transposition de-emphasising the importance of pitch information. This suggests that listeners construct cognitive representations of melody that combine pitch and rhythmic structure but only when the stimulus makes this advantageous in terms of identifying differences between stimuli. However, the precise cognitive operations involved in such representational selection remain unclear. Future research should also examine whether better fit to the data can be obtained by search through a wider space of viewpoints, including linked viewpoints which represent tuples of component features. It would also be interesting to examine the effects on compression-based similarity of more complex representations of musical structure, including metre, grouping and tonality, within the multiple viewpoints framework.
Although different sets of viewpoints were selected for each experiment, note that they are related as subsets of each other: pitch in Experiment 1; pitch, interval and onset in Experiment 2; pitch, interval, onset and IOI contour in Experiment 3. This may reflect the increasingly complex comparisons being made due to the construction of the stimuli. Another possibility is that some nuanced aspects of individuals’ similarity perception were averaged out in Experiment 1, due to the greater sample size. In this respect, evaluation on the MIREX 2005 data is ambiguous, with the model from Experiment 2 performing better by some measures (ADR and AP) and that from Experiment 3 performing better by other measures (NRGB and PND). It is clear that the pitch model from Experiment 1 performs worse, however, reinforcing the conclusion that perceptual similarity involves representations of both pitch and rhythmic structure. Further research is required to identify optimal sets of viewpoints and how these are affected by the choice of stimuli, participants and experimental design.
The effects of varying model order (the length of context taken into account in generating conditional probabilities) were also examined. By default IDyOM operates as a variable-order Markov model adaptively selecting the longest matching context in estimating conditional event probabilities. However, a maximum order bound can be imposed, thereby limiting the degree of context taken into account when estimating conditional event probabilities. The variable-order model was compared to models with order-bounds of 0–8 notes for each of the compression-based distance measures for each experiment. Although the variable-order model generally provides the best model of perceptual similarity, in many cases models with orders above 3–5 notes are numerically very close. Given that the actual point of convergence varies according to experiment and similarity measure, it may be advantageous to use a variable-order model in the absence of a priori information. Overall, this suggests that reasonably high-orders are required to provide an accurate compression-based simulation of musical similarity perception. However, this may depend on the stimulus structure. For example, higher-orders are necessary for the compression-based models to detect (dis)similarity based on phrase reordering and the required order may depend on the length of phrases in the stimuli. Again, it seems likely that a variable-order model will be advantageous in the absence of a priori information about the stimuli (which was not available to the participants in the present experiments). Further research with specially designed stimuli is required to better understand context-length effects in modelling human perception of similarity and how these interact with the representational viewpoints used.
A feature of the compression-based transformational approach to modelling similarity is that the similarity between pairs of stimuli need not be symmetric. This is potentially interesting given evidence of asymmetries in cognitive judgements of similarity (e.g. Tversky, Citation1977) and in areas of music perception (Bharucha and Krumhansl, Citation1983; Krumhansl, Citation1983; Bharucha and Pryor, Citation1986; Dalla Bella & Peretz, Citation2005). It is not possible to address this question in any great depth here, since the stimulus pairs were presented only in one order. However, the fact that , a symmetric measure, provided a better fit to the data than
, the corresponding asymmetric measure, is suggestive that listeners’ similarity perception is symmetric. Further research using stimulus pairs presented in both orders is required to address this question in further detail. The results across all Experiments also show that
(and
) simulated perceptual similarity much more accurately than
. This provides strong evidence that musical similarity perception is normalised with respect to the length of the stimuli. Although
(like
) is normalised with respect to the length of the pairs of stimuli, it does not necessarily obey the triangle inequality. While the same may be true of psychological similarity (Tverskey & Gati, Citation1982), this requires further investigation for the case of musical similarity perception specifically. While
normalises with respect to length,
normalises with respect to the internal predictability of the individual stimuli. That
and
provide a closer fit than
suggests that musical similarity perception is not normalised with respect to other aspects of stimulus complexity than length. Again, this requires further investigation with experiments using stimulus materials specially constructed specifically to address the question.
The fact that compression-based IDyOM models, using features optimised on Experiments 2 and 3, also account well for the MIREX 2005 similarity rankings, suggests that the model generalises well to similarity data collected in a very different way. In the MIREX task, participants ranked candidates in terms of similarity to 11 queries, rather than providing similarity ratings between pairs of stimuli. In fact, the compression-based model from Experiment 2 yields a higher ADR performance than any other algorithm. ADR reflects the average proportion of relevant candidates in the result list as its length is extended from one to N (where N is the total number of relevant candidates for each query). This is the preferred performance measure for the task (Typke et al., Citation2005). The only algorithm that consistently outperforms some variant of the compression-based model on NRGB, AP and PND is that of Graachten et al. (Citation2005). However, it is worth noting that the parameters of this algorithm were optimized on training data for a distinct set of 11 queries provided in advance of the MIREX 2005 evaluation. As a result, the algorithm may be overfitted to the MIREX data. Although the hybrid similarity measure used by Frieler & Müllensiefen (Citation2005) used the same statistical approach (fitting predictors to participants’ similarity ratings using linear regression) as the opti3 measure described above, the resulting predictors and weights are rather different from those of opti3.
In an analysis of the MIREX 2005 ground truth data, Marsden (Citation2012) finds evidence for wide variation between participants in terms of their similarity judgements. By contrast, inter-participant agreement in the three experiments reported here was high. Measures of criterion validity and test–retest reliability defined a priori by Müllensiefen & Frieler (Citation2004) were applied to screen out participants who gave low similarity ratings to pairs of identical stimuli or who gave inconsistent ratings for repeated presentations of stimuli. Using this data follows sound experimental and statistical practice (Messick, Citation1995; Rust & Golombok, Citation2008) and facilitates comparison of the models with previously published results. However, it also results in significantly smaller sample sizes, so we computed the mean similarity ratings for all participants in Experiments 1–3 and found them to be almost identical to those reported by Müllensiefen & Frieler (Citation2004). This shows that the criteria of criterion validity and test–retest reliability applied by Müllensiefen & Frieler (Citation2004) did not introduce any bias and that the ratings of participants who did not meet the criteria did not significantly influence the mean rating in any systematic way.
The participants providing similarity ratings (Experiments 1–3) were undergraduate musicology students while those providing data for the MIREX 2005 ground truth were also trained musicians. This is not uncommon in research on musical similarity (e.g. Eerola & Bregman, Citation2007) and has been motivated in terms of achieving stable, consistent similarity ratings (Müllensiefen & Frieler, Citation2004; Typke et al., Citation2005). However, it potentially limits the scope of the present results, as it remains unknown whether they would generalise to non-musicians. Lamont & Dibben (Citation2001) systematically compared melodic similarity ratings between musicians and non-musicians and found very little effect of musical training for complex stimuli (extracts from a Beethoven piano sonata and Schoenberg’s Klavierstück, op. 33a). It seems likely, therefore, that musicians’ similarity ratings for the much simpler stimuli used in the present research would also generalise to non-musicians. Nonetheless, the results should be replicated using larger samples of participants with a broader range of levels of musical training than those examined here. The goal of the present research was not to model variability within and between participants because none of the models tested include any systematic way of accounting for such effects. However, it is possible that the training of the models could be biased by prior effects of exposure or attentional bias towards particular features or structural analyses as a way of simulating differences between participants. This remains an important topic to be addressed in future research which may partly account for findings that similarity judgements can depend on interpretation (Marsden, Citation2012).
In summary, the present findings lend support to a compression-based transformational model of the cognitive processes involved in human perception of musical similarity. The model builds on existing information-theoretic understanding of human perception of music (Pearce, Citation2005; Hansen & Pearce, Citation2014) which conceives of music perception as process of creating efficient, compressed cognitive representations of structural and statistical regularities present in sequential auditory input.
Acknowledgements
We are grateful to Peter Harrison, Elizabeth Margulis, Alan Marsden and two anonymous reviewers for their helpful comments on earlier drafts of the manuscript. Thanks to Jamie Forth and Alan Marsden for supplying the MIREX 2005 dataset, together with useful commentary, and to Rainer Typke who originally collected the data and made it available.
Additional information
Funding
Notes
1 The software and documentation are available at: https://code.soundsoftware.ac.uk/projects/idyom-project.
2 Répertoire International des Sources Musicales (RISM). Serie A/II, manuscrits musicaux après 1600. http://www.rism.info/.
References
- Ahonen, T. E. (2010). Compressing lists for audio classification. Proceedings of the Third International Workshop on Machine Learning and Music (pp. 45-48). New York, USA.
- Barlow, H. B. (1959). Sensory mechanisms, the reduction of redundancy, and intelligence. Proceedings of a Symposium on the Mechanisation of Thought Processes (Vol. 2, pp. 537–559). London: National Physical Laboratory, Teddington. Her Majesty’s Stationery Office.
- Bartók, B., & Lord, A. B. (1951). Serbo-Croatian Folk Songs: Texts and Transcriptions of Seventy-Five Folk Songs from the Milman Parry Collection and a Morphology of Serbo-Croatian Folk Melodies. New York: Columbia University Press.
- Begleiter, R., El-Yaniv, R., & Yona, G. (2004). On prediction using variable order Markov models. Journal of Artificial Intelligence Research, 22, 385–421.
- Bell, T. C., Cleary, J. G., & Witten, I. H. (1990). Text Compression. Englewood Cliffs, NJ: Prentice Hall.
- Bell, T., Witten, I. H., & Cleary, J. G. (1989). Modeling for text compression. ACM Computing Surveys, 21, 557–591.
- Bharucha, J. J., & Krumhansl, C. L. (1983). The representation of harmonic structure in music: Hierarchies of stability as a function of context. Cognition, 13, 63–102.
- Bharucha, J. J., & Pryor, J. H. (1986). Disrupting the isochrony underlying rhythm: An asymmetry in discrimination. Perception and Psychophysics, 40, 137–141.
- Bunton, S. (1996). On-line stochastic processes in data compression (PhD thesis). Seattle, WA: University of Washington.
- Bunton, S. (1997). Semantically motivated improvements for PPM variants. The Computer Journal, 40, 76–93.
- Burrows, M., & Wheeler, D. (1994). A block-sorting lossless data compression algorithm. Digital SRC Research Report: Technical report . 124.
- Cambouropoulos, E., Crawford, T., & Iliopoulos, C. S. (1999). Pattern processing in melodic sequences: Challenges, caveats and prospects. Proceedings of the AISB’99 Symposium on Musical Creativity (pp. 42–47). Brighton, UK.
- Casey, M., Veltkamp, R., Goto, M., Leman, M., Rhodes, C., & Slaney, M. (2008). Content-based music information retrieval: Current directions and future challenges. Proceedings of the IEEE, 96, 668–696.
- Cataltepe, Z., Yaslan, Y., & Sonmez, A. (2007). Music genre classification using midi and audio features. EURASIP Journal on Advances in Signal Processing, 036409. doi:10.1155/2007/36409.
- Chater, N. (1996). Reconciling simplicity and likelihood principles in perceptual organisation. Psychological Review, 103, 566–581.
- Chater, N. (1999). The search for simplicity: A fundamental cognitive principle? The Quarterly Journal of Experimental Psychology, 52A, 273–302.
- Chater, N., & Vitányi, P. (2003a). The generalised universal law of generalisation. Journal of Mathematical Psychology, 47, 346–369.
- Chater, N., & Vitányi, P. (2003b). Simplicity: A unifying principle in cognitive science? Trends in Cognitive Sciences, 7, 19–22.
- Cilibrasi, R., Vitányi, P. M. B., & de Wolf, R. (2004). Algorithmic clustering of music based on string compression. Computer Music Journal, 28, 49–67.
- Cleary, J. G., & Teahan, W. J. (1997). Unbounded length contexts for PPM. The Computer Journal, 40, 67–75.
- Cleary, J. G., & Witten, I. H. (1984). Data compression using adaptive coding and partial string matching. IEEE Transactions on Communications, 32, 396–402.
- Conklin, D. (1990). Prediction and entropy of music (master’s thesis). Canada: Department of Computer Science, University of Calgary.
- Conklin, D. (2013b). Multiple viewpoint systems for music classification. Journal of New Music Research, 42, 19–26.
- Conklin, D. (2013a). Fusion functions for multiple viewpoints. In R. Ramirez, D. Conklin, & M.I. Nesta, (Eds.), Proceedings of the 6th International Workshop on Machine Learning and Music, Prague, Czech Republic.
- Conklin, D., & Witten, I. H. (1995). Multiple viewpoint systems for music prediction. Journal of New Music Research, 24, 51–73.
- Cormack, G. V., & Horspool, R. N. S. (1987). Data compression using dynamic Markov modelling. The Computer Journal, 30, 541–550.
- Cuddy, L. L., & Lyons, H. I. (1981). Musical pattern recognition: A comparison of listening to and studying structural and tonal ambiguities. Psychomusicology, 1, 15–33.
- Dalla Bella, S., & Peretz, I. (2005). Differentiation of classical music requires little learning but rhythm. Cognition, 96, B65–B78.
- Dewar, K. M., Cuddy, L. L., & Mewhort, D. J. K. (1977). Recognition memory for single tones with and without context. Journal of Experimental Psychology: Human Learning and Memory, 3, 60–67.
- Downie, J. S. (2008). The music information retrieval evaluation exchange (2005–2007). Acoustical Science and Technology, 29, 247–255.
- Downie, J. S., Ehmann, A. F., Bay, M. & Jones, M. C. (2010). The music information retrieval evaluation exchange: Some observations and insights. In Z.W. Ras, & A. Wieczorkowska, (Eds.), Advances in Music Information Retrieval (pp. 93–115). Springer.
- Eerola, T., & Bregman, M. R. (2007). Melodic and contextual similarity of folk song phrases. MusicæScientiæ, Discussion Forum, 4A, 211–233.
- Egermann, H., Pearce, M. T., Wiggins, G., & McAdams, S. (2013). Probabilistic models of expectation violation predict psychophysiological emotional responses to live concert music. Cognitive, Affective and Behavioural Neuroscience, 13, 533–533.
- Foster, P., Mauch, M., & Dixon, S. (2014). Sequential complexity as a descriptor for musical similarity. IEEE/ACM Transactions on Audio, Speech, and Language Processing, 22, 1965–1977.
- Frieler, K., & Müllensiefen, D. (2005). The simile algorithm for melodic similarity. Paper presented at the Annual Music Information Retrieval Evaluation exchange (MIREX) as part of the 6th International Conference on Music Information Retrieval (ISMIR), London.
- Friston, K. (2005). A theory of cortical responses. Philosophical Transactions of the Royal Society B, 360, 815–836.
- Goldstone, R. L. (1996). Alignment-based nonmonotonicities in similarity. Journal of Experimental Psychology: Learning, Memory and Cognition, 22, 988–1001.
- Goldstone, R. L., & Son, J. Y. (2005). Similarity. In K. J. Holyoak & R. G. Morrison (Eds.), Cambridge Handbook of Thinking and Reasoning (pp. 13–36). Cambridge: Cambridge University Press.
- Gómez, C., Abad-Mota, S., & Ruckhaus, E. (2007). An analysis of the Mongeau-Sankoff algorithm for music information retrieval. Proceedings of the 8th International Symposium on Music Information Retrieval (pp. 109–110). Vienna, Austria.
- Gotoh, O. (1982). An improved algorithm for matching biological sequences. Journal of Molecular Biology, 162, 109–110.
- Graachten, M., Arcos, J. L., & de Mántaras, R. L. (2005). Melody retrieval using the Implication/Realization model. Proceedings of the 6th International Conference on Music Information Retrieval, London. Queen Mary University of London.
- Hahn, U., & Chater, N. (1998). Understanding similarity: A joint project for psychology, case-based reasoning and law. Artificial Intelligence Review, 12, 393–427.
- Hahn, U., Chater, N., & Richardson, L. B. (2003). Similarity as transformation. Cognition, 1987, 1–32.
- Hansen, N. C., & Pearce, M. T. (2014). Predictive uncertainty in auditory sequence processing. Frontiers in Psychology, 5, 1052.
- Hilleware, R., Manderick, B., & Conklin, D. (2012). String methods for folk tune genre classification (pp. 217–222). Proceedings of the 13th Conference of the International Society for Music Information Retrieval. Porto, Portugal
- Hodgetts, C. J., Hahn, U., & Chater, N. (2009). Transformation and alignment in similarity. Cognition, 113, 62–79.
- Hopcroft, J. E., & Ullman, J. D. (1979). Introduction to Automata Theory, Languages and Computation. Reading, MA: Addison-Wesley.
- Jesser, B. (1990). Interaktive Melodieanalyse: Methodik und Anwendung computergestützter Analyseverfahren in Musikethnologie und Volksliedforschung. Typologische Untersuchung der Balladensammlung des DVA. Bern: Peter Lang.
- Kaiser, H. F. (1974). An index of factorial simplicity. Psychometrika, 39, 31–36.
- Krumhansl, C. L. (1983). Perceptual structures for tonal music. Music Perception, 1, 24–58.
- Lamont, A., & Dibben, N. (2001). Motivic structure and the perception of similarity. Music Perception, 18, 245–274.
- Lemström, K., Mikkillä, N., Mäkinen, V., & Ukkonen, E. (2005). String matching and geometric algorithm for melodic similarity. Paper presented at the Annual Music Information Retrieval Evaluation exchange (MIREX) as part of the 6th International Conference on Music Information Retrieval (ISMIR). London.
- Li, M., Chen, X., Li, X., Ma, B., & Vitányi, P. M. B. (2004). The similarity metric. IEEE Transactions on Information Theory, 50, 3250–3264.
- Li, M., & Sleep, R. (2004). Melody classification using a similarity metric based on kolmogorov complexity. Proceedings of the Sound and Music Computing Conference, Paris, France.
- Li, M., & Sleep, R. (2005). Genre classification via an LZ78-based string kernel. Proceedings of Sixth Conference of the International Society for Music Information Retrieval (pp. 252–259). London, UK
- Louboutin, C., & Meredith, D. (2016). Using general-purpose compression algorithms for music analysis. Journal of New Music Research, 45, 1–16.
- Manning, C. D., & Schütze, H. (1999). Foundations of Statistical Natural Language Processing. Cambridge, MA: MIT Press.
- Markman, A. B., & Gentner, D. (1993). Structural alignment during similarity comparisons. Cognitive Psychology, 25, 431–467.
- Marsden, A. (2012). Interrogating melodic similarity: a definitive phenomenon or the product of interpretation? Journal of New Music Research, 41, 323–335.
- McKay, C., & Fujinaga, I. (2004). Automatic genre classification using large high-level musical feature sets. Proceedings of the 5th International Conference on Music Information Retrieval (pp. 525–530). Barcelona, Spain.
- McNab, R. J., Smith, L. A., Witten, I. H., Henderson, C. L., & Cunningham, S. J. (1996). Towards the digital music library: Tune retrieval from acoustic input. Proceedings of the ACM Digital Libraries Conference (pp. 11–18).
- Meek, C., & Birmingham, W. (2002). Johnny can’t sing: A comprehensive error model for sung music queries. In M. Fingerhut, (Ed.), Proceedings of the Third International Conference on Music Information Retrieval (pp. 124–132). Paris: IRCAM.
- Meredith, D. (2014). Using point-set compression to classify folk songs. Istanbul, Turkey: In Proceedings of the Fourth International Workshop on Folk Music Analysis.
- Meredith, D., Lemström, K., & Wiggins, G. (2002). Algorithms for discovering repeated patterns in multidimensional representations of polyphonic music. Journal of New Music Research, 31, 321–345.
- Messick, S. (1995). Standards of validity and the validity of standards in performance assessment. Educational Measurement: Issues and Practice, 14, 5–8.
- Moffat, A. (1990). Implementing the PPM data compression scheme. IEEE Transactions on Communications, 38, 1917–1921.
- Mongeau, M., & Sankoff, D. (1990). Comparison of musical sequences. Computers and the Humanities, 24, 161–175.
- Müllensiefen, D. (2004). Variabilität and Konstanz von Melodien in der Erinnerung: ein Beitrag zur musikpsychologischen Gedächtnisforschung (PhD thesis). Hamburg, Germany: Institute of Musicology, University of Hamburg.
- Müllensiefen, D., & Frieler, C. (2004). Cognitive adequacy in the measurement of melodic similarity: Algorithmic vs. human judgments. Computing in Musicology, 13, 147–176.
- Müllensiefen, D., & Pendzich, M. (2009). Court decisions on music plagiarism and the predictive value of similarity algorithms. MusicæScientiæ, Discussion Forum, 4B, 257–295.
- Narmour, E. (1990). The Analysis and Cognition of Basic Melodic Structures: The Implication-realisation Model. Chicago: University of Chicago Press.
- Needleman, S. B., & Wunsch, C. D. (1970). A general method applicable to the search for similarities in the amino acid sequence of two proteins. Journal of Molecular Biology, 48, 443–53.
- Omigie, D., Pearce, M. T., & Stewart, L. (2012). Intact implicit tracking of pitch probabilities in congenital amusia. Neuropsychologia, 50, 1483–1493.
- Omigie, D., Pearce, M. T., & Stewart, L. (2013). Electrophysiological correlates of melodic processing in congenital amusia. Neuropsychologia, 51, 1749–1762.
- Orio, N. (2005). Combining multilevel and multi-feature representation to compute melodic similarity. Paper presented at the Annual Music Information Retrieval Evaluation exchange (MIREX) as part of the 6th International Conference on Music Information Retrieval (ISMIR). London.
- Oura, Y., & Hatano, G. (1988). Memory for melodies among subjects differing in age and experience of music. Psychology of Music, 16, 91–109.
- Pauws, S. (2002). Cuby hum: A fully operational query by humming system. In M. Fingerhut, (Ed.), Proceedings of the Third International Conference on Music Information Retrieval (pp. 187–196). Paris: IRCAM.
- Pearce, M. T. (2005). The construction and evaluation of statistical models of melodic structure in music perception and composition ( PhD thesis). London, UK: Department of Computing, City University.
- Pearce, M. T., Conklin, D., & Wiggins, G. A. (2005). Methods for combining statistical models of music. In U. K. Wiil (Ed.), Computer Music Modelling and Retrieval (pp. 295–312). Berlin: Springer.
- Pearce, M. T., Müllensiefen, D., & Wiggins, G. A. (2010). The role of expectation and probabilistic learning in auditory boundary perception: A model comparison. Perception, 39, 1367–1391.
- Pearce, M. T., Ruiz, M. H., Kapasi, S., Wiggins, G. A., & Bhattacharya, J. (2010). Unsupervised statistical learning underpins computational, behavioural and neural manifestations of musical expectation. NeuroImage, 50, 302–313.
- Pearce, M. T., & Wiggins, G. A. (2006). Expectation in melody: The influence of context and learning. Music Perception, 23, 377–405.
- Rissanen, J., & Langdon, G. G. (1981). Universal modeling and coding. IEEE Transactions on Information Theory, 27, 12–23.
- Rust, J., & Golombok, S. (2008). Modern Psychometrics: The Science of Psychological Assessment. London: Routledge.
- Sailer, C. (2006). Two note-based approaches to query by singing/humming. Proceedings of the Second Annual Music Information Retrieval Evaluation Exchange (pp. 83–85). Victoria, Canada.
- Sayood, K. (2012). Introduction to data compression (4th ed.). San Francisco: Morgan Kaufmann.
- Schellenberg, E. G. (1996). Expectancy in melody: Tests of the implication-realisation model. Cognition, 58, 75–125.
- Schellenberg, E. G. (1997). Simplifying the implication-realisation model of melodic expectancy. Music Perception, 14, 295–318.
- Seward, J. (2010). bzip2 version 1.06 released 20 september 2010. Accessed March 31, 2016, from http://www.bzip.org
- Shepard, R. N. (1987). Towards a universal law of generalization for psychological science. Science, 237, 1317–1323.
- Sloboda, J. A., & Parker, D. H. H. (1985). Immediate recall of melodies. In P. Howell, I. Cross, & R. West (Eds.), Musical Structure and Cognition (pp. 143–167). London: Academic Press.
- Suyoto, I. S., & Uitdenbogerd, A. L. (2005). Simple efficient n-gram indexing for effective melody retrieval. Paper presented at the Annual Music Information Retrieval Evaluation exchange (MIREX) as part of the 6th International Conference on Music Information Retrieval (ISMIR), London.
- Tverskey, A., & Gati, I. (1982). Similarity, separability and the triangle inequality. Psychological Review, 89, 123–154.
- Tversky, A. (1977). Features of similarity. Psychological Review, 84, 327–352.
- Typke, R. (2007). Music retrieval based on melodic similarity (PhD thesis). Netherlands: Utrecht University.
- Typke, R., den Hoed, M., de Nooijer, J., Wiering, F., & Veltkamp, R. C. (2005). A ground truth for half a million musical incipits. Journal of Digital Information Management, 3, 34–39.
- Typke, R., Veltkamp, R. C., & Wiering, F. (2006). A measure for evaluating retrieval techniques based on partially ordered ground truth lists. Proceedings of the 7th International Conference of Multimedia and Expo (ICME’06) (pp. 128–135). Toronto, Canada.
- Typke, R., Wiering, F., & Veltkamp, R. C. (2005). Evaluating the earth mover’s distance for measuring symbolic melodic similarity. Paper presented at the Annual Music Information Retrieval Evaluation exchange (MIREX) as part of the 6th International Conference on Music Information Retrieval (ISMIR). London
- Uitdenbogerd, A.L. (2002). Music information retrieval technology (PhD thesis). Australia: RMIT University of Melbourne.
- van Kranenburg, P., Volk, A., Wiering, F. & Veltkamp, R.C. (2009). Musical models for folk song melody alignment. Proceedings of the 10th International Symposium on Music Information Retrieval (pp. 507–512).
- Welch, T. A. (1984). A technique for high-performance data compression. IEEE Computer, 17, 8–19.
- Witten, I. H., & Bell, T. C. (1991). The zero-frequency problem: Estimating the probabilities of novel events in adaptive text compression. IEEE Transactions on Information Theory, 37, 1085–1094.
- Zielinska, H., & Miklaszewski, K. (1992). Memorising two melodies of different style. Psychology of Music, 20, 95–111.
- Ziv, J., & Lempel, A. (1977). A universal algorithm for sequential data compression. IEEE Transactions on Information Theory, 23, 337–343.
- Ziv, J., & Lempel, A. (1978). Compression of individual sequences via variable-rate coding. IEEE Transactions on Information Theory, 24, 530–536.
Appendix 1
The mean similarity ratings used in Section 4 were computed from subsets of participants who met criteria of criterion validity and test–retest reliability specified by Müllensiefen & Frieler (Citation2004) prior to conducting their data analysis (see Section 3). This resulted in the removal of 59 out of 82 participants for Experiment 1, four out of 16 participants for Experiment 2 and five out of 10 participants for Experiment 3. After the present analysis was conducted, mean similarity ratings were computed for all participants in each experiment. The two sets of similarity ratings were highly correlated: r(82) = .987, p .01 for Experiment 1; r(22) = .993, p
.01 for Experiment 2; and r(30) = .981, p
.01 for Experiment 3.
Table A1. Coefficients for the Pearson correlation between three similarity algorithms (edit distance, opti3 and ) and mean similarity ratings for all participants in Experiments 1-3. Figures in brackets indicate 95% confidence intervals. See main text for details of the algorithms. The parameters of the
models correspond exactly to those shown in Table .
This suggests that the removal of participants who failed to meet the validity and reliability criteria had very little effect on the mean similarity ratings. Consequently model comparisons run on the mean similarity ratings from all participants yielded an almost identical pattern of results with only small numerical differences from the results of the primary analysis reported in Section 4. The overall results of this analysis are summarised in Table which corresponds to Table in the primary analysis.