
 ?Mathematical formulae have been encoded as MathML and are displayed in this HTML version using MathJax in order to improve their display. Uncheck the box to turn MathJax off. This feature requires Javascript. Click on a formula to zoom.
ABSTRACT
Following the steps of antigen synthesis, immunization, cell fusion, ascites preparation and purification, a maduramicin (MD) monoclonal antibody (mAb) was produced. This MD-mAb demonstrated a 50% inhibition concentration value of 3.75 ng/ml, an affinity constant of 3.70 × 10¹⁰ l/mol, and the isotype was IgG3. The MD-mAb has no cross-reactivity with other polyether antibiotics. Using this MD-mAb, a gold immunochromatographic assay was developed to detect MD residues in chicken breast and egg samples. For semi-quantitative detection by the naked eye, the visual limit of detection was 5 ng/g in chicken breast, 10 ng/g in egg. Quantitative results can be obtained by a hand-held strip scan reader, with the detection range of 5.11–19.34 ng/g in chicken breast and 6.46–27.87 ng/g in egg. The strip test took 10 min to run in total. This strip assay is suitable for on-site detection of MD residues in chicken breast and egg samples.
KEYWORDS:
1. Introduction
Maduramicin (MD) is a relatively new monoglycoside polyether ionophore antibiotic, which was derived from the Actinomadura rubra in 1983. Because MD has the advantages of fewer times of usage, quick effect and less likelihood of drug resistance, it has been widely used as an anticoccidial drug in poultry production (Dorne et al., Citation2013; Zhang, Wang, Ruan, & An, Citation2013). As a feed additive, MD can improve the feed conversion ratio, reduce feeding cost, and shorten the feeding period. Due to overuse or abuse of MD in feeds, the livestock may develop symptoms of poisoning (Shimshoni et al., Citation2014), which can lead to huge economic costs for the breeding enterprise. The residues of MD in animal food stuff can also take a toll on human health (Dorne et al., Citation2013). In order to ensure food safety, official regulations have set the maximum residue level for MD. In China, the maximum residue levels for MD in chicken tissues are 240 μg/kg in muscle, 480 μg/kg in fat and skin, and 720 μg/kg in liver. Moreover, MD is forbidden from use during the chicken laying period.
The most common methods for MD analysis in chickens are chromatography methods, including high-performance liquid chromatography with fluorescence or UV detection, and liquid chromatography-tandem mass spectrometry (LC-MS/MS) (Chang, Su, & Cheng, Citation2013; Clarke et al., Citation2014; Pereira et al., Citation2016; Varenina et al., Citation2015). Both methods have the advantages of high analytic sensitiveness and accurate detection results. However, MD has no fluorophore or UV absorption, so it requires derivatization before detection in the high-performance liquid chromatography assays (Jong et al., Citation2004). The process of sample preparation is also complicated, and requires purification with solid-phase extraction (SPE). Although the novel SPE techniques decrease the use of organic solvent and sample contamination, these facilities are expensive and increase test cost. Moreover, these methods are time consuming and require a professional operator. In short, they are not suitable for high throughput, routine analysis for MD residues in actual samples.
Enzyme-linked immunosorbent assay (ELISA) is also an analytical method for MD detection recently developed. Shen, Qian, Jiang, and Yang (Citation2001) developed an ELISA for MD detection based on the preparation of MD polyclonal antibody in broiler chicken tissues, with the detection limit of 1.0 ng/g in muscle. Chen, Tang, Ding, He, and Xiao (Citation2009) also developed an ELISA for MD using an anti-MD monoclonal antibody (mAb) with the detection limit of 6.5 μg/kg in muscle. Additionally, based on an anti-MD polyclonal antiserum, Wang, Zhang, Murtazina, Eremin, and Shen (Citation2008) developed a fluorescence polarization immunoassay for MD detection in chicken muscle, fat and egg samples. All of these immune assay methods have the features of short assay time, simple to operate, cost-effectiveness and being high throughput.
With the development of nanotechnology, antibody has been labelled by novel nano-materials, including nanoparticles, quantum dots and up-conversion materials, to develop immune chromatography. Some of these reagents have already been used for medical diagnosis and veterinary drug residues in food (Guo et al., Citation2015; Kong et al., Citation2016; Li et al., Citation2015, Citation2016; Sharma, Ragavan, Thakur, & Raghavarao, Citation2015; Wang et al., Citation2015; Wu et al., Citation2017; Xing et al., Citation2015). These methods are easier, and take less time than ELISA. However, there are few reports describing immune chromatography for MD analysis.
In this research, based on the preparation of the MD-mAb, we developed a gold immunochromatography assay for detection of MD residues in chicken breast and eggs samples.
2. Materials and methods
2.1. Reagents and instruments
Standards, including MD, monensin, salinomycin, narasin, nigericin and lasalocid, were all purchased from J&K Scientific Ltd (Shanghai, China). Carrier proteins including keyhole limpet haemocyanin (KLH) and ovalbumin (OVA), coupling reagents containing 1-ethyl-3-(3-dimethylamino-propyl) carbodiimide (EDC) and N-hydroxysuccinimide (NHS), immune adjuvant including complete Freund’s adjuvant and incomplete Freund’s adjuvant, chlorauric acid (HAuCl4•4H2O) for nanoparticles synthesis, PEG 1450 for cell fusion were all obtained from Sigma-Aldrich Ltd. (Shanghai, China). All other regents for cell culture were purchased from Thermo Fisher Scientific Inc. (Shanghai, China). Chicken breast and eggs samples were purchased from Auchan supermarket (Wuxi, China).
The materials used for preparing the test strip, including polyethylene adhesive cards, sample pads, absorbent pads and nitrocellulose (NC) membranes, were obtained from JieYi Biotech Co. Ltd (Shanghai, China). The hand-held strip scan reader was provided by Meizheng Bio-Tech Co. Ltd (Wuxi, China)
2.2. Preparation of antigen
The molecular structure of MD contains one carboxyl group, which can be conjugated with carrier proteins by the active ester (EDC/NHS) method (Wang et al., Citation2016, Citation2017). MD (8.29 mg), NHS (3.04 mg) and EDC (5.05 mg) were dissolved in 2 ml N,N-dimethylformamide and activated for 5–6 h at room temperature with gently stirring. Then, the mixture was added dropwise to a KLH (20 mg) solution dissolved in 4 ml carbonate buffer solution (0.1 M, pH 9.6), and reacted overnight at room temperature with constant stirring. Finally, the reaction products were purified by dialysis in phosphate buffered saline (PBS, 0.01 M, pH 7.4) five to six times at 4°C, and the immunogen (MD-KLH) was obtained. The conjugation of MD-OVA was prepared in the same way and used as the coating antigen. The antigen concentration after dialysis was determined with UV-visible spectroscopy (Bokin Instruments, Tsushima, Japan) at 280 nm. The conjugates were analysed with sodium dodecyl sulphate polyacrylamide gel electrophoresis (SDS-PAGE).
2.3. Immunization and cell fusion
The immunogen (MD-KLH) was diluted to 1 mg/ml in normal saline. Five female BALB/c mice (6–8 weeks of age) were immunized with the MD-KLH to produce the anti-MD antibody. The detailed immunization procedures were as follows. For the first immunization, the MD-KLH (800 μl) emulsified with isovolumetric complete Freund’s adjuvant was subcutaneously injected into the mice. Twenty-one days later, these mice were given a half dose of MD-KLH emulsified with isovolumetric incomplete Freund’s adjuvant in the same way. Every 21 days, the mice were given a booster immunization following the procedure used for the second immunization. Six to eight days after the third immunization, blood samples were collected and evaluated with ELISA. After the fourth immunization, the mouse that was positive for high-affinity antibodies to MD was injected with 100 μl MD-KLH without any immunoadjuvant. Three days later, the mice were sacrificed for cell fusion (Liu, Xing, Yan, Kuang, & Xu, Citation2014). The spleen was taken out under sterile conditions and homogenized. After washing three times, the spleen cells were fused with Sp2/0 cells using PEG 1450. The hybridoma cells were obtained after HAT medium screening (Liu, Yan, Zhang, Kuang, & Xu, Citation2015).
2.4. Screening of cell culture supernatants
The cell culture supernatants were screened with indirect competitive ELISA (ic-ELISA) as described (Liu, Xing, et al., Citation2014; Song et al., Citation2016; Zhu, Song, Liu, Kuang, & Xu, Citation2016). First, 96-well microtitre plates were coated with MD-OVA at the concentration of 0.2 μg/ml in coating buffer (0.05 M carbonate buffer solution) with 100 μl/well at 37°C for 2 h. Second, the plates were washed with PBS with 0.05% Tween-20 three times, then 200 μl blocking buffer (coating buffer with 0.1% gelatin) was added to each well and incubated at 4°C overnight. These plates were dried in an oven at 37°C for further use. Next, the cell culture supernatants (50 μl/well) were transferred into the corresponding microtitre plates, and then incubated with PBS at 37°C for 30 min. After the plates were washed three times using PBS with 0.05% Tween-20, 100 μl/well of HRP-labelled goat anti-mouse antibody (1:3000) was added and incubated for 30 min. Following the final wash, the plates were incubated with 100 μl/well of tetramethylbenzidine substrate solution for 15 min at 37°C. To stop the reaction, 50 μl of 2 M H2SO4 was added. The absorption values at 450 nm were measured by a microplate reader. The wells that demonstrated colour development were selected for further analysis. The cell supernatants from the positive wells were diluted four times, incubated with MD (diluted in PBS), while PBS was used as blank control group. The following steps were performed as described previously. Finally, the wells showing high affinity and good sensitivity to MD were subcloned three times using a limiting dilution method to obtain pure cell lines. After culturing on a large scale, the screened hybridomas were cryopreserved in a nitrogen canister.
2.5. Preparation and purification of ascites
BALB/c mice were used for preparing ascites fluid. After pre-injecting sterilized paroline (1 ml) for 6–10 days, the mice were injected with the hybridoma cells (1 × 10⁷). The ascites fluid was collected 7–10 days later. The MD-mAb was purified from the ascites using the octylic acid–ammonium sulphate precipitation method. After dialysis in 0.01 M, pH 7.4 PBS, the MD-mAb was obtained. The concentration of MD-mAb was tested by UV-visible spectroscopy. The MD-mAb was aliquoted and stored at −20°C.
2.6. Characterization of MD-mAb
The specific ic-ELISA protocol described previously for cell supernatant screening was used to characterize the properties of the MD-mAb, including affinity, sensitivity, specificity and its subtypes.
According to previous research, the affinity of MD-mAb was evaluated with chequerboard assays. The coating concentration of MD-OVA was 1, 0.33 and 0.11 µg/ml. Third echelon dilution series starting from 1 µg/ml was used for the antibody. Taking the antibody concentration (mol/l) as the X-axis, the OD/OD0 value (the ratio of absorption at the same coating concentration), these working points were performed curve fitting by Origin 8.5 software. From the curve, we can determine the antibody concentration when the absorbance is at 50% OD0 ([Ab]t). The affinity constant can be calculated with the following formula (n is the ratio of the coating concentration between each two group) (Beatty, Beatty, & Vlahos, Citation1987):
The best working coating and antibody concentrations can also be determined from the foregoing chequerboard assays. Under the best working concentration, a series of MD standard solutions (0, 1, 2, 5, 10, 20, 50 and 100 ng/ml) were tested, and then the standard curve for MD was established using a four-parameter logistic function. The 50% inhibition concentration (IC50) of MD was used to evaluate the sensitivity of the MD-mAb.
The specificity of the antibody was assessed for cross-reactivity (CR) with other polyether antibiotics, including monensin, salinomycin, narasin, nigericin and lasalocid. The CR values were calculated with the following equation according to our previous work (Kuang et al., Citation2013):
The subtype of this antibody was determined by using the Mouse Monoclonal Antibody Isotyping Kits (Sino Biological Inc., Beijing).
2.7. Synthesis of gold nanoparticles
Gold nanoparticles (GNPs) with the diameter of 20 nm were synthesized as follows. All glassware was immersed into aqua regia for 12–24 h, rinsed several times with ultrapure water, and dried before use. Under vigorous stirring conditions, 25 ml of chloroauric acid solution (1 g/l) was added to 225 ml of ultrapure water. The solution was heated to boiling. Ten minutes later, 2 ml of freshly prepared sodium citrate solution (2%, w/v) was quickly added. Once the colour of the solution changed to wine red, the solution was boiled for another 30 min under continuous stirring. The GNPs solution was uniform wine red in appearance. The solution was cooled to room temperature and stored at 4°C for further use (Chen et al., Citation2017; Kong et al., Citation2017; Liu et al., Citation2017).
2.8. Labelling of the MD-mAb with GNPs
The MD-mAb was labelled with GNPs as described in our recent reports. Before labelling, the MD-mAb was diluted to 0.2 mg/ml with BB solution (0.2 mmol, pH 8.2). The pH of the GNPs solution was adjusted to 8.2 with 0.1 M K2CO3. The MD-mAb was then added to the GNPs solution (10 ml), mixed and agitated gently at room temperature. Fifty minutes later, 1 ml of bull serum albumin (0.5%, w/v) was slowly added to block unbound positions, and incubated for 2 h at room temperature with continuous vibrating. After centrifugation at 6000 g for 45 min, the sediment was resuspended in 1 ml BB solution (2 mmol, pH 8.2) containing 5% trehalose, and stored at 4°C for use (Peng et al., Citation2016).
2.9. Assembly of immunochromatographic strip
The immunochromatographic strip (ICS) is made up of four sections, including a sample pad, an absorbent pad, NC membrane and a backing card. There is test zone (T-line) and control zone (C-line) on the centre of the NC membrane. After the coating antigen (MD-OVA) and the goat anti-mouse IgG were sprayed on the T-line and C-line, respectively, the NC membrane was dried for 2 h at 37°C. Then the strip was assembled layer by layer, with the NC membrane first pasted on the backing card, then the sample pad was adhered to the side of the card next to the T-line and the absorbent pad close to the C-line. Finally, the card was cut to strips 3 mm in width. These strips were stored in a valve bag at room temperature for further use (Guo et al., Citation2015). Before testing, the processed sample was mixed with labelled MD-mAb in the microtitre plate for 5 min. The strip was then added to the well and results were obtained after 10 min.
2.10. Calibration curve of the MD strip in chicken breast and egg samples
Negative egg and chicken breast samples were confirmed by Jiangsu Entry-Exit Inspection and Quarantine Bureau. Spiked samples were used to analyse the detection of the MD strip.
Three grams of homogenized chicken breast or mixed eggs sample was put in a 50 ml centrifuge tube. Acetonitrile (15 ml) was added, vortexed for 2 min, and vibrated for 10 min on a shaking table (Varenina et al., Citation2015). The sample was then centrifuged at 6000 g for 10 min. Supernatant was dried under nitrogen at 50°C, and re-dissolved in 3 ml PBS. After centrifugation at 3000 g for 3 min, the supernatant was used as the matrix for analysis.
The MD standard curve was established by spiking purified MD into the matrix. The spiked concentrations were 0, 2.5, 5, 10, 25, 50 ng/g. The colour intensity (T) of the T-line was read using a hand-held strip scan reader. With the MD concentration as the X-axis and T/T0 as the Y-axis, the standard curve of MD in chicken breast and egg samples was determined. Each point was read five times (Kong et al., Citation2016).
3. Results and discussion
3.1. Characterization of antigens
Because of its low molecular weight, MD is not immunogenic. Therefore, we needed to conjugate MD to a carrier protein. After immunizing BALB/c mice four to six times, the mice produced an MD antibody response.
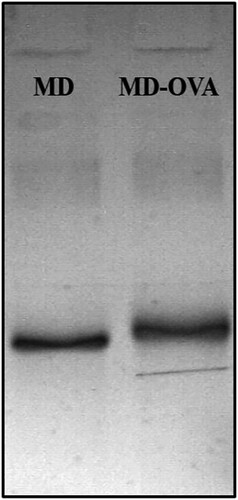
The electrophoretograms of MD-OVA are shown in . Because the molecular weight of the conjugation is higher than that of the carrier protein, the band of MD-OVA in SDS-PAGE runs relatively slower than OVA under the same condition. The molecular weight of KLH is around 450,000 daltons, so the KLH conjugation cannot be characterized with SDS-PAGE.
Figure 1. The SDS-PAGE analysis for MD-OVA.
3.2. Characterization of MD-mAb
The sensitivity and affinity of MD-mAb are shown in . The IC50 value of this antibody is 3.75 ng/ml ((a)), which is sufficient for the needs of MD analysis and determination. The affinity constant (Ka) was calculated to be 3.70 × 10¹⁰ l/mol, which provides opportunities for further uses of this antibody ((b)). The antibody with high affinity can be applied to a preparative immune-affinity column for sample purification. As shown in , the MD-mAb has no CR (<0.1%) with monensin, salinomycin, narasin, nigericin and lasalocid, which explains why this antibody has relatively high specificity. The subtype of MD-mAb was IgG3 (), which can effectively guide further antibody purification.
Figure 2 (a) The standard curve for MD with ic-ELISA and (b) results of affinity constant of MD-mAb.
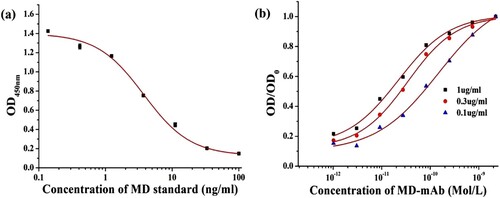
Figure 3. The isotype identification results of MD-mAb.
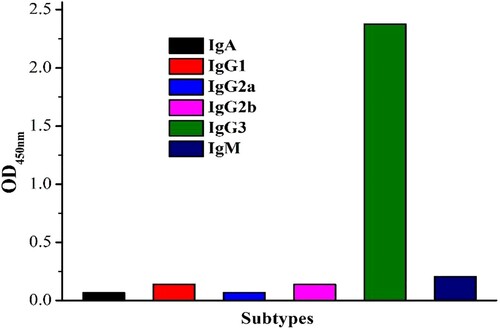
Table 1. CR results of MD-mAb.
3.3. Preparation of GNPs-labelled MD-mAb
The proper pH is the key factor in synthesizing GNPs-labelled antibody. When the pH value of the GNPs solution is greater than or equal to the isoelectric point of the antibody, the labelled antibody can form a stable colloidal solution. The pH was adjusted to 8.2 by adding 4 µl 0.1 M K2CO3 to 1 ml of GNPs solution (Liu, Luo, et al., Citation2014).
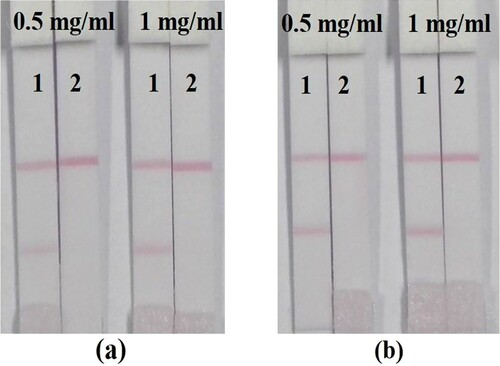
In addition, the quantity of antibody or antigen is also important because it can influence the sensitivity of the strip. If the antibody or antigen is in too much excess, the conjugation of the labelled antibody with antigen may be stronger than that of the labelled antibody with free determinant. The cut-off value of the strip will be higher. In contrast, if the antibody or antigen is limiting, the colour of the T-line may be too light to be observed by the naked eye. Therefore, the amounts of MD-mAb (8 or 10 µg/ml GNPs solution) and the coating concentration of MD-OVA (0.5 or 1 mg/ml) were optimized. The best combination was determined to be 10 µg/ml MD-mAb and 1 mg/ml MD-OVA ().
Figure 4. The coating concentration and the MD-mAb dose for ICS analysis (1 = 0, 2 = 50 ppb). (a) The MD-mAb dose is 8 ug/ml and (b) The MD-mAb dose is 10 ug/ml.
3.4. Principle and validation of the MD strip
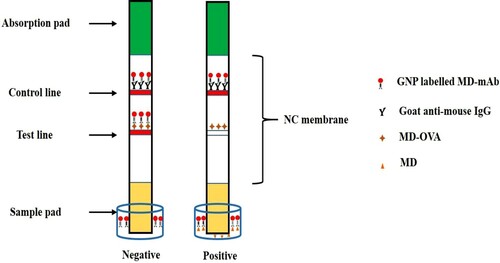
The principle of the ICS for detection of MD is based on the competing reaction between free MD in samples and the MD-OVA on the T-line with the labelled MD-mAb. As shown in , the mixture solution flowed from the sample pad to the absorbent pad due to capillary effect. If the sample was positive, the free MD conjugated with the labelled MD-mAb, and then the antibody was not available to react with the MD-OVA on the T-line. When the solution reached the C-line, the conjugated and unconjugated labelled MD-mAb combined with the goat anti-mouse IgG on the C-line. If the sample was negative, the labelled MD-mAb was able to conjugate with MD-OVA on the T-line, and the excess labelled MD-mAb still reacted with the goat anti-mouse IgG on the C-line. Because the labelled MD-mAb was visible by naked eyes, there were two red zones on the T-line and C-line, respectively. If the sample was positive, the colour of the T-line became weaker due to the increase in free MD in the sample solution. When the T-line was colourless, that concentration of MD was called cut-off value of the strip. We were able to make a semi-quantitative analysis for MD by naked eye. According to visual inspection from , the cut-off value of this strip was 50 ng/g in chicken breast and egg sample. Additionally, the free MD concentration at which the colour of T-line was obviously weaker than that of C-line was called the visual limit of detection (vLOD) value. The vLOD of this strip was 5 and 10 ng/g in chicken breast and eggs sample, respectively.
Figure 5. Principle of ICS based on MD-mAb.
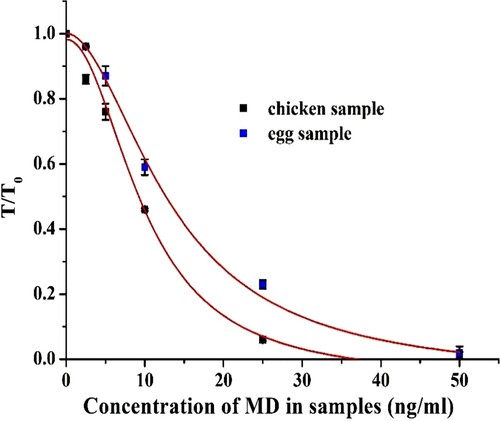
In addition, quantitative results can be acquired by the hand-strip scan reader. The standard curves of MD in chicken breast and eggs samples are shown in . The detection range (IC20–IC80) was 5.11–19.34 ng/g in chicken breast, and 6.46–27.87 ng/g in egg sample.
Figure 6. The standard curve for MD with ICS analysis in spiked chicken breast and egg samples.
4. Conclusion
In this study, a high-sensitivity, high-affinity and high-specificity MD-mAb was prepared. Using this antibody, we developed a strip assay for MD detection, which can be performed within 10 min. The test results of the spiked chicken breast and eggs sample showed that both semi-quantitative and quantitative detection are feasible. This strip sensor can be widely used for the detection of MD residues in chicken breast and eggs samples.
Disclosure statement
No potential conflict of interest was reported by the authors.
Additional information
Funding
Related Research Data
References
- Beatty, J. D., Beatty, B. G., & Vlahos, W. G. (1987). Measurement of monoclonal antibody affinity by non-competitive enzyme immunoassay. Journal of Immunological Methods, 100, 173–179. doi: https://doi.org/10.1016/0022-1759(87)90187-6
- Chang, K. C., Su, J. J., & Cheng, C. (2013). Development of online sampling and matrix reduction technique coupled liquid chromatography/ion trap mass spectrometry for determination maduramicin in chicken meat. Food Chemistry, 141, 1522–1529. doi: https://doi.org/10.1016/j.foodchem.2013.04.016
- Chen, Y., Liu, L., Xu, L., Song, S., Kuang, H., Cui, G., & Xu, C. (2017). Gold immunochromatographic sensor for the rapid detection of twenty-six sulfonamides in foods. Nano Research, 10, 2833–2844. doi: https://doi.org/10.1007/s12274-017-1490-x
- Chen, Y., Tang, S., Ding, S., He, F., & Xiao, X. (2009). Monoclonal antibody-based immunoassay for the detection of maduramicin in chicken tissues. Analytical Letters, 42, 2793–2806. doi: https://doi.org/10.1080/00032710903201966
- Clarke, L., Fodey, T. L., Crooks, S. R., Moloney, M., O’Mahony, J., Delahaut, P., … Danaher, M. (2014). A review of coccidiostats and the analysis of their residues in meat and other food. Meat Science, 97, 358–374. doi: https://doi.org/10.1016/j.meatsci.2014.01.004
- Dorne, J., Fernández-Cruz, M., Bertelsen, U., Renshaw, D., Peltonen, K., Anadon, A., … Fink-Gremmels, J. (2013). Risk assessment of coccidostatics during feed cross-contamination: Animal and human health aspects. Toxicology and Applied Pharmacology, 270, 196–208. doi: https://doi.org/10.1016/j.taap.2010.12.014
- Guo, L., Song, S., Liu, L., Peng, J., Kuang, H., & Xu, C. (2015). Comparsion of an immunochromatographic strip with ELISA for simultaneous detection of thiamphenicol, florfenicol and chloramphenicol in food samples. Biomedical Chromatography, 29, 1432–1439. doi: https://doi.org/10.1002/bmc.3442
- Jong, J. D., Stoisser, B., Wagner, K., Tomassen, M., Driessen, J., Hofmann, P., & Putzka, H.-A. (2004). Determination of maduramicin in feedingstuffs and premixtures by liquid chromatography: Development, validation, and interlaboratory study. Journal of AOAC International, 87, 1033–1041.
- Kong, D., Liu, L., Song, S., Suryoprabowo, S., Li, A., Kuang, H., … Xu, C. (2016). A gold nanoparticle-based semi-quantitative and quantitative ultrasensitive paper sensor for the detection of twenty mycotoxins. Nanoscale, 8, 5245–5253. doi: https://doi.org/10.1039/C5NR09171C
- Kong, D., Xie, Z., Liu, L., Song, S., Kuang, H., & Xu, C. (2017). Development of ic-ELISA and lateral-flow immunochromatographic assay strip for the detection of vancomycin in raw milk and animal feed. Food and Agricultural Immunology, 28(4), 1–13.
- Kuang, H., Liu, L., Xu, L., Ma, W., Guo, L., Wang, L., & Xu, C. (2013). Development of an enzyme-linked immunosorbent assay for dibutyl phthalate in liquor. Sensors, 13, 8331–8339. doi: https://doi.org/10.3390/s130708331
- Li, S., Xu, L., Ma, W., Kuang, H., Wang, L., & Xu, C. (2015). Triple Raman label-encoded gold nanoparticle trimers for simultaneous heavy metal Ion detection. Small, 11, 3435–3439. doi: https://doi.org/10.1002/smll.201403356
- Li, Y., Xu, J., Wang, L., Huang, Y., Guo, J., Cao, X., … Sun, C. (2016). Aptamer-based fluorescent detection of bisphenol A using nonconjugated gold nanoparticles and CdTe quantum dots. Sensors and Actuators B: Chemical, 222, 815–822. doi: https://doi.org/10.1016/j.snb.2015.08.130
- Liu, R., Liu, L., Song, S., Cui, G., Zheng, Q., Kuang, H., & Xu, C. (2017). Development of an immunochromatographic strip for the rapid detection of 10 β-agonists based on an ultrasensitive monoclonal antibody. Food and Agricultural Immunology, 28(4), 1–14. doi: https://doi.org/10.1080/09540105.2017.1337084
- Liu, L., Luo, L., Suryoprabowo, S., Peng, J., Hua, K., & Xu, C. (2014). Development of an immunochromatographic strip test for rapid detection of ciprofloxacin in milk samples. Sensors, 14, 16785–16798. doi: https://doi.org/10.3390/s140916785
- Liu, L., Xing, C., Yan, H., Kuang, H., & Xu, C. (2014). Development of an ELISA and immunochromatographic strip for highly sensitive detection of microcystin-LR. Sensors, 14, 14672–14685. doi: https://doi.org/10.3390/s140814672
- Liu, L., Yan, H., Zhang, X., Kuang, H., & Xu, C. (2015). Development of an anti-chlorothalonil monoclonal antibody based on a novel designed hapten. Food and Agricultural Immunology, 26, 410–419. doi: https://doi.org/10.1080/09540105.2014.938319
- Peng, J., Wang, Y., Liu, L., Kuang, H., Li, A., & Xu, C. (2016). Multiplex lateral flow immunoassay for five antibiotics detection based on gold nanoparticle aggregations. RSC Advances, 6, 7798–7805. doi: https://doi.org/10.1039/C5RA22583C
- Pereira, M. U., Spisso, B. F., do Couto Jacob, S., Monteiro, M. A., Ferreira, R. G., de Souza Carlos, B., & da Nóbrega, A. W. (2016). Validation of a liquid chromatography–electrospray ionization tandem mass spectrometric method to determine six polyether ionophores in raw, UHT, pasteurized and powdered milk. Food Chemistry, 196, 130–137. doi: https://doi.org/10.1016/j.foodchem.2015.09.011
- Sharma, R., Ragavan, K. V., Thakur, M. S., & Raghavarao, K. S. (2015). Recent advances in nanoparticle based aptasensors for food contaminants. Biosensors and Bioelectronics, 74, 612–627. doi: https://doi.org/10.1016/j.bios.2015.07.017
- Shen, J., Qian, C., Jiang, H., & Yang, H. (2001). Development of an enzyme-linked immunosorbent assay for the determination of maduramicin in broiler chicken tissues. Journal of Agricultural and Food Chemistry, 49, 2697–2701. doi: https://doi.org/10.1021/jf001520g
- Shimshoni, J. A., Britzi, M., Pozzi, P. S., Edery, N., Berkowitz, A., Bouznach, A., … Younis, A. (2014). Acute maduramicin toxicosis in pregnant gilts. Food and Chemical Toxicology, 68, 283–289. doi: https://doi.org/10.1016/j.fct.2014.03.034
- Song, Y., Song, S., Liu, L., Kuang, H., Guo, L., & Xu, C. (2016). Simultaneous detection of tylosin and tilmicosin in honey using a novel immunoassay and immunochromatographic strip based on an innovative hapten. Food and Agricultural Immunology, 27(3), 1–15. doi: https://doi.org/10.1080/09540105.2015.1089843
- Varenina, I., Bilandžić, N., Cvetnić, L., Kos, B., Božić, Đ, Solomun, K. B., & Cvetnić, Ž. (2015). Deposition and depletion of maduramicin residues in eggs after oral administration to laying hens determined by LC-MS. Food Additives & Contaminants Part A Chemistry Analysis Control Exposure & Risk Assessment, 32, 324–332.
- Wang, W., Feng, M., Kong, D., Liu, L., Song, S., & Xu, C. (2015). Development of an immunochromatographic strip for the rapid detection of Pseudomonas syringae pv. maculicola in broccoli and radish seeds. Food and Agricultural Immunology, 26, 738–745. doi: https://doi.org/10.1080/09540105.2015.1023266
- Wang, Z., Xie, Z., Cui, G., Liu, L., Song, S., Kuang, H., & Xu, C. (2017). Development of an indirect competitive enzyme-linked immunosorbent assay and immunochromatographic assay for hydrocortisone residues in milk. Food and Agricultural Immunology, 28(3), 1–13. doi: https://doi.org/10.1080/09540105.2017.1297779
- Wang, Z., Zhang, S., Murtazina, N. R., Eremin, S. A., & Shen, J. (2008). Determination of the veterinary drug maduramicin in food by fluorescence polarisation immunoassay. International Journal of Food Science & Technology, 43, 114–122. doi: https://doi.org/10.1111/j.1365-2621.2006.01400.x
- Wang, Z., Zou, S., Xing, C., Song, S., Liu, L., & Xu, C. (2016). Preparation of a monoclonal antibody against testosterone and its use in development of an immunochromatographic assay. Food and Agricultural Immunology, 27, 1–12. doi: https://doi.org/10.1080/09540105.2015.1055554
- Wu, X., Yang, S., Xu, Y., Zhu, C., Ma, Y., Dan, D., & Lin, Y. (2017). Carbon quantum dots as fluorescence resonance energy transfer sensors for organophosphate pesticides determination. Biosensors and Bioelectronics, 94, 292–297. doi: https://doi.org/10.1016/j.bios.2017.03.010
- Xing, C., Liu, L., Song, S., Feng, M., Kuang, H., & Xu, C. (2015). Ultrasensitive immunochromatographic assay for the simultaneous detection of five chemicals in drinking water. Biosensors and Bioelectronics, 66, 445–453. doi: https://doi.org/10.1016/j.bios.2014.12.004
- Zhang, J. J., Wang, L. X., Ruan, W. K., & An, J. (2013). Investigation into the prevalence of coccidiosis and maduramycin drug resistance in chickens in China. Veterinary Parasitology, 191, 29–34. doi: https://doi.org/10.1016/j.vetpar.2012.07.027
- Zhu, Y., Song, S., Liu, L., Kuang, H., & Xu, C. (2016). An indirect competitive enzyme-linked immunosorbent assay for acrylamide detection based on a monoclonal antibody. Food and Agricultural Immunology, 27, 796–805. doi: https://doi.org/10.1080/09540105.2016.1160369