
 ?Mathematical formulae have been encoded as MathML and are displayed in this HTML version using MathJax in order to improve their display. Uncheck the box to turn MathJax off. This feature requires Javascript. Click on a formula to zoom.
ABSTRACT
In this study, we produced a monoclonal antibody (mAb) 2F7 against cadmium (Cd) with IC50 of 0.20 ng/mL. The cross-reactivity of mAb 2F7 with other eight metals was < 1%. A fluorescent immunoassay strip was developed for the determination of Cd in rice. The cut-off value by visual inspection of the test strip was 50 μg/kg, and the quantitative detection range determined by the strip reader was 3.86–48.92 μg/kg. Both ic-ELISA and the fluorescent immunoassay strip can be used to detect Cd rice. Therefore, our developed fluorescent immunoassay strip may be an effective tool for detecting Cd in rice.
Introduction
Cadmium (Cd) is a toxic metal that enters the body from the environment and accumulates in large quantities (Khafaga, Abd El-Hack, Taha, Elnesr, & Alagawany, Citation2019; Rafati Rahimzadeh, Rafati Rahimzadeh, Kazemi, & Moghadamnia, Citation2017; Liu et al., Citation2017). Excessive Cd causes irreversible damage to organs and systems, especially the kidneys and skeletal system (Kim, Kim, & Kumar, Citation2019; Remelli et al., Citation2016). In Japan, Itai-itai disease is caused by Cd. Cd has been listed as a carcinogen by the International Cancer Research Agency and included in the International Programme on Chemical Safety programme by the World Health Organization (Zhu et al., Citation2020). Certain foods are high sources of Cd (Moallem Bandani et al., Citation2016). Therefore, it is necessary to monitor the content of Cd in rice, which is one of the staple foods around the world (Zhang, Wang, Bao, Wang, & Xie, Citation2019). In the European Union and China, the maximum residue level (MRL)of Cd in rice is 200 μg/kg. And for Russia and Australia, the MRL of Cd is 100 μg/kg.
There are several methods for detecting Cd in rice. Instrument-based Cd detection methods include atomic emission spectrometry (Jiang et al., Citation2020), inductively coupled plasma mass spectrometry (Choi et al., Citation2018), surface-enhanced Raman spectroscopy (Zuo, Chen, Chen, & Yu, Citation2018), and X-ray fluorescence spectrometry (Li et al., Citation2018). These methods are highly accurate for determining Cd content in rice. However, they require large-scale equipment and trained operators and are not suitable for on-site large-scale sample testing.
Immunoassays have been used due to their high throughput, low cost, and high sensitivity. Liu et al. developed a direct competitive ELISA for Cd detection in rice and wheat (G. Liu et al., Citation2009) with a half maximal inhibitory concentration (IC50) of 2.3 μg/kg, consistent with the detection results obtained from graphite furnace atomic absorption spectrometry. Hidekazu Arai et al. developed an immunochromatographic kit for the detection of Cd in brown rice with a quantitative range of 100–1,000 μg/kg (Arai, Nakamura, Yoshida, & Tawarada, Citation2016). Xu et al. used EDTA as a bifunctional chelator and developed a colloidal gold immunochromatographic test strip for the rapid quantitative detection of Cd in rice with a limit of detection (LOD) of 20 μg/kg (Xu et al., Citation2016). It has been reported that the detection sensitivity of the fluorescent immunoassay strip is superior to that of the colloidal gold immunoassay strip. Therefore, we developed a fluorescent immunoassay strip for the quantitative analysis of Cd in rice.
Material and methods
Materials
Cd(II), Ni(II), Hg(II), Cr(III), Pb(II), Cu(II), As(II), Fe(III), and Al(III) (1 mg/mL, in 1 M HCl or 0.5 M HNO3) were purchased from the National Institute of Metrology (Beijing, China). Complete Freund’s adjuvant, keyhole limpet hemocyanin (KLH), incomplete Freund’s adjuvant, bovine serum albumin (BSA), and horseradish peroxidase (HRP) were acquired from Sigma-Aldrich (St. Louis, MO, USA). Isothiocyanobenzyl-EDTA (ITCBE) was supplied by Dojindo Laboratories (Nanjing, China). Gelatin goat anti-mouse immunoglobulin G (IgG) and reagents for cell culture media such as PEG, HAT supplement, and RPMI 1640 were obtained from Jackson ImmunoResearch (West Grove, PA, USA). All equipment were cleaned with diluted acid and pure water (Xing, Hao, Liu, Xu, & Kuang, Citation2013).
Antigen preparation
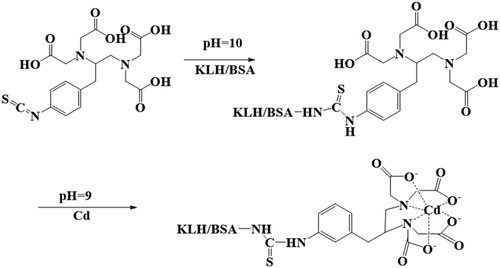
Due to the small molecular weight of Cd, we used a bifunctional chelator, ITCBE, as a bridge between proteins and Cd to synthesize the immunogen (Jin et al., Citation2019). The method () was performed as reported by Song et al. with some modifications (Song, Zou, Zhu, Liu, & Kuang, Citation2017). First, 5 mg of KLH was added to 3 mL of 1 mM HBS (pH = 7.4) and adjusted to pH 10 with 0.5 M NaOH. Second, 100 µL of ITCBE (10 mg/mL) was slowly added, and the reaction was stirred at room temperature for 16–24 h. Third, 0.2 mL of Cd (1 mg/mL) was added dropwise to the solution. During Cd addition, the pH of the solution was maintained at ∼9. Fourth, after 1–2 h, the solution was centrifuged in an Amicon Ultra-4 Ultracel-3 K ultrafiltration centrifuge tube (cut-off value of 3,000 Da) at 6,500 rpm for 20 min. After each ultrafiltration, 3 mL of HBS (0.01 M, pH 7.4) was added to dissolve the suspension. The ultrafiltration step was repeated four times. Finally, HBS (0.01 M, pH 7.4) was added to achieve a final protein concentration of 2 mg/mL. The solution was stored at −20°C.
Figure 1. Conjugation of cadium ions with carrier protein.
Monoclonal antibody (mAb) preparation
The immunogen was converted into an oil-in-water state by using a constant volume of complete Freund's adjuvant. Five female BALB/c mice (6–8 weeks of age) were immunized by subcutaneous injection at multiple points (Guan et al., Citation2015). Every four weeks after the first immunization, we administered booster immunization injections, which were prepared by emulsifying the immunogen with an equal volume of incomplete Freund's adjuvant. The amount of immunogen used per mice was 100 μg/kg in the first immunization and 50 μg/kg in subsequent immunizations. Six to nine days after the third immunization, mouse sera were obtained by tail blood collection, and the same step was performed for subsequent immunizations. The titer and inhibition rate of each serum were detected by indirect competitive ELISA (ic-ELISA; Bai et al., Citation2017). For ic-ELISA, we used 10 μM ITCBE instead of PBS buffer. After the fifth immunization, we selected the mouse with the best titer and specificity based on the ic-ELISA results. The mouse received another immunization after 18–22 d of the fifth immunization. After three days, the spleen of the mouse was removed, and the splenocytes and myeloma cells were fused at 1:5 or 1:10. Based on cell selection, the cells were subcloned three times. After several screenings, the optimum cell line was expanded and injected into mice by intraperitoneal injection (Li, Hu, Huo, & Xu, Citation2007). Extracted ascites were purified by the ammonium caprylate sulfate method (Li, Liu, Song, & Kuang, Citation2017), and the concentration was determined using NanoDrop One (Thermo Fisher Scientific, Shanghai, China).
MAb characterization and production
Coating antigen (Cd-ITCBE-BSA 5) diluted with coating diluent was added to a 96-well plate (100 μL per well) and incubated at 37°C for 2 h. The plate was washed three times every 3 min and patted dry. Following the addition of 200 μL of blocking buffer per well, we incubated the plate for 2 h. Subsequently, the plate was washed and allowed to dry in the incubator for 45 min. We added 10 μM ITCBE, Cd standard (in 10 μM ITCBE), and 50 μL of diluted antibody to the 96-well plate according to standard procedures and incubated the plate for 35 min at 37°C. Following incubation, we washed and dried the plate. We added 100 μL of goat anti-mouse (HRP) diluted 3,000 times to the wells. Following a 30-min incubation at 37°C, we added 100 μL of chromogenic solution per well and incubated the plate at 37°C for 15 min. Finally, 50 μL stop solution per well was added, and the absorption value of each well was measured at 450 nm.
We determined the specificity of mAb by measuring cross-reactivity (CR) with other heavy metals including Hg(II), Pb(II), Cr(III), Cu(II), Fe(III), Al(III), As(II), and Ni(II). Each metal in its salt form was dissolved in 10 μM ITCBE, and detected after 10 min. CR was calculated using the following equation (Zou, Cui, Liu, Song, & Kuang, Citation2017).
Conjugation of fluorescent microspheres to mAb
We conjugated fluorescent microspheres to mAb 2F7 (Wang et al., Citation2019). First, 400 µL of 0.05 M BB (pH = 8.0) in a 2-mL tube was mixed for 1 min with 100 µL of fluorescent microspheres. To activate the carboxyl groups on the surface of the microspheres (Zhang, Xu, et al., Citation2019; Yang et al., Citation2015; Zhang et al., Citation2016), we added 30 µL of aqueous EDC (10 mg/mL) dropwise. The solution was mixed at 37°C for 20 min and centrifuged at 13,000 rpm for 10 min at 10°C. We discarded the supernatant and added 0.5 mL of 0.05 M BB (pH = 8.0) to the precipitate. We subjected the solution to ultrasound at 100 W for 1 min and added 100 µL of mAb (diluted to 0.5 mg/mL with 0.05M HEPES). We added 10× blocking solution and allowed the solution to stand for 3 h. The solution was mixed for 2 h and centrifuged at 2,000 rpm for 10 min at 10°C. The resulting pellet was mixed with 0.5 mL of 0.05 M BB. We added 0.5 mL of 0.05 M buffer to the pellet after centrifugation. Finally, we subjected the solution to ultrasound at 100 W for 1 min, and dispersed the suspension by sonication for 5 min. The suspension was stored at 4°C in the dark.
Assembly of the test strip components
The fluorescent immunoassay strip includes three components, an absorption pad, an NC membrane, and a sample pad (Majdinasab et al., Citation2015). First, the immunogen Cd-ITCBE-BSA 5 and goat anti-mouse mAb were coated on different positions of the NC membrane to generate the T and C lines, respectively. The test strip was assembled as previously reported and cut to the appropriate size (Zeng, Zhai, Xie, & Liu, Citation2018). The prepared test strips were sealed and stored in a dry environment at 37°C. Different coating immunogen concentrations (0.05 or 0.1 mg/mL) and buffers were evaluated.
Rice pretreatment
At present, the main pretreatment method for heavy metals is the digestion method. The digestion method has a high extraction rate but requires a longer processing time, so we established a simpler method. Cd-negative rice samples were purchased from China Oil Food Co. First, 2 g of ground rice was mixed for 3–5 min with 8 mL of 0.5 M HCl and 2 mL of 1 M HNO3. After centrifugation at 5,000 rpm for 5 min, the supernatant was collected, and pH was adjusted to 7–8 with 1 M NaOH. This method can be completed in 10 min.
Quantitative detection using the fluorescent immunoassay strip
The fluorescent immunoassay test strip is based on the reaction between Cd and the coated immunogen Cd-ITCBE-BSA 5 with the fluorescent microsphere-labeled mAb (Qiao et al., Citation2018). Briefly, following the addition of 2 mL of fluorescently labelled mAb and 100 mL of Cd-containing sample to a well of a microtiter plate, we mixed the solution thoroughly within 5 min. We inserted the assembled test strip into the microwell plate and let it stand for 15 min. In a Cd-negative sample, the fluorescently labelled mAb (FM-mAb) binds to the coating antigen Cd-ITCBE-BSA at the T line. The remaining unbound FM-mAb migrates upward along the NC membrane and binds to the goat anti-mouse secondary antibody where it reaches the C line (Le, Zhang, Wu, Shi, & Cao, Citation2018). In a Cd-positive sample, FM-mAb binds to Cd, and unreacted FM-mAb and conjugate migrate along the NC membrane. The coating antigen of the detection line captures excess FM-mAb only (Guo et al., Citation2015). Therefore, as the concentration of Cd in the sample increases, the colour of the T line becomes lighter until it disappears. The amount of FM-mAb captured on the T and C lines is different; therefore, the lines present colours of different strength. The values of the T and C lines at different Cd concentrations is determined with a strip reader (Xie, Wu, Shi, & Le, Citation2019). The detection performance of the fluorescent test strip is evaluated by establishing a standard curve. The assay can be completed within 30 min.
Results and discussion
Antigen characterization
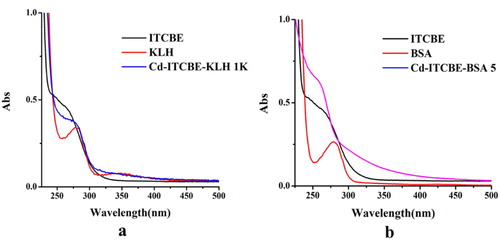
Cd-ITCBE-KLH 1 K and Cd-ITCBE-BSA 5 were characterized by ultraviolet (UV) spectroscopy and polyacrylamide gel electrophoresis. a shows that ITCBE had an absorption peak at 250–300 nm, and KLH had absorption peaks at 280 and 350 nm. b shows that BSA had an absorption peak at 280 nm. Cd-ITCBE-KLH 1 K had UV absorption in the range of 250–300 nm and 300–350 nm, and the peak of Cd-ITCBE-BSA 5 started to drift from 250 nm to 300 nm, indicating that ICTBE had successfully coupled to the protein.
Figure 2. The ultraviolet-visible absorption spectra of artificial antigen. (a) Cadmium-ITCBE-KLH; (b) Cadmium-ITCBE-BSA.
Sodium dodecyl sulfate-polyacrylamide gel electrophoresis (SDS-PAGE) allows the characterization of any changes in protein molecular weight. Sodium lauryl sulfate is an anionic detergent with a negative charge over a wide pH range, and the polypeptide chain can bind a certain number of SDS molecules proportional to its molecular weight. The negative charge of SDS denatures most of the higher-level structure of proteins, making the peptide negatively charged. Under a certain voltage, the migration speed of protein molecules towards the anode mainly depends on the size of the macromolecule (Shen, Wu, Liu, & Kuang, Citation2019). When a heavy metal and chelator are coupled to a carrier protein, the overall molecular weight changes. By comparing the changes in protein bands, the coupling of the antigen can be evaluated.
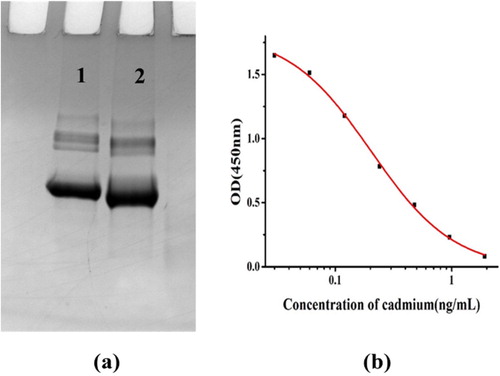
a shows that the Cd-ITCBE-BSA band was lagging behind the BSA band, indicating that the coating antigen was successfully synthesized. Considering that KLH and the conjugated immunogen have similar molecular weight, the electrophoretic characterization of the immunogen was not performed.
Figure 3. The characterization of antigen and antibody. (a) Polyacrylamide gel electrophoresis images of artificial antigen. 1: BSA; 2: Cd-ITCBE-BSA; (b) Standard curve obtained by indirect competitive ELISA based on antibody 2F7.
Characterization of mAb 2F7
MAb 2F7 with the best specificity and sensitivity was screened according to the method mentioned above. A standard curve depicting the nonlinear relationship between optical density (OD) and Cd concentration was obtained by ic-ELISA: y = −0.02 + 1.85/(1 + [x/0.0.20]1.21) with R2 = 0.999 (b). The IC50 and LOD values of mAb 2F7 were 0.2 and 0.03 ng/mL, respectively. The linear range of the antibody was 0.06–0.63 ng/mL.
The CR values of mAb 2F7 with Cd(II), Ni(II), Hg(II), Cr(III), Pb(II), Cu(II), As(II), Fe(III), and Al(III) are shown in . CR values of the antibody with Hg and Cr were 0.2%, and CR with other metals was 0.1%. Therefore, mAb 2F7 had a high specificity for Cd.
Table 1. Cross-reaction results of mAb 2F7.
Optimization of the fluorescent immunoassay strip
Several studies have reported that the resuspension buffer affects the speed at which the solution diffuses to the surface of the NC membrane. Therefore, we evaluated twelve resuspension buffers based on the colour development of fluorescent lines. Resuspension buffers consisted of six solutions (1 = PVP, 2 = PEG, 3 = BSA, 4 = Tween-20, 5 = Brij-30, and 6 = ON-870) and two buffers (a = PBS and b = PBS + 3% ON870). a shows that the optimal resuspension buffer consisted of BSA and PBS. Similar results have been previously reported (Z. Wang et al., Citation2020).
Figure 4. The optimization of the fluorescent immunochromatographic strip. (a) Optimize six kinds of resuspends: 1 = PVP, 2 = PEG, 3 = BSA, 4 = Tween-20, 5 = Brij-30, ad 6 = ON-870 and optimize by using two kinds of buffer (a = PBS and b = PBS + 3% ON870); (b) Optimize the coating concentration (0.05 or 0.1 mg/mL). C = 0.2 mg/mL. 0.7 uL. TM pad. Dilute 1:5 using resus 3. 1 = 0 ng/mL and 2 = 1000 ng/mL. using 10 µM ITCBE.
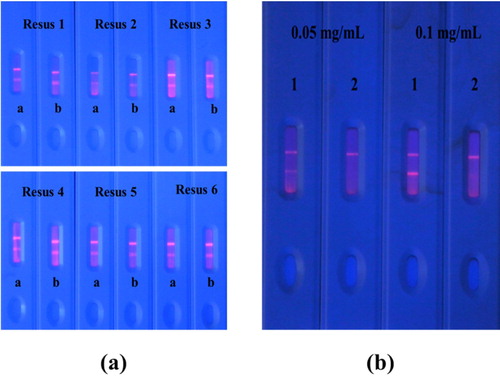
The fluorescent immunoassay strip is based on the specific binding of antigen to antibody. In this study, we optimized the concentration of coating antigen on the T-line. Blank samples spiked with 1,000 ng/mL Cd and diluted with 10 μM ITCBE were analyzed with the test strips coated with 0.5 or 1 mg/mL Cd-ITCBE-BSA 5. Compared to 0.5, 1 mg/mL Cd-ITCBE-BSA 5 generated a brighter and clearer band (b). Therefore, the coating concentration was set to 1 mg/mL.
Determination by fluorescent immunoassay strip
Under optimized conditions, we evaluated the performance of the test strip based on its cut-off and LOD values. Seven rice samples were spiked with different concentrations of Cd (0, 1, 2.5, 5, 10, 25, and 50 μg/kg) and analyzed with the test strip. The test results were obtained within 12 min (). As Cd concentration increased, the band colours became weaker. At 50 μg/kg Cd, the T-line disappeared; therefore, the cut-off value for Cd was 50 µg/kg in rice. At Cd > 50 μg/kg, the T line disappeared, and the sample was considered to be Cd positive. This is a visual observation that allows qualitative testing of the sample (Wang et al., Citation2011).
Figure 5. Performance of the test strip. (a) Typical photo image of cadmium detection by fluorescent test strip in rice samples. 1 = 0 µg/kg, 2 = 1 µg/kg, 3 = 2.5 µg/kg, 4 = 5 µg/kg, 5 = 10 µg/kg, 6 = 25 µg/kg, and 7 = 50 µg/kg; The cut-off value for cadmium was 50 µg/kg in rice sample. (b) Calibration curve obtained by a strip reader. The X-axis is shown as the concentrations of cadmium; and the Y-axis is shown as the T/C value.
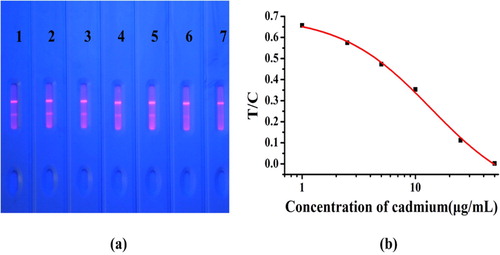
Quantitative detection was determined by the non-linear relationship between Cd concentration and T/C. For quantitative detection, we used a strip reader to determine the fluorescence intensity of the T and C lines at specific Cd concentrations. Figure 8 shows that the equation of the relationship between Cd concentration and T/C was y = −0.17 + 0.87/ (1 + [x/13.7]1.09) with R2 = 0.999. The LOD value of the test strip calculated from this equation was 1.93 μg/kg. The detection range of the test strip was 3.86–48.9 μg/kg. Therefore, when the Cd concentration in rice was in the range of 3.86–48.9 μg/kg, the T/C value could be determined by the strip reader. We used the equation above to determine the specific Cd concentration in the test sample.
When we tested an actual sample, we first used a test strip for qualitative analysis. When the test strip did not generate any colour, it meant that Cd concentration > 50 μg/kg and that the sample had to be diluted. Following dilution of the sample, we used the strip reader to determine the value of T/C and substituted it into the standard equation to determine the Cd concentration in the diluted sample. Finally, the Cd concentration in the original sample was determined after correcting for the dilution factor.
Recovery tests by ic-ELISA and fluorescent immunoassay strip
To determine the accuracy of the test strip detection, we analyzed the samples with known Cd concentration using ic-ELISA and the fluorescent immunoassay strip (Wang et al., Citation2020). Cd-negative rice samples were spiked with 5, 10, 20, and 40 μg/kg Cd and diluted. Each sample was tested five times. The amount of Cd in rice detected by the test strip was calculated by the calibration curve equation established above.
The test results are shown in . Recovery rate and CV were 87.6%–107.5% and 4.68%–8.68%, respectively, by ic-ELISA and 91.6%–104.35% and 3.91%–5.46%, respectively, by the fluorescent immunoassay strip. Therefore, the test strip and ic-ELISA had similar results, and the strip test results were closer to the actual addition amount. Our findings showed that the fluorescent immunoassay strip is reliable for the detection of Cd rice (Li et al., Citation2007). Therefore, the fluorescent immunoassay strip, which is inexpensive, fast, and does not require large instruments, can be used in the detection of Cd in rice, meeting the current demand for a large number of rapid detection of rice in the field (Arai et al., Citation2016).
Table 2. The recoveryof ic-ELISA and fluorescence immunoassay strip detection in rice samples(n = 5).
Conclusion
We used an immunogen synthesized by ITCBE and produced mAb 2F7 against Cd. We developed the first fluorescent immunoassay strip for the rapid detection of Cd in rice and optimized the coating immunogen and resuspension buffer. The cut-off value of the test strip for qualitative testing was 50 μg/kg. For quantitative detection, we used a strip reader and established a quantitative calibration curve for Cd. The LOD value of the quantitative detection of the test strip was 1.93 μg/kg with a quantitative range of 3.86–48.9 μg/kg. These values are far below the limit standards for most countries in the world. The recovery rates of Cd in rice were 91.6%–104.35%, which were correlated with the ic-ELISA detection results. Therefore, the fluorescent immunoassay strip developed in our study can be used in the detection of Cd in rice.
Disclosure statement
No potential conflict of interest was reported by the author(s).
Additional information
Funding
References
- Arai, H., Nakamura, K., Yoshida, Y., & Tawarada, K. (2016). Development of quantitative immunochromatographic kit and visual screening immunoassay strip for cadmium. Analytical and Bioanalytical Chemistry, 408(22), 6063–6068. doi: 10.1007/s00216-016-9475-2
- Bai, Y., Hu, J., Liu, S., Zhang, W., Zhang, J., He, J., … Wang, Z. (2017). Production of antibodies and development of an enzyme-linked immunosorbent assay for 17β-estradiol in milk. Food and Agricultural Immunology, 28(6), 1519–1529. doi: 10.1080/09540105.2017.1350833
- Choi, S. H., Kim, J. Y., Mi Choi, E., Lee, M. Y., Yang, J. Y., Ho Lee, G., … Su Park, K. (2018). Heavy metal determination by inductively coupled plasma – mass spectrometry (ICP-MS) and direct mercury analysis (DMA) and arsenic mapping by femtosecond (fs) – laser ablation (LA) ICP-MS in Cereals. Analytical Letters, 52(3), 496–510. doi: 10.1080/00032719.2018.1471484
- Guan, D., Guo, L., Liu, L., Kong, N., Kuang, H., & Xu, C. (2015). Development of an ELISA for nitrazepam based on a monoclonal antibody. Food and Agricultural Immunology, 26(5), 611–621. doi: 10.1080/09540105.2014.998637
- Guo, L., Song, S., Liu, L., Peng, J., Kuang, H., & Xu, C. (2015). Comparsion of an immunochromatographic strip with ELISA for simultaneous detection of thiamphenicol, florfenicol and chloramphenicol in food samples. Biomedical Chromatography, 29(9), 1432–1439. doi: 10.1002/bmc.3442
- Jiang, J., Li, Z., Wang, Y., Zhang, X., Yu, K., Zhang, H., … Li, N. (2020). Rapid determination of cadmium in rice by portable dielectric barrier discharge-atomic emission spectrometer. Food Chemistry, 310, 125824. doi: 10.1016/j.foodchem.2019.125824
- Jin, X., He, R., Ju, X., Zhang, J., Wang, M., Xing, C., & Yuan, J. (2019). Development and optimization of an immunoassay for the detection of Hg(II) in lake water. Food Science & Nutrition, 7(5), 1615–1622. doi: 10.1002/fsn3.991
- Khafaga, A. F., Abd El-Hack, M. E., Taha, A. E., Elnesr, S. S., & Alagawany, M. (2019). The potential modulatory role of herbal additives against Cd toxicity in human, animal, and poultry: A review. Environmental Science and Pollution Research, 26(5), 4588–4604. doi: 10.1007/s11356-018-4037-0
- Kim, J. J., Kim, Y. S., & Kumar, V. (2019). Heavy metal toxicity: An update of chelating therapeutic strategies. Journal of Trace Elements in Medicine and Biology, 54, 226–231. doi: 10.1016/j.jtemb.2019.05.003
- Le, T., Zhang, Z., Wu, J., Shi, H., & Cao, X. (2018). A fluorescent immunochromatographic strip test using a quantum dot-antibody probe for rapid and quantitative detection of 1-aminohydantoin in edible animal tissues. Analytical and Bioanalytical Chemistry, 410(2), 565–572. doi: 10.1007/s00216-017-0756-1
- Li, F., Wang, J., Xu, L., Wang, S., Zhou, M., Yin, J., & Lu, A. (2018). Rapid Screening of cadmium in rice and identification of geographical origins by spectral method. International Journal of Environmental Research and Public Health, 15, 2.
- Li, X., Hu, Y., Huo, T., & Xu, C. (2007). Comparison of the determination of chloramphenicol residues in aquaculture tissues by time-resolved fluoroimmunoassay and with liquid chromatography and tandem mass spectrometry. Food and Agricultural Immunology, 17(3-4), 191–199. doi: 10.1080/09540100601090349
- Li, Y., Liu, L., Song, S., & Kuang, H. (2017). Development of a gold nanoparticle immunochromatographic assay for the on-site analysis of 6-benzylaminopurine residues in bean sprouts. Food and Agricultural Immunology, 29(1), 14–26. doi: 10.1080/09540105.2017.1354359
- Liu, G., Wang, J., Li, Z., Liang, S., Liu, J., & Wang, X. (2009). Development of direct competitive enzyme-linked immunosorbent assay for the determination cadmium residue in farm produce. Applied Biochemistry and Biotechnology, 159(3), 708–717. doi: 10.1007/s12010-009-8539-6
- Liu, Y., Xiao, T., Perkins, R. B., Zhu, J., Zhu, Z., Xiong, Y., & Ning, Z. (2017). Geogenic cadmium pollution and potential health risks, with emphasis on black shale. Journal of Geochemical Exploration, 176, 42–49. doi: 10.1016/j.gexplo.2016.04.004
- Majdinasab, M., Sheikh-Zeinoddin, M., Soleimanian-Zad, S., Li, P., Zhang, Q., Li, X., … Li, J. (2015). A reliable and sensitive time-resolved fluorescent immunochromatographic assay (TRFICA) for ochratoxin A in agro-products. Food Control, 47, 126–134. doi: 10.1016/j.foodcont.2014.06.044
- Moallem Bandani, H., Ali Malayeri, F., Donya, A., Majid, R., Entezari Heravi, R., Laleh, R., & Saeedeh, S. (2016). Determination of lead and cadmium in cow′s milk and elimination by using titanium dioxide nanoparticles. Nutrition and Food Sciences Research, 3(4), 57–62. doi: 10.18869/acadpub.nfsr.3.4.57
- Qiao, B., Li, Y., Hu, P., Sun, Y., Si, Z., Lu, S., … Zhou, Y. (2018). EuNPs-MAb fluorescent probe based immunochromatographic strip for rapid and sensitive detection of fluorene. Sensors and Actuators B: Chemical, 262, 221–227. doi: 10.1016/j.snb.2018.01.231
- Rafati Rahimzadeh, M., Rafati Rahimzadeh, M., Kazemi, S., & Moghadamnia, A. A. (2017). Cadmium toxicity and treatment: An update. Caspian Journal Of internal Medicine, 8(3), 135–145.
- Remelli, M., Nurchi, V. M., Lachowicz, J. I., Medici, S., Zoroddu, M. A., & Peana, M. (2016). Competition between Cd(II) and other divalent transition metal ions during complex formation with amino acids, peptides, and chelating agents. Coordination Chemistry Reviews, 327-328, 55–69. doi: 10.1016/j.ccr.2016.07.004
- Shen, X., Wu, X., Liu, L., & Kuang, H. (2019). Development of a colloidal gold immunoassay for the detection of four eugenol compounds in water. Food and Agricultural Immunology, 30(1), 1318–1331. doi: 10.1080/09540105.2019.1687658
- Song, S., Zou, S., Zhu, J., Liu, L., & Kuang, H. (2017). Immunochromatographic paper sensor for ultrasensitive colorimetric detection of cadmium. Food and Agricultural Immunology, 29(1), 3–13. doi: 10.1080/09540105.2017.1354358
- Wang, H., Guan, J., Liu, X., Shi, Y., Wu, Q., Luo, M., … Pan, Y. (2019). Rapid detection of avian leukosis virus using a fluorescent microsphere immunochromatographic test strip assay. Poultry Science, 98(12), 6492–6496. doi: 10.3382/ps/pez547
- Wang, L., Chen, W., Ma, W., Liu, L., Ma, W., Zhao, Y., … Xu, C. (2011). Fluorescent strip sensor for rapid determination of toxins. Chem Commun (Camb), 47(5), 1574–1576. doi: 10.1039/C0CC04032K
- Wang, Z., Wu, X., Liu, L., Xu, L., Kuang, H., & Xu, C. (2020). Rapid and sensitive detection of diclazuril in chicken samples using a gold nanoparticle-based lateral-flow strip. Food Chemistry, 312, 126116. doi: 10.1016/j.foodchem.2019.126116
- Xie, Y., Wu, J., Shi, H., & Le, T. (2019). A fluorescent immunochromatographic strip using quantum dots for 3-amino-5-methylmorpholino-2-oxazolidinone (AMOZ) detection in edible animal tissues. Food and Agricultural Immunology, 30(1), 208–221. doi: 10.1080/09540105.2019.1566301
- Xing, C., Hao, C., Liu, L., Xu, C., & Kuang, H. (2013). A highly sensitive enzyme-linked immunosorbent assay for copper(II) determination in drinking water. Food and Agricultural Immunology, 25(3), 432–442. doi: 10.1080/09540105.2013.821600
- Xu, L., Xing, C., Liu, L., Song, S., Kuang, H., & Xu, C. (2016). Quick, easy, cheap, effective, rugged and safe strategy for quantifying cadmium polluted rice. Food and Agricultural Immunology, 27(6), 783–795. doi: 10.1080/09540105.2016.1160368
- Yang, Y., Li, C., Wang, W., Dong, T., Xiong, Y., Shen, J., & Lai, W. (2015). A fluorescence immunochromatographic assay for rapid and sensitive detection of human prealbumin in serum. Analytical Methods, 7(20), 8683–8688. doi: 10.1039/C5AY01659B
- Zeng, H., Zhai, X., Xie, M., & Liu, Q. (2018). Fluorescein Isothiocyanate labeling antigen-based immunoassay strip for rapid detection of Acidovorax citrulli. Plant Disease, 102(3), 527–532. doi: 10.1094/PDIS-06-17-0903-RE
- Zhang, G. G., Xu, S. L., Xiong, Y. H., Duan, H., Chen, W. Y., Li, X. M., … Lai, W. H. (2019). Ultrabright fluorescent microsphere and its novel application for improving the sensitivity of immunochromatographic assay. Biosensors and Bioelectronics, 135, 173–180. doi: 10.1016/j.bios.2019.04.023
- Zhang, K., Wang, G., Bao, M., Wang, L., & Xie, X. (2019). Exogenous application of ascorbic acid mitigates cadmium toxicity and uptake in Maize (Zea mays L.). Environmental Science and Pollution Research, 26(19), 19261–19271. doi: 10.1007/s11356-019-05265-0
- Zhang, X., Wen, K., Wang, Z., Jiang, H., Beier, R. C., & Shen, J. (2016). An ultra-sensitive monoclonal antibody-based fluorescent microsphere immunochromatographic test strip assay for detecting aflatoxin M 1 in milk. Food Control, 60, 588–595. doi: 10.1016/j.foodcont.2015.08.040
- Zhu, J., Hong, K., Shen, X., Gan, Y., Tian, F., Zhao, J., … Chen, W. (2020). A new method for evaluating the bioaccessibility of different foodborne forms of cadmium. Toxicology Letters, 319, 31–39. doi: 10.1016/j.toxlet.2019.11.002
- Zou, S., Cui, G., Liu, L., Song, S., & Kuang, H. (2017). Development of ic-ELISA and an immunochromatographic strip assay for the detection of methylmercury. Food and Agricultural Immunology, 28(4), 699–710. doi: 10.1080/09540105.2017.1309643
- Zuo, Q., Chen, Y., Chen, Z. P., & Yu, R. Q. (2018). Quantification of cadmium in rice by surface-enhanced Raman spectroscopy based on a ratiometric indicator and conical holed enhancing substrates. Analytical Sciences, 34(12), 1405–1410. doi: 10.2116/analsci.18P342