
ABSTRACT
Polysaccharides have various bioactivities including anti-tumour, antioxidant and immunoregulation, which are correlated with their structural characteristics. Here, four polysaccharides from Glycyrrhiza uralensis (GUPS), Pleurotus ferulae (PFPS), Triticum aestivum (TAPS) and Oryza sativa (OSPS) were purified to compare their structural characteristics and immunoregulatory activities. The data showed that TAPS, OSPS, GUPS and PFPS contained different monosaccharide components and had distinctly structural characteristics. All the four polysaccharides promoted the maturation of dendritic cells (DCs) through TLR4 with different activities. GUPS and PFPS also reduced the phagocytosis of DCs but not for TAPS and OSPS. Importantly, GUPS and PFPS enhanced the Th1 skewing immune response in mice without inflammation. TAPS and OSPS only showed weak immunostimulatory activity in vivo. The immunostimulatory activities of the four polysaccharides were ranked as PFPS = GUPS > TAPS > OSPS.
1. Introduction
Polysaccharides widely distributed in organisms including plants, animals and fungi, and are the major and essential biomacromolecules besides proteins and nucleic acids. Recently, accumulating evidence indicates that polysaccharides have variety of biological activities, such as anti-tumour, antioxidant, antidiabetics, immunoregulation and anti-inflammatory without toxicity (He et al., Citation2020; Navegantesa et al., Citation2013; P. C. Wang et al., Citation2016; Xu, Gao, et al., Citation2018; Yu et al., Citation2018; Zhao et al., Citation2017). The immune system is composed of immune organs including thymus and spleen and immune cells like dendritic cells (DCs), macrophages, T cells and B cells. DCs and macrophages can take up antigen and display it to T cells after processing, and then generate antigen-specific immune responses. An increasing number of studies suggest that polysaccharides not only increase spleen index and thymus index but also promote the activation of DCs, macrophages and natural killer (NK) cells and the proliferation of lymphocytes (Bo et al., Citation2019; Q. Chen et al., Citation2018; Ferreira et al., Citation2015; L. Sun et al., Citation2010; Yang et al., Citation2019). Therefore, the immunostimulatory activities of natural polysaccharides have been received increasing attention, especially in the field of cancer therapy and vaccine development.
The biological activity of polysaccharides is correlated with their monosaccharide composition, glycoside bond, molecular size, branching degree, molecular conformation and functional group, etc. (Surayot & You, Citation2017; M. Wang et al., Citation2017). Chemical characterization of the polysaccharides is often insufficient and the structural complexity hampers the establishment of broad structure–function relationships and source-function relationships. In order to promote the establishment of structure–function relationships, polysaccharides from Glycyrrhiza uralensis, Pleurotus ferulae, Triticum aestivum and Oryza sativa were isolated and their structure and immunostimulatory activity were compared. G. uralensis is a traditional Chinese medicine and has various biological functions, such as antioxidant, antivirus, anti-tumour anti-inflammatory and immunoregulation (Asl & Hosseinzadeh, Citation2008; Tang et al., Citation2015). Several studies including ours have reported that G. uralensis polysaccharides (GUPS) enhanced the activation of macrophages, DCs and NK cells, and increased the proportion of CD4+/CD8+ T cells (Aipire et al., Citation2017; J. Chen et al., Citation2016; Wu et al., Citation2017). GUPS mainly consisted of glucose, galactose and arabinose and contained α- and β-glycosidic linkages with 29.1 kDa molecular weight and a smooth surface (Aipire, Yuan, et al., Citation2020). P. ferulae is an edible mushroom with various pharmacological properties including antioxidant, anti-tumour and immunoregulation (Alam et al., Citation2012; J. Li et al., Citation2015; Yang et al., Citation2018). We previously isolated polysaccharides from P. ferulae (PFPS) and found that PFPS enhanced the maturation and function of DCs through toll-like receptor 4 (TLR4) signalling pathway, and as adjuvant increased the anti-tumour efficacy of DC-based vaccine (J. Li et al., Citation2016, Citation2019). PFPS mainly consisted of glucose and contained α- and β-glycosidic linkages with 1600 kDa molecular weight (J. Li et al., Citation2017). Triticum aestivum and Oryza sativa are the staple food worldwide. It has been reported that the sugars of wheat bran extracts are rhamnose, galactose, glucose, galacturonic acid and glucuronic acid, and the major components of the non-starch polysaccharide fraction of wheat flour are arabinoxylan and β-glucan (Harris et al., Citation2019; Kaur et al., Citation2019). Recently, a study reported that the water-soluble non-starch polysaccharide from red yeast rice was composed of mannose, glucosamine, glucose and galactose with a molar ratio of 0.152:0.015:1:0.149 (Luo et al., Citation2019). Here, T. aestivum polysaccharides (TAPS) and O. sativa polysaccharides (OSPS) were also isolated and their structural characteristics and immunoregulatory activities were investigated and compared with GUPS and PFPS. The results showed that the major monosaccharides in TAPS were glucose and glucuronic acid with 98 kDa molecular weight, and arabinose and xylose in OSPS with 309.9 kDa molecular weight. Fourier transform infrared spectroscopy indicated that the major glycosidic bonds and functional groups were similar in the four polysaccharides except N-H in OSPS. Nuclear magnetic resonance spectroscopy displayed that all of them contained α- and β-glycosidic configuration. GUPS and PFPS contained α-L-Ara but not in TAPS and OSPS.
2. Materials and methods
2.1. Reagents and animals
RPMI-1640 medium and phosphate-buffered solution (PBS) were bought from Gibco (Gaithersburg, MD, USA). Lipopolysaccharides (LPS) and FITC-Dextran (42,000 Da) were purchased from Sigma-Aldrich (St. Louis, MO, USA). ELISA kits for murine tumour necrosis factor-α (TNF-α) and interleukin (IL)-12p40 and the antibodies for flow cytometry including anti-CD40-APC, anti-CD86-PE, anti-CD11c-FITC, anti-CD3-APC and anti-CD4-APC were purchased from Elabscience (Wuhan, China). Anti-MHC-I-FITC, anti-CD80-PE, anti-IL-12-APC, anti-IL-10-FITC, anti-CD11b-PE, anti-CD19-PE, anti-CD49b-FITC, anti-CD8-PE, anti-CD44-PE, Golgi stop (monensin) and Cytofix/Cytoperm were obtained from BD Biosciences (San Diego, CA, USA). Granulocyte-macrophage colony-stimulating factor (GM-CSF) and TAK-242 were purchased from PeproTech (Rocky Hill, NJ, USA) and Medchemexpress (NJ, USA), respectively.
ICR mice (6–8 weeks) were bought from Animal Laboratory Center, Xinjiang Medical University (Urumqi, Xinjiang, China) and housed in a temperature-controlled, light-cycled animal facility of Xinjiang University. The animal experiment (BRGE-AE001-075) was approved by the Committee on the Ethics of Animal Experiments of Xinjiang Key Laboratory of Biological Resources and Genetic Engineering (BRGE-AE001) and carried out under the guidelines of the Animal Care and Use Committee of College of Life Science and Technology, Xinjiang University.
2.2. Polysaccharide preparation
Hundred grams of Triticum aestivum and Oryza sativa powder were extracted by 500 mL of petroleum ether twice at 60°C for 1 h, followed by extracting with 500 mL of 80% ethanol twice at 60°C for 1 h. The residues were resuspended with 800 mL of distilled water and treated with ultrasonication for 20 min, then extracted two times at 60°C for 2 h. The supernatant was collected and concentrated using a rotary vacuum evaporator at 40°C. The concentrated solutions were precipitated twice with 4 volumes of ethanol at 4°C for 24 h. After centrifugation at 8000 rpm for 15 min, the crude polysaccharides of T. aestivum and O. sativa were obtained. T. aestivum and O. sativa polysaccharides (TAPS and OSPS) were purified with DEAE-52 cellulose column (2.6 × 66 cm; Solarbio Life Sciences, Beijing, China) eluted with deionized water, 0.05, 0.1, 0.2 and 0.5 M NaCl solutions. The fractions eluted with water and 0.2 M NaCl were collected and the total carbohydrates were determined by phenol-sulfuric acid methods with galactose as the standard (DuBois et al., Citation1956). Protein content was analyzed using a BCA protein assay kit with bovine serum albumin (BSA) as the standard.
2.3. Determination of monosaccharide composition
The monosaccharide composition was determined by HPLC according to our previous report with some modification (J. Li et al., Citation2017). Briefly, TAPS and OSPS were hydrolysed with 4 M trifluoroacetic acid at 120°C for 2 h, and the fractions were incubated with 1-phenyl-3-methyl-5-pyrazolone (PMP, ALADDIN, Shanghai) at 70°C for 60 min. After drying on a rotatory evaporator, the residues were extracted with 0.5 mL of 0.3 mol/L HCl and 0.5 mL chloroform and analysed on an Agilent 1200 Infinity HPLC instrument using a SHISEIDO C18 column (4.6 mm × 250 mm, 5 μm, SHISEIDO, Japan) at 25°C with a flow rate of 1 mL/min, which was monitored at 245 nm. Mobile phases A and B (v/v, 82:18) were consisted of 0.1 M KH2PO4 (pH6.8) and acetonitrile.
2.4. Scanning electron microscopy (SEM) analysis
For the morphologies of polysaccharides, the samples were coated with a thin gold layer and observed by scanning electronic microscope (SU8010, Hitachi, Tokyo, Japan).
2.5. UV spectrum, Fourier transform infrared (FT-IR) spectroscopy and nuclear magnetic resonance (NMR) spectroscopy
For UV spectrum, 1 mg/mL of polysaccharide solutions were scanned from 200 to 400 nm with an UV spectrophotometer (UV-3600).
For FT-IR spectroscopy, 5 mg of polysaccharides was mixed with 400 mg of KBr to make a tablet and recorded on an FT-IR spectrometer (BRUKER, VERTEX 70) from 4000 to 400 cm−1 with 64 scans at 4 cm−1 resolution in the OPUS 6.5 software.
For NMR analysis, 20 mg of polysaccharides were dissolved in 1 mL DMSO and 1H-NMR spectra of TAPS and OSPS were performed on a Bruker AVANCE III 600 spectrometer at 30°C.
2.6. DC induction and treatment
DCs were generated from bone marrow cells of mice in the presence of GM-CSF according to our previous description (J. Li et al., Citation2015). On day 7, DCs were collected and treated with different concentrations of polysaccharides for 12 h. LPS (20 ng/mL) was used as positive control. For TLR4 inhibitor experiments, DCs were pretreated with 1 μM TAK-242 for 1 h, and then treated with polysaccharides or LPS.
2.7. Endocytosis assay
To analyse the endocytosis of DCs, 1 × 10⁶ DCs treated with polysaccharides were incubated with 50 μg/mL FITC-dextran at 37°C for 1 h. After washing twice with cold PBS, DCs were stained with anti-CD11c-PE and analyzed by flow cytometry.
2.8. Flow cytometry
Phenotypic maturation of DCs was analysed by flow cytometry. After treatment, cellular surface staining was performed using different combinations of anti-CD40, anti-CD80, anti-CD86 or anti-MHC-I antibodies. For the detection of cytokine production, DCs were treated with polysaccharides or LPS in the presence of Golgi stop for 12 h. Cells were collected and stained with anti-CD11c-FITC. After washing with PBS, cells were fixed and permeabilized with the Cytofix/Cytoperm kit according to the manufacturer instructions. Intracellular staining was performed using anti-IL-12-APC and anti-IL-10-FITC. For analysis of the proportions of immune cells in spleen of mice, splenocytes were stained with different combinations of anti-CD3-APC, anti-CD4-APC, anti-CD11b-PE, anti-CD19-PE, anti-CD49b-FITC, anti-CD8-PE or anti-CD44-PE antibodies. Samples were collected using a FACSCalibur flow cytometer (BD Biosciences) and analysed using FlowJo platform (Tree Star, Inc., Ashland, OR).
2.9. Animal experiment
ICR mice were randomly divided into 6 groups (5 mice/group). Mice were intraperitoneally injected with LPS (50 μg/kg), GUPS (25 mg/kg), PFPS (25 mg/kg), TAPS (30 mg/kg), and OSPS (30 mg/kg) on days 0, 2, 4 and 6, respectively. Mice injected with PBS were used as control. Serums were collected on days 1 and 3. On day 7, all mice were sacrificed by cervical dislocation and organs were collected and weighted. Splenocytes were used to detect the proportions of immune cells by flow cytometry.
2.10. ELISA assay
The levels of TNF-α and IL-12p40 in the supernatants of DC culture and the serum samples were determined by ELISA kits according to the manufacturer’s instructions.
2.11. Statistical analysis
The data were expressed as mean ± SD. Statistical analysis was carried out by one-way analysis of variance (ANOVA) or a paired t-test using prism5.0 software. P < 0.05 was considered statistically significant.
3. Results and discussion
3.1. Purification and immunoregulatory activity of TAPS and OSPS
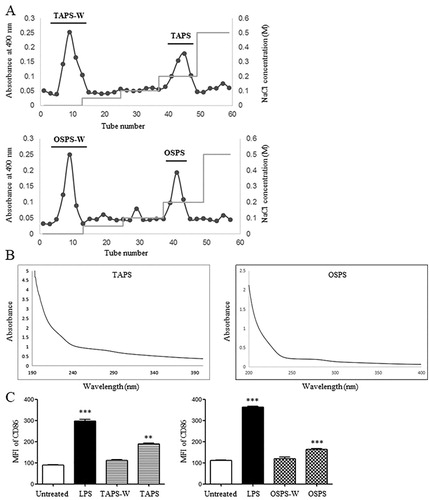
Crude polysaccharides of T. aestivum and O. sativa were obtained through water extract and ethanol precipitation, then separated by DEAE-52 cellulose column eluted by different concentrations of NaCl solutions. Two major fractions were observed after elution with water and 0.2 M NaCl and collected, which were named as TAPS-W, TAPS, OSPS-W and OSPS, respectively ((A)). The total carbohydrate contents of TAPS-W, TAPS, OSPS-W and OSPS were 45%, 79%, 45% and 81%, respectively. Protein contents of TAPS-W, TAPS, OSPS-W and OSPS were 0%, 1.19%, 0.16% and 1.26%, respectively. TAPS and OSPS were further scanned with UV spectrophotometer. As shown in (B), a strong peak at 190–210 nm represented polysaccharides. A weak peak at 280 nm also revealed that TAPS and OSPS contained protein. The monosaccharide constituents of TAPS and OSPS were analysed by HPLC. TAPS was mainly consisted of mannose (Man), ribose (Rib), rhamnose (Rha), galacturonic acid (GalA), galactose (Gal), glucuronic acid (GlcA), glucose (Glc), xylose (Xyl), arabinose (Ara), and fucose (Fuc) with relative molar ratios of 3.3:1.0:1.9:10.3:3.6:26.8:332.2:18.4:22.6:3.7. OSPS was mainly composed of Rib, GalA, Gal, GlcA, Glc, Xyl, Ara, and Fuc with relative molar ratios of 1.0:1.8:7.0:4.1:2.2:8.2:22.0:2.4. The results showed that Glc and GlcA were the major components of TAPS, whereas Ara and Xyl were the major components of OSPS. In our previous studies (Aipire, Yuan, et al., Citation2020; J. Li et al., Citation2017), GUPS mainly contained Ara, Glc and Gla, and PFPS mainly contained Glc (97%). The effects of TAPS-W, TAPS, OSPS-W and OSPS on the maturation of DCs were compared. DCs were treated with 20 μg/mL of TAPS-W, TAPS, OSPS-W or OSPS for 12 h. We observed that TAPS and OSPS induced higher level of CD86 expression on DCs than TAPS-W and OSPS-W, respectively ((C)), indicating that the immunostimulatory activity of TAPS and OSPS was higher than that of TAPS-W and OSPS-W, respectively. This is consistent with our previous studies (Aipire, Yuan, et al., Citation2020; J. Li et al., Citation2017).
Figure 1. Purification of TAPS and OSPS and determination of their purity and activity. (A) Crude polysaccharides of T. aestivum and O. sativa were isolated by using a DEAE-52 cellulose column eluted with different concentrations of NaCl. (B) UV spectra of TAPS and OSPS. (C) The expression of CD86 on DCs induced by TAPS-W, TAPS, OSPS-W and OSPS. Bone marrow-derived DCs were treated with 20 μg/mL of TAPS-W, TAPS, OSPS-W and OSPS. After 12 h, the expression of CD86 on DCs was detected by flow cytometry. Data are from 3 independent experiments and analysed by ANOVA. ** p < 0.01; *** p < 0.001 compared to untreated DCs.
3.2. Comparison of structural features of polysaccharides from T. aestivum, O. sativa, G. uralensis and P. ferulae
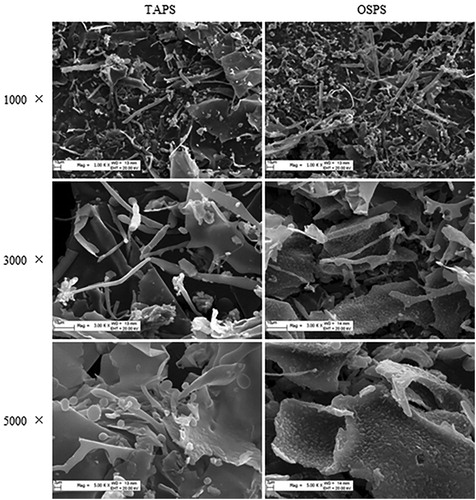
Due to the high carbohydrate content and activity, TAPS and OSPS were selected to analyse their structures and compared with GUPS and PFPS. High-performance gel permeation chromatography (HPGPC) was used to detect the molecular weight of TAPS and OSPS, and their molecular weights were 98 and 309.9 kDa, respectively. The morphologies properties of TAPS and OSPS were determined by SEM and the images at 1000-fold, 3000-fold and 5000-fold magnification were shown in . Both TAPS and OSPS showed amorphous morphologies including lamellar and tubular, which might be caused by dehydration during lyophilization (Ma et al., Citation2018; Shu et al., Citation2018). GUPS also contained lamellar and tubular morphologies (Aipire, Yuan, et al., Citation2020). The surface of TAPS is smooth, which is similar with GUPS (Aipire, Yuan, et al., Citation2020), whereas OSPS shows rough surface.
Figure 2. Scanning electron micrographs of TAPS (left) and OSPS (right) with different magnifications including 1000×, 3000× and 5000×.
FT-IR spectroscopy and NMR were used to analyse the structures of TAPS and OSPS. As shown in (A), The FT-IR spectra of TAPS and OSPS displayed a broad peak at 3366 and 3419 cm−1, respectively, which was attributed to the stretching vibration of O-H (W. Liu et al., Citation2016; H. Zhang, Chen, et al., Citation2018). The peaks at 2930 and 1411 cm−1 were due to the C–H stretching vibration and variable angle vibration respectively (John et al., Citation2018; Molaei & Jahanbin, Citation2018; Xu, Gao et al. Citation2018). The peaks at 1651 cm−1 in TAPS spectrum and 1659 cm−1 in OSPS spectrum were the characteristic of bound water (W. Liu et al., Citation2016; Molaei & Jahanbin, Citation2018). Three peaks at 1000–1200 cm−1 range were observed in both TAPS and OSPS spectra, which indicated the presence of C–O–H side groups and C–O–C glycosidic band vibration (Z.-B. Wang, et al., Citation2014). All the above peaks were also found in GUPS and PFPS spectra (Aipire, Yuan, et al., Citation2020; J. Li et al., Citation2017). The absorption peak at 1080 cm−1 indicated the presence of a β-glucosidic linkage. In addition, the peaks at 934, 927 and 930 cm−1 were observed in TAPS, GUPS and PFPS spectra respectively, which indicated the β-configuration of the sugar units (Z. Wang, et al., Citation2014; Z.-B. Wang, et al., Citation2014). However, this peak was not found in OSPS spectrum. The bands at 1544 cm−1 was observed in OSPS spectrum but not in TAPS, GUPS and PFPS spectra, which assigned to N-H (Xu, Niu, et al., Citation2018).
Figure 3. (A) FT-IR spectra of TAPS and OSPS in the range of 4000–400 cm−1. (B) 1H-NMR spectra of TAPS and OSPS.
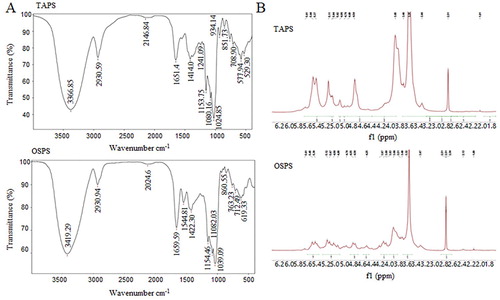
The 1H-NMR spectra showed that chemical shifts of polysaccharide fractions were mainly in the region from 3.3–5.4 ppm (Cai et al., Citation2018; Xu, Niu, et al., Citation2018; Y. Wang et al., Citation2018), and the majority of the chemical shifts for anomeric protons appeared within 4.7–5.5 ppm (Mzoughi et al., Citation2018). Signals in the regions of 5.50–4.90 ppm and 4.90–4.70 ppm were attributed to anomeric protons of α-anomers and β-anomers, respectively. As shown in (B), the 1H-NMR spectra of TAPS and OSPS were similarly, and both of them contained the α- and β-glycosidic configuration. According to the previous reports (Cao et al., Citation2018; H. Li et al., Citation2018; Q. Li et al., Citation2018; Q. Zhang et al., Citation2018), the eight signals at 5.61/5.61, 5.44/5.45, 5.37/5.39, 5.11/5.12, 5.04/5.07, 5.02/4.98, 4.86/4.89 and 4.76/4.76 ppm in TAPS and OSPS were represented the anomeric proton resonances of α-D-Manp, α-D-Glcp, α-D-Galp, α-D-Manp, α-D-Glcp, α-D-Glcp, β-L-Rhap and β-D-Xylp, respectively. PFPS and GUPS also contained α- and β-glycosidic configuration (Aipire, Yuan, et al., Citation2020; J. Li et al., Citation2017). Meanwhile, the chemical shifts at 5.27, 5,21 and 5.17 ppm in GUPS and 5.22 ppm in PFPS were observed, which indicated that GUPS and PFPS contained α-L-Ara, but TAPS and OSPS had no these signals.
3.3. The immunoregulatory effects of these four polysaccharides on the maturation of DCs
Firstly, different doses of TAPS and OSPS were used to treat DCs. After 12 h, both TAPS and OSPS significantly upregulated the expression of CD40. 10 μg/mL of TAPS also increased CD80 expression but not for OSPS (). 20 μg/mL of polysaccharides were selected to compare the activity of TAPS, OSPS, GUPS and PFPS. The results showed that TAPS and OSPS significantly upregulated the expression of CD40 and CD86 but did not increase the expression of MHC-I and CD80, whereas GUPS and PFPS significantly increased the expression of all these molecules ((A)). This is consistent with our previous studies (Aipire, Yuan, et al., Citation2020; J. Li et al., Citation2017). All the four polysaccharides significantly enhanced the secretion of IL-12p40 and TNF-α, while the levels of cytokines induced by GUPS and PFPS were higher than that of TAPS and OSPS ((B)). The immunostimulatory activities of polysaccharides are associated with their conformation, molecular weight, functional groups and branching degree (Ferreira et al., Citation2015). It has been reported that low molecular weight fractions of carrageen have higher immunostimulating ability (Stephanie et al., Citation2010; Zhou et al., Citation2004). Compared to TAPS and OSPS, the higher immunostimulating activity of GUPS might be associated with its lower molecular weight. However, the activity of PFPS might be correlated with its triple-helix conformation (J. Li et al., Citation2017), which conferred higher immunostimulating activity (Falch et al., Citation2000).
Figure 4. TAPS-C and OSPS-C promoted DC maturation. DCs were treated with different concentrations (10, 20 and 50 μg/mL) of TAPS and OSPS for 12 h. After treatment, the expression of CD40 and CD80 on DCs was detected by flow cytometry (upper panels). The mean fluorescence intensity (MFI) (mean ± SEM) of CD40 and CD80 were shown in lower panels. Data are from 3 independent experiments and analysed by ANOVA. * p < 0.05; ** p < 0.01; *** p < 0.001 compared to untreated DCs.
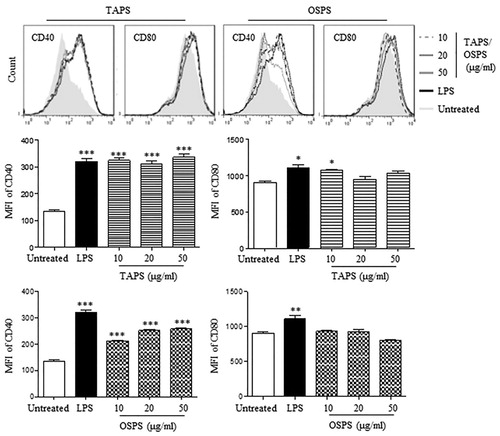
Figure 5. The activities of GUPS, PFPS, TAPS and OSPS on DC maturation and cytokine production. (A) DCs were treated with 20 μg/mL of GUPS, PFPS, TAPS and OSPS. After 12 h, the expression of MHC-I, CD40, CD80 and CD86 on DCs was detected by flow cytometry. (B) The supernatants were collected and the secretion of IL-12p40 and TNF-α was measured by ELISA. (C) DCs treated with polysaccharides were incubated with 50 μg/mL FITC-dextran at 37°C for 1 h. After staining with anti-CD11c-PE, samples were analysed by flow cytometry. Data are from 3 independent experiments and analysed by ANOVA. * p < 0.05; ** p < 0.01; *** p < 0.001 compared to untreated DCs.
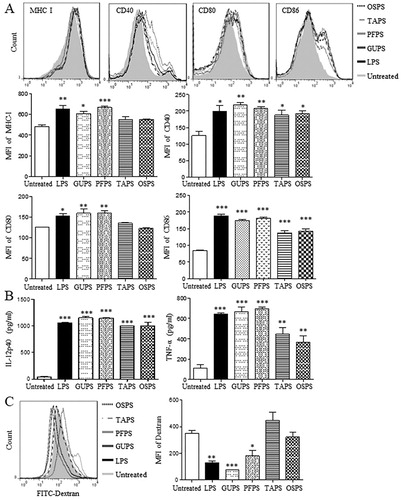
With the maturation of DCs, the capability of phagocytosis was decreased. DCs treated with TAPS, OSPS, GUPS and PFPS were incubated with FITC-dextran for 1 h to examine the phagocytic ability of DCs. As shown in (C), the intensity of FITC-dextran in DCs treated with GUPS and PFPS was significantly reduced compared to the control group, while TAPS and OSPS did not reduce it. The results indicated that the in vitro immunostimulatory activity of GUPS and PFPS was higher than that of TAPS and OSPS.
3.4. TAPS and OSPS induced DC maturation through TLR4
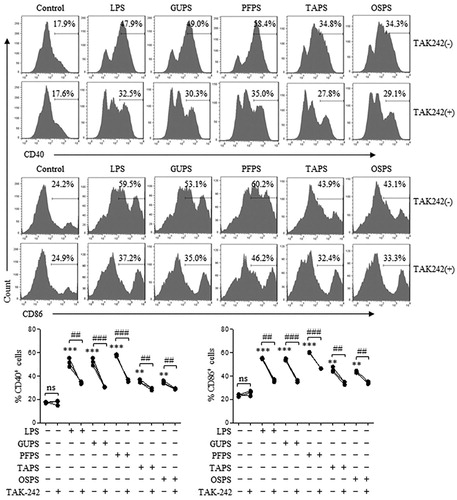
Our previous studies reported that PFPS and GUPS promoted DC maturation through TLR4 signalling pathway (Aipire, Mahabati, et al., Citation2020; J. Li et al., Citation2017). To explore whether TAPS and OSPS enhance DC maturation through TLR4, DCs were pretreated with TLR4 inhibitor, TAK-242, and then treated with different concentrations of polysaccharides or LPS. After 12 h, DCs were collected to analyse the expression of CD40 and CD86 by flow cytometry. As shown in , TAK-242 pretreatment significantly suppressed the expression of CD40 and CD86 induced by all four polysaccharides and LPS, suggesting that TAPS and OSPS also promoted DC maturation via TLR4.
Figure 6. GUPS, PFPS, TAPS and OAPS promoted DC maturation through TLR4. DCs were pretreated with or without TAK-242, and then treated with 20 μg/mL of GUPS, PFPS, TAPS and OSPS for 12 h. The expression of CD40 and CD86 was detected by flow cytometry. Data are from 3 independent experiments. ** p < 0.01; *** p < 0.001 compared to untreated DCs (ANOVA). ## p < 0.01; ### p < 0.001 compared to TAK-242 pretreated DCs (paired t-test).
3.5. The immunoregulatory effects of these four polysaccharides on murine immunity
The natural polysaccharides are valuable sources for the development of adjuvant because they have the characteristics of immunoregulation, biocompatibility, biodegradability and low toxicity (Schepetkin & Quinn, Citation2006; H. X. Sun et al., Citation2009). Therefore, the immunoregulatory effects of TAPS, OSPS, GUPS and PFPS were evaluated in mouse model. All the four polysaccharides did not affect the body weight of mice and the organ indexes of heart, kidney, liver and lung (supplementary Fig. 1 and supplementary Table 1). Although TAPS and OSPS did not change spleen and thymus indexes, GUPS and PFPS significantly increased spleen and thymus indexes (supplementary Table 1), suggesting that the immunostimulatory activity of GUPS and PFPS was stronger than that of TAPS and OSPS.
Sera were collected on days 1 and 3 to detect the production of IL-12p40 and TNF-α. As shown in (A), all the four polysaccharides significantly increased the level of IL-12p40 compared with the control group. Moreover, GUPS and PFPS induced higher level of IL-12p40 than TAPS and OSPS. IL-12 production plays a critical role in driving Th1-type immune responses (Constantino et al., Citation2017; Zhu et al., Citation2016), indicating that GUPS and PFPS can be used immunostimulant for cancer therapy or as adjuvant for vaccines against infection and cancer. Interestingly, all the four polysaccharides did not increase the production of TNF-α, indicating that they did not induce inflammation in mice. However, LPS induced inflammation due to the higher production of TNF-α, which was consistent with previous studies (He et al., Citation2017; X. Liu et al., Citation2019).
Figure 7. The effects of GUPS, PFPS, TAPS and OSPS on the immunity of mice. Naïve ICR mice were injected with GUPS, PFPS, TAPS, OAPS or LPS intraperitoneally. (A) The levels of IL-12 and TNF-α in sera collected on days 1 and 3. (B) The proportions of T cells, B cells and NK cells in spleen. (C) The proportions of CD4+, CD8+, CD4+CD44+ and CD8+CD44+ T cells in spleen were analysed by flow cytometry. * p < 0.05; ** p < 0.01; *** p < 0.001 compared to control group (ANOVA).
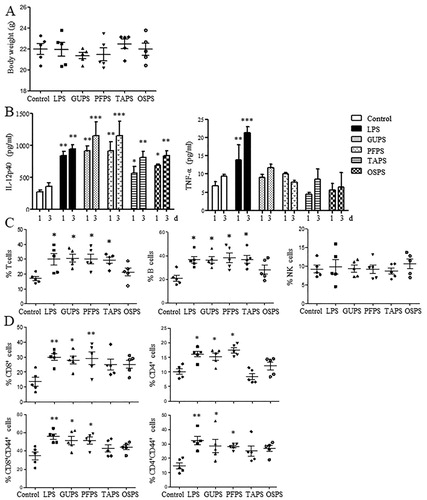
The frequencies of immune cells in the spleen were further analysed by flow cytometry. As shown in (B), the frequencies of T cells (CD3+CD19-) and B cells (CD3-CD19+) were significantly increased by GUPS, PFPS and TAPS compared with the control group, whereas OSPS did not change them. The proportions of NK cells (CD3-CD19-CD49b+) had no difference among all groups. Furthermore, the proportions of CD4+ and CD8+ T cells and their activation status were analysed. As shown in (C), GUPS and PFPS significantly improved not only the proportions of CD4+ and CD8+ T cells but also their activation status due to the increased proportions of CD4+CD44+ and CD8+CD44+ T cells. However, TAPS and OSPS did not change them. The results suggested that the in vivo immunostimulatory activity of the four polysaccharides could be ranked as the following order: PFPS = GUPS > TAPS >OSPS.
4. Conclusion
TAPS, OSPS, GUPS and PFPS have their distinctly structural characteristics. Although all the four polysaccharides promoted the maturation of DCs through TLR4, the activities of GUPS and PFPS were higher than that of TAPS and OSPS. GUPS and PFPS enhanced the Th1 skewing immune response in mice without inflammation. TAPS and OSPS just showed a weak immunostimulatory effect in vivo. Taken together, the immunostimulatory activities of the four polysaccharides were ranked as: PFPS = GUPS > TAPS > OSPS. Therefore, GUPS and PFPS could be used as adjuvant or immunostimulant for cancer therapy.
Supplemental Material
Download MS Word (67.5 KB)Disclosure statement
No potential conflict of interest was reported by the author(s).
Additional information
Funding
Related Research Data
References
- Aipire, A., Li, J., Yuan, P., He, J., Hu, Y., Liu, L., Feng, X., Li, Y., Zhang, F., Yang, J., & Li, J. (2017). Glycyrrhiza uralensis water extract enhances dendritic cell maturation and antitumor efficacy of HPV dendritic cell-based vaccine. Scientific Reports, 7(1), Article 43796. https://doi.org/10.1038/srep43796
- Aipire, A., Mahabati, M., Cai, S., Wei, X., Yuan, P., Aimaier, A., Wang, X., & Li, J. (2020). The immunostimulatory activity of polysaccharides from Glycyrrhiza uralensis. PeerJ, 8, Article e8294. https://doi.org/10.7717/peerj.8294
- Aipire, A., Yuan, P., Aimaier, A., Cai, S., Mahabati, M., Lu, J., Ying, T., Zhang, B., & Li, J. (2020). Preparation, characterization, and immuno-enhancing activity of polysaccharides from Glycyrrhiza uralensis. Biomolecules, 10(1), Article pii: E159. https://doi.org/10.3390/biom10010159
- Alam, N., Yoon, K. N., Lee, J. S., Cho, H. J., & Lee, T. S. (2012). Consequence of the antioxidant activities and tyrosinase inhibitory effects of various extracts from the fruiting bodies of Pleurotus ferulae. Saudi Journal of Biological Sciences, 19(1), 111–118. https://doi.org/10.1016/j.sjbs.2011.11.004
- Asl, M. N., & Hosseinzadeh, H. (2008). Review of pharmacological effects of Glycyrrhiza sp. And its bioactive compounds. Phytotherapy Research, 22(6), 709–724. https://doi.org/10.1002/ptr.2362
- Bo, R., Liu, Z., Zhang, J., Gu, P., Ou, N., Sun, Y., Hu, Y., Liu, J., & Wang, D. (2019). Mechanism of Lycium barbarum polysaccharides liposomes on activating murine dendritic cells. Carbohydrate Polymers, 205, 540–549. https://doi.org/10.1016/j.carbpol.2018.10.057
- Cai, L., Zou, S., Liang, D., & Luan, L. (2018). Structural characterization, antioxidant and hepatoprotective activities of polysaccharides from Sophorae tonkinensis Radix. Carbohydrate Polymers, 184, 354–365. https://doi.org/10.1016/j.carbpol.2017.12.083
- Cao, J., Tang, D., Wang, Y., Li, X., Hong, L., & Sun, C. (2018). Characteristics and immune-enhancing activity of pectic polysaccharides from sweet cherry (Prunus avium). Food Chemistry, 254, 47–54. https://doi.org/10.1016/j.foodchem.2018.01.145
- Chen, Q., Qi, C., Peng, G., Liu, Y., Zhang, X., & Meng, Z. (2018). Immune-enhancing effects of a polysaccharide PRG1-1 from Russula griseocarnosa on RAW264.7 macrophage cells via the MAPK and NF-κB signalling pathways. Food and Agricultural Immunology, 29(1), 833–844. https://doi.org/10.1080/09540105.2018.1461198
- Chen, J., Zhu, X. Q., Yang, L., Luo, Y., Wang, M. Y., Liu, X. T., Liang, K. X., & Gu, X. L. (2016). Effect of Glycyrrhiza uralensis Fisch polysaccharide on growth performance and immunologic function in mice in Ural City, Xinjiang. Asian Pacific Journal of Tropical Medicine, 9(11), 1078–1083. https://doi.org/10.1016/j.apjtm.2016.08.004
- Constantino, J., Gomes, C., Falcao, A., Neves, B. M., & Cruz, M. T. (2017). Dendritic cell-based immunotherapy: A basic review and recent advances. Immunologic Research, 65(4), 798–810. https://doi.org/10.1007/s12026-017-8931-1
- DuBois, M., Gilles, K. A., Hamilton, J. K., Rebers, P. A., & Smith, F. (1956). Colorimetric method for determination of sugars and related substances. Analytical Chemistry, 28(3), 350–356. https://doi.org/10.1021/ac60111a017
- Falch, B. H., Espevik, T., Ryan, L., & Stokke, B. T. (2000). The cytokine stimulating activity of (1→3)-β-D-glucans is dependent on the triple helix conformation. Carbohydrate Research, 329(3), 587–596. https://doi.org/10.1016/S0008-6215(00)00222-6
- Ferreira, S. S., Passos, C. P., Madureira, P., Vilanova, M., & Coimbra, M. A. (2015). Structure-function relationships of immunostimulatory polysaccharides: A review. Carbohydrate Polymers, 132, 378–396. https://doi.org/10.1016/j.carbpol.2015.05.079
- Harris, S., Monteagudo-Mera, A., Kosik, O., Charalampopoulos, D., Shewry, P., & Lovegrove, A. (2019). Comparative prebiotic activity of mixtures of cereal grain polysaccharides. AMB Express, 9(1), 203. https://doi.org/10.1186/s13568-019-0925-z
- He, X., Liu, W., Shi, M., Yang, Z., Zhang, X., & Gong, P. (2017). Docosahexaenoic acid attenuates LPS-stimulated inflammatory response by regulating the PPARγ/NF-κB pathways in primary bovine mammary epithelial cells. Research in Veterinary Science, 112, 7–12. https://doi.org/10.1016/j.rvsc.2016.12.011
- He, X., Wang, Z., Xiao, Y., Zhou, L., Ruan, Z., Chen, X., Hu, M., Ma, F., Zheng, M., Su, X., & Deng, X. (2020). Gynostemma pentaphyllum polysaccharide prevents the growth of h22 ascites tumour by enhancing immunity rather than cytotoxicity in mice. Food and Agricultural Immunology, 31(1), 367–378. https://doi.org/10.1080/09540105.2020.1730770
- John, A., Yang, J., Liu, J., Jiang, Y., & Yang, B. (2018). The structure changes of water-soluble polysaccharides in papaya during ripening. International Journal of Biological Macromolecules, 115, 152–156. https://doi.org/10.1016/j.ijbiomac.2018.04.059
- Kaur, A., Yadav, M. P., Singh, B., Bhinder, S., Simon, S., & Singh, N. (2019). Isolation and characterization of arabinoxylans from wheat bran and study of their contribution to wheat flour dough rheology. Carbohydrate Polymers, 221, 166–173. https://doi.org/10.1016/j.carbpol.2019.06.002
- Li, J., Aipire, A., Zhao, H., Yuan, P., & Li, J. (2019). Pleurotus ferulae polysaccharides improve the antitumor efficacy of therapeutic human papillomavirus dendritic cell-based vaccine. Human Vaccines & Immunotherapeutics, 15(3), 611–619. https://doi.org/10.1080/21645515.2018.1547604
- Li, H., Dong, Z., Liu, X., Chen, H., Lai, F., & Zhang, M. (2018). Structure characterization of two novel polysaccharides from Colocasia esculenta (taro) and a comparative study of their immunomodulatory activities. Journal of Functional Foods, 42, 47–57. https://doi.org/10.1016/j.jff.2017.12.067
- Li, J., Li, J., Aipire, A., Luo, J., Yuan, P., & Zhang, F. (2016). The combination of Pleurotus ferulae water extract and CpG-ODN enhances the immune responses and antitumor efficacy of HPV peptides pulsed dendritic cell-based vaccine. Vaccine, 34(31), 3568–3575. https://doi.org/10.1016/j.vaccine.2016.05.022
- Li, J., Wang, X., Wang, W., Luo, J., Aipire, A., Li, J., & Zhang, F. (2015). Pleurotus ferulae water extract enhances the maturation and function of murine bone marrow-derived dendritic cells through TLR4 signaling pathway. Vaccine, 33(16), 1923–1933. https://doi.org/10.1016/j.vaccine.2015.02.063
- Li, J., Yuan, P., Wang, X., Aipire, A., Li, M., Yang, J., Tao, H., Ying, T., Fu, C., Wei, X., Zhang, F., & Li, J. (2017). Purification, characterization and bioactivities of polysaccharides from Pleurotus ferulae. Food & Function, 8(5), 1905–1914. https://doi.org/10.1039/C7FO00227K
- Li, Q., Zhang, F., Chen, G., Chen, Y., Zhang, W., Mao, G., Zhao, T., Zhang, M., Yang, L., & Wu, X. (2018). Purification, characterization and immunomodulatory activity of a novel polysaccharide from Grifola frondosa. International Journal of Biological Macromolecules, 111, 1293–1303. https://doi.org/10.1016/j.ijbiomac.2018.01.090
- Liu, X., Jin, X., Yu, D., & Liu, G. (2019). Suppression of NLRP3 and NF-kappaB signaling pathways by alpha-Cyperone via activating SIRT1 contributes to attenuation of LPS-induced acute lung injury in mice. International Immunopharmacology, 76, Article 105886. https://doi.org/10.1016/j.intimp.2019.105886
- Liu, W., Liu, Y., Zhu, R., Yu, J., Lu, W., Pan, C., Yao, W., & Gao, X. (2016). Structure characterization, chemical and enzymatic degradation, and chain conformation of an acidic polysaccharide from Lycium barbarum L. Carbohydrate Polymers, 147, 114–124. https://doi.org/10.1016/j.carbpol.2016.03.087
- Luo, J., Sun, Q., Ma, Z., Song, J., Wu, C., & Li, X. (2019). Ultrasonic extraction, structural characterization and bioactivities of non-starch polysaccharides from red yeast rice. Biotechnology and Applied Biochemistry. Advance online publication.
- Ma, L., Zhao, Y., Yu, J., Ji, H., & Liu, A. (2018). Characterization of Se-enriched Pleurotus ostreatus polysaccharides and their antioxidant effects in vitro. International Journal of Biological Macromolecules, 111, 421–429. https://doi.org/10.1016/j.ijbiomac.2017.12.152
- Molaei, H., & Jahanbin, K. (2018). Structural features of a new water-soluble polysaccharide from the gum exudates of Amygdalus scoparia Spach (Zedo gum). Carbohydrate Polymers, 182, 98–105. https://doi.org/10.1016/j.carbpol.2017.10.099
- Mzoughi, Z., Abdelhamid, A., Rihouey, C., Le Cerf, D., Bouraoui, A., & Majdoub, H. (2018). Optimized extraction of pectin-like polysaccharide from Suaeda fruticosa leaves: Characterization, antioxidant, anti-inflammatory and analgesic activities. Carbohydrate Polymers, 185, 127–137. https://doi.org/10.1016/j.carbpol.2018.01.022
- Navegantesa, K. C., Albuquerquea, R. F. V., Dalla-Santab, H. S., Soccolc, C. R., & Monteiro, M. C. (2013). Agaricus brasiliensis mycelium and its polysaccharide modulate the parameters of innate and adaptive immunity. Food and Agricultural Immunology, 24(4), 393–408. https://doi.org/10.1080/09540105.2012.691089
- Schepetkin, I. A., & Quinn, M. T. (2006). Botanical polysaccharides: Macrophage immunomodulation and therapeutic potential. International Immunopharmacology, 6(3), 317–333. https://doi.org/10.1016/j.intimp.2005.10.005
- Shu, Z., Yang, Y., Xing, N., Wang, Y., Wang, Q., & Kuang, H. (2018). Structural characterization and immunomodulatory activity of a pectic polysaccharide (CALB-4) from Fructus aurantii. International Journal of Biological Macromolecules, 116, 831–839. https://doi.org/10.1016/j.ijbiomac.2018.01.165
- Stephanie, B., Eric, D., Sophie, F. M., Christian, B., & Yu, G. (2010). Carrageenan from Solieria chordalis (Gigartinales): Structural analysis and immunological activities of the low molecular weight fractions. Carbohydrate Polymers, 81(2), 448–460. https://doi.org/10.1016/j.carbpol.2010.02.046
- Sun, H. X., Wang, H., Xu, H. S., & Ni, Y. (2009). Novel polysaccharide adjuvant from the roots of Actinidia eriantha with dual Th1 and Th2 potentiating activity. Vaccine, 27(30), 3984–3991. https://doi.org/10.1016/j.vaccine.2009.04.037
- Sun, L., Zhu, B., Li, D., Wang, L., Dong, X., Murata, Y., Xing, R., & Dong, Y. (2010). Purification and bioactivity of a sulphated polysaccharide conjugate from viscera of abalone Haliotis discus hannai Ino. Food and Agricultural Immunology, 21(1), 15–26. https://doi.org/10.1080/09540100903418859
- Surayot, U., & You, S. (2017). Structural effects of sulfated polysaccharides from Codium fragile on NK cell activation and cytotoxicity. International Journal of Biological Macromolecules, 98, 117–124. https://doi.org/10.1016/j.ijbiomac.2017.01.108
- Tang, Z. H., Li, T., Tong, Y. G., Chen, X. J., Chen, X. P., Wang, Y. T., & Lu, J. J. (2015). A systematic review of the anticancer properties of compounds isolated from Licorice (Gancao). Planta Medica, 81(18), 1670–1687. https://doi.org/10.1055/s-0035-1558227
- Wang, M., Liu, Y., Qiang, M., & Wang, J. (2017). Structural elucidation of a pectin-type polysaccharide from Hovenia dulcis peduncles and its proliferative activity on RAW264.7 cells. International Journal of Biological Macromolecules, 104(Pt A), 1246–1253. https://doi.org/10.1016/j.ijbiomac.2017.07.004
- Wang, Z.-B., Pei, J.-J., Ma, H.-L., Cai, P.-F., & Yan, J.-K. (2014). Effect of extraction media on preliminary characterizations and antioxidant activities of Phellinus linteus polysaccharides. Carbohydrate Polymers, 109, 49–55. https://doi.org/10.1016/j.carbpol.2014.03.057
- Wang, Y., Wei, X., Wang, F., Xu, J., Tang, X., & Li, N. (2018). Structural characterization and antioxidant activity of polysaccharide from ginger. International Journal of Biological Macromolecules, 111, 862–869. https://doi.org/10.1016/j.ijbiomac.2018.01.087
- Wang, P. C., Zhao, S., Yang, B. Y., Wang, Q. H., & Kuang, H. X. (2016). Anti-diabetic polysaccharides from natural sources: A review. Carbohydrate Polymers, 148, 86–97. https://doi.org/10.1016/j.carbpol.2016.02.060
- Wang, Z., Zhou, F., & Quan, Y. (2014). Antioxidant and immunological activity in vitro of polysaccharides from Phellinus nigricans mycelia. International Journal of Biological Macromolecules, 64, 139–143. https://doi.org/10.1016/j.ijbiomac.2013.11.038
- Wu, Y., Yi, L., Li, E., Li, Y., Lu, Y., Wang, P., Zhou, H., Liu, J., Hu, Y., & Wang, D. (2017). Optimization of Glycyrrhiza polysaccharide liposome by response surface methodology and its immune activities. International Journal of Biological Macromolecules, 102, 68–75. https://doi.org/10.1016/j.ijbiomac.2017.04.006
- Xu, Y., Gao, Y., Liu, F., Niu, X., Wang, L., Li, X., Chen, H., & Yang, Y. (2018). Sulfated modification of the polysaccharides from blackcurrant and their antioxidant and α-amylase inhibitory activities. International Journal of Biological Macromolecules, 109, 1344–1354. https://doi.org/10.1016/j.ijbiomac.2017.11.164
- Xu, Y., Niu, X., Liu, N., Gao, Y., Wang, L., Xu, G., Li, X., & Yang, Y. (2018). Characterization, antioxidant and hypoglycemic activities of degraded polysaccharides from blackcurrant (Ribes nigrum L.) fruits. Food Chemistry, 243, 26–35. https://doi.org/10.1016/j.foodchem.2017.09.107
- Yang, Y., Fu, C., Zhou, F., Luo, X., Li, J., Zhao, J., He, J., Li, X., & Li, J. (2018). Chemical composition, antioxidant and antitumor activities of sub-fractions of wild and cultivated Pleurotus ferulae ethanol extracts. PeerJ, 6, Article e6097. https://doi.org/10.7717/peerj.6097
- Yang, Y., Xing, R., Liu, S., Qin, Y., Li, K., Yu, H., & Li, P. (2019). Hydroxypropyltrimethyl ammonium chloride chitosan activates RAW 264.7 macrophages through the MAPK and JAK-STAT signaling pathways. Carbohydrate Polymers, 205, 401–409. https://doi.org/10.1016/j.carbpol.2018.10.101
- Yu, Y., Shen, M., Song, Q., & Xie, J. (2018). Biological activities and pharmaceutical applications of polysaccharide from natural resources: A review. Carbohydrate Polymers, 183, 91–101. https://doi.org/10.1016/j.carbpol.2017.12.009
- Zhang, H., Chen, J., Li, J., Yan, L., Li, S., Ye, X., Liu, D., Ding, T., Linhardt, R. J., Orfila, C., & Chen, S. (2018). Extraction and characterization of RG-I enriched pectic polysaccharides from mandarin citrus peel. Food Hydrocolloids, 79, 579–586. https://doi.org/10.1016/j.foodhyd.2017.12.002
- Zhang, Q., Xu, Y., Lv, J., Cheng, M., Wu, Y., Cao, K., Zhang, X., Mou, X., & Fan, Q. (2018). Structure characterization of two functional polysaccharides from Polygonum multiflorum and its immunomodulatory. International Journal of Biological Macromolecules, 113, 195–204. https://doi.org/10.1016/j.ijbiomac.2018.02.064
- Zhao, S., Li, B., Chen, G., Hu, Q., & Zhao, L. (2017). Preparation, characterization, and anti-inflammatory effect of the chelate of Flammulina velutipes polysaccharide with Zn. Food and Agricultural Immunology, 28(1), 162–177. https://doi.org/10.1080/09540105.2016.1230600
- Zhou, G., Sun, Y., Xin, H., Zhang, Y., Li, Z., & Xu, Z. (2004). In vivo antitumor and immunomodulation activities of different molecular weight lambda-carrageenans from Chondrus ocellatus. Pharmacological Research, 50(1), 47–53. https://doi.org/10.1016/j.phrs.2003.12.002
- Zhu, L., Zhang, F., Yang, L.-J., Ge, Y., Wei, Q.-F., & Ou, Y. (2016). EPSAH, an exopolysaccharide from Aphanothece halophytica GR02, improves both cellular and humoral immunity as a novel polysaccharide adjuvant. Chinese Journal of Natural Medicines, 14(7), 541–548. https://doi.org/10.1016/S1875-5364(16)30064-4