
ABSTRACT
Fermentation processes have been shown to be a good approach to food waste (FW) management. Among the commodities that can be bioproduced by using FW as an organic substrate and exploiting its biodegradability, there is lactic acid (LA). LA has gained the interest of research because of its role in the production of polylactic acid plastics. In this study, the influence of the HRT (2–5 days) used during the fermentation of the liquid fraction (∼12–13 g COD/L) of FW on LA yield and concentration was investigated. Moreover, the changes in the chemical composition (in terms of carbohydrates and organic metabolites concentration) of the influent occurring in the feeding tank were monitored and its influence on the downstream fermentation process was examined. High instability characterized the reactor run with the optimal production yield obtained on day 129 at an HRT 2 days with 0.81 g COD/g COD. This study shows the importance of the fluctuating composition of FW, a very heterogeneous and biologically active substrate, for the LA fermentation process. The non-steady state fermentation process was directly impacted by the unstable influent and shows that a good FW storage strategy has to be planned to achieve high and constant LA production.
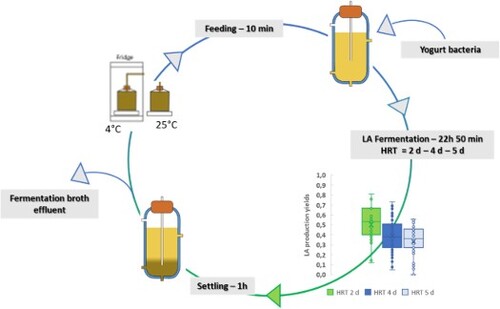
GRAPHICAL ABSTRACT
1. Introduction
Food waste (FW) represents over 40% of the average municipal solid waste composition [Citation1]. Its generation increased constantly in the last 60 years [Citation2] and has become one of the main environmental issues facing sustainable development. FW can be generated in every step of the production chain [Citation3] and it is estimated by the FAO that almost 1.3 billion tons of FW are produced yearly accounting for 32% of the total food harvested and manufactured in the world [Citation4]. FW is also one of the main causes of the increasing greenhouse gas emissions representing 6% of the global CO2 emitted in the atmosphere [Citation5,Citation6]. The huge amount of FW that has to be handled made the common strategies of FW management not sustainable anymore [Citation7]. Landfills, the most common way of FW disposal, do not guarantee protection from environmental impacts and are linked with dispersed biogas release and groundwater contamination [Citation8]. In the last decades, biological stabilization such as composting and anaerobic digestion (AD) has become the most attractive processes to deal with FW. These processes reduce the stress that FW can impose on the environment. In particular, FW AD has been largely investigated in order to optimize process parameters for the maximization of methane formation and production yields [Citation9–11]. However, in recent years, interest has shifted to focusing on using FW for fermentation processes. With fermentation, it is possible to use the FW organic content, rich in carbohydrates and proteins, to produce a cascade of chemical commodities like volatile organic acids (VFAs) [Citation12,Citation13], lactic acid (LA) [Citation14–16], succinate [Citation17], alcohols (ethanol and butanol) [Citation18] and biohydrogen [Citation19].
LA is an organic acid with two isomers, D-LA and L-LA, produced as an intermediate during the acidogenesis of AD processes [Citation20]. Even if LA could be produced chemically from acetaldehyde, almost 90% of industries produce LA through the fermentation of simple carbohydrates using specific bacterial strains called lactic acid bacteria (LAB) [Citation21,Citation22]. LA is exploited as raw material in other industrial applications like the food, cosmetic, and pharmaceutical industries [Citation23]. In the last years, a rise in LA demand was highlighted since LA is the main component of polylactic (PLA) acid products [Citation24]. PLA is the most produced and used bioplastic in the world and it is manufactured from the chemical polymerization of LA. For this reason, the LA market demand is estimated to grow from 1.22 Mt in 2016 to 1.96 Mt by 2025 [Citation20]. At this moment, the urgent aim of LA research is to study alternative substrates to make the process cheaper and cut LA production costs, to make them more competitive in the market when compared with conventional fossil fuel-based plastics. In a common LA production, the industrial process substrate counts for 40–70% of the total costs [Citation25]. Thus, FW can be seen as a direct solution to reduce operational costs and make the LA market prize more attractive.
FW has been shown to be a suitable substrate for LA production with several papers investigating which combination of parameters would optimize the production yields [Citation14–16,Citation26]. LA production is influenced by different parameters like pH, temperature, and type of microorganisms. Usually, mesophilic conditions and neutral pH are used to obtain the highest yields. Tang et al. [Citation15] obtained 0.46 g LA/g TS with this configuration. However, neutral pH allows the activity of acid producers [Citation27–29] and methane-producing archea, supporting LA degradation by forming, respectively, first VFAs and then methane. For this reason, uncontrolled pH fermentation with the pH free to drop below the LA pKa point of 3.78 is an interesting approach to stimulating not only high LA production but also its accumulation in the system [Citation16,Citation25,Citation30]. Working at such low pH guarantees inhibition of the largest part of the microbial community, avoiding LA transformation into VFAs [Citation30]. Moreover, acidic pH has direct consequences on production costs since no alkalizing agents are required to keep the pH mild/high [Citation31].
One of the highest limitations in utilizing FW as the substrate for fermentation is its high solid content. Several biochemical and technical problems are associated with the high solid content of FW. First of all, during fermentation, the hydrolysis phase is the rate-limiting step and if hydrolysis and solubilization of the substrate are slow then the whole process will be affected. Moreover, high TS concentrations could limit the mass transfer and the contact between substrate and microorganisms [Citation32]. One possible way to deal with the solid problem is to pretreat FW [Citation33]. Several FW pretreatments are reported in the literature. Thermal [Citation10,Citation34] ultrasonic [Citation35,Citation36], aeration [Citation8] and ozonation [Citation10] pretreatment have been tested to reduce the solid content and increase the soluble organic concentrations. However, there was no clear evidence that these pretreatments had a positive effect on LA production. Only an increase of just 9% in LA production was reported in the study by Li et al. [Citation34] after thermal pretreatment. Moreover, pretreatments are energy intensive, and they contribute to the increase in overall production costs. To avoid problems given by the solid fraction, it is possible to ferment just the liquid part of the FW that is already rich in a soluble substrate. So far, no study has yet been published about FW solid/liquid separation for liquid fermentation.
This study, therefore, investigated the possibility to ferment the liquid fraction of the FW. The FW was allowed to settle inside the fermentation tank, allowing the solid fraction to settle down and to be separated from the supernatant. Operation was carried out in a sequencing batch reactor (SBR) system that operated for 142 days at mesophilic and uncontrolled pH conditions. Three different hydraulic retention times were tested during the run (5, 4 and 2 days) and their influence on metabolite composition and LA production yield was investigated. Moreover, the chemical composition of the influent was constantly monitored to record change and thus to study the influences of these modifications on the fermentation efficiencies.
2. Materials and methods
2.1. FW and inoculum
To simulate a common household kitchen waste, a synthetic FW recipe was used in this study. FW was composed of the following weight ratio (% w/w): fruit and vegetable 78.4%, pasta and rice 5.1%, dairy products 1.9%, bread 6.4%, fish and meat 8.2%. Its complete physico-chemical characterization is reported in . The FW composition was taken from Ariunbaatar et al. [Citation10] and has been used in a previous study [Citation16]. Since this experiment aimed to feed just the liquid fraction, FW was diluted in a 1:5 w/w ratio with demi water prior to the experiment.
Table 1. Physico-chemical features of the synthetic FW used in this study.
A microbial culture from commercial yogurt (TS = 3.58%; VS = 2.44%) was used as Lactobacillus source and inoculated in the reactor. Yogurt was bought from a Galway supermarket (Dunnes, Dublin, Ireland). The choice of this inoculum was made to guarantee a high relative abundance of LAB at a limited cost compared to growing a pure culture. Moreover, yogurt was tested for LA fermentation in a previous batch test (data not shown) and resulted in an improved LA production compared to primary sludge and activated sludge.
2.2. Experimental setup and reactor conditions
A 1 L Up-flow Anaerobic Sludge Blanket (UASB) reactor with 0.8 L of working volume was used for this experiment. Fermentation was performed at mesophilic conditions (37°C) for 142 days following an SBR configuration. The experimental run was divided into three main phases according to the HRT set in the reactor. The details of the different phases and the SBR cycle are summarized in .
Table 2. Reactor phases and SBR cycle.
Prior to the start-up, the reactor was inoculated with 2 g VS/L of yogurt and left for 5 days running in batch mode to acclimate the microbial community and to degrade the carbohydrates present in the yogurt. After the dilution, FW was put in a tank at room temperature with no agitation. This favoured the settling and separation of the solid fraction allowing to feed the supernatant only. This choice was made to keep the total solid content in the reactor low and improve the mass transfer between substrate and microorganisms. On day 6 semicontinuous operation was started. The reactor was initially fed 160 mL of substrate per day with an HRT of 5 days (). During the fermentation time, agitation was guaranteed by internal recirculation of the fermentation broth. Recirculation was stopped during the settling phase, during which the biomass was allowed to settle avoiding being discharged during the discharge phase. From day 37, the feeding tank was put in a 4°C fridge in order to limit the strong biological activity in it. The pH was left uncontrolled but monitored constantly throughout the experiment. Gas bags (1 L) were put on the top port of the reactor to collect eventually produced gas.
The HRT was decreased during the experimental run to test its effect on the fermentation performance. From day 6 to day 46, the HRT was kept at 5 days. It was reduced to 4 days from day 47 to day 114 when it was further decreased to 2 days until the end of the experiment on day 142 ().
The reactor performance was monitored by sampling daily 5 mL of liquid from the influent and effluent. Chemical characterization was made by analysing LA, VFAs, carbohydrates and soluble oxygen demand (sCOD).
2.3. Analytical methods
Liquid samples were centrifuged at 14,100 rpm for 10 min and then filtered at 0.22 µm with cellulose acetate filters prior to the chemical analysis. The full organic content of the samples was characterized by performing the following chemical analysis: sCOD, carbohydrates, LA and VFAs. sCOD was determined by using an AA3 continuous flow nutrient analyzer (Seal Analytical, King’s Lynn, UK) as described by Pau et al. [Citation16]. The carbohydrate concentration was determined following the colorimetric method of Dubois et al. [Citation37] using a UV-1900 UV–VIS spectrophotometer (Shimadzu, Kyoto, Japan). LA and VFAs were measured with a 1260 Infinity II Agilent Technologies high-performance liquid chromatograph (HPLC) (Agilent, Santa Clara, USA) with a Hi-Plex H 300 mm × 7.7 mm column and detected with a refractive index detector (2.31 Hx) at 55°C. The eluent was 0.5 mmol/L H2SO4 solution with a flow rate of 0.7 mL/min with an injection volume of 50 µL [Citation16].
The TS and VS content were determined by putting samples in an oven overnight at 105°C and in a furnace for 2 h at 550°C as described by the standard methods of APHA [Citation38]. For pH, monitoring was done using a pH-meter 300 pH/ORP (Cole Parmer, Vernor Hill, USA) with a VWR Thin, ceramic junction electron probe (VWR, Radnor, USA).
2.4. Statistical analysis
ANOVA test for the analysis of the variance (p < 0.05) was performed with Origin 2018 software (v. 9.5.95, Norhampton, USA)
3. Results
3.1. pH profile
shows the pH profile of the influent and the UASB effluent. The initial pH of the diluted substrate was 4.77, while inside the reactor the contribution of the inoculum had the effect of acidifying the fermentation broth starting at a pH of 3.89.
Figure 1. pH profile of the influent and effluent during the experimental time.
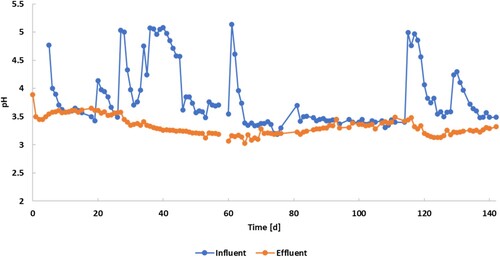
As can be noticed from the pH profile, the influent pH was not stable during the entire experimental run. The pH variation was a consequence of a partial fermentation of the substrate already occurring in the feeding tank. This brought the influent pH profile to have six main peaks (on days 5, 20, 27, 37, 61, 117 and 130) corresponding to the preparation of fresh FW. Fresh FW had a stable pH of around 5 that was constantly decreasing within 5–6 days from the start of its usage. This FW acidification in the feeding tank resulted in an average drop of 1.5 pH units bringing the influent to an average pH of around 3.5, similar to the effluent pH values.
Opposite to this, the effluent maintained an almost steady pH varying from 3.65 to 3.03. Specifically, the pH of the effluent decreased lightly but constantly from day 5 to day 65 reaching its minimum of 3.03 with a subsequent increase and stabilization around 3.5.
3.2. Influent composition
represents the chemical composition of the liquid influent during the 142 days of the experimental run. To maintain the characteristic of the influent as much stable as possible, fresh FW was prepared and fed into the reactor on days 20, 28, 37, 54, 114, and 130.
Figure 2. Composition variation of the influent during the experimental run.
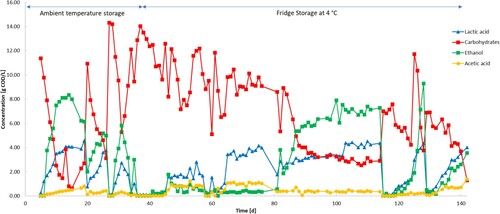
The influent was characterized by strong instabilities with fermentation processes happening already within the feeding tank. This was especially true during the first month of the experiment in which the feeding tank was left at room temperature (20–25°C). The usage of a fridge from day 37 onwards limited these instabilities but was unable to completely stop them.
The carbohydrate concentration of the influent started at 11.9 g COD/L and was degraded until day 14–0.65 g COD. A trend can be noticed from day 21 to day 27 and from day 28 to day 32 which represents the utilization of fresh FW. After putting the feeding tank in the fridge on day 37, carbohydrate degradation in the influent was slower but still present. From day 37 to day 52, the carbohydrate concentration passed from 14.0 to 7.5 g COD/L while from day 56 to day 84 it passed from 12.2 to 8.4 days COD/L followed by a sudden quick drop to 3.75 (± 0.25) g COD/L on day 87. From day 87 to day 114, the UASB reactor worked at the lowest carbohydrate concentration with a stable concentration of around 3.0 g COD/L. The feeding on days 114 and 130 brought back the concentration to around 8.0 g COD/L.
The carbohydrate degradation described above resulted in the generation of mainly ethanol, LA and a small part of acetate (). The concentration of these three metabolites followed an opposite trend to the carbohydrate concentrations, increasing in the feeding broth proportional to the age of the FW.
3.3. Bioreactor performance
3.3.1. Batch start-up
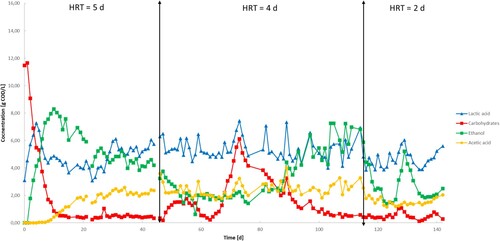
shows the metabolite composition of the fermentation broth effluent. From day 0 to day 5, the UASB reactor operated in batch mode with no feeding. This was to ensure inoculum acclimation and consumption of its endogenous carbohydrates content. During the start-up phase, carbohydrates were reduced by half passing from 11.46 to 6.12 g COD/L at a consumption rate of 1.09 g COD/L•d. LA, already present at a concentration of 3.10 g COD/L, was immediately produced along with ethanol, reaching a concentration of 6.76 and 4.57 g COD/L with production rates of 0.66 and 0.91 g COD/L•d, respectively. No VFAs were produced and no gas was detected during this phase.
Figure 3. Composition variation of the effluent during the experimental run.
3.3.2. Phase I – HRT of 5 days
Phase I studied the effect of the HRT set at 5 days. Following the trend of the start-up phase, carbohydrate degradation continued at the same rate until its almost complete depletion on day 12 with a concentration of 0.52 g COD/L. This further decreased but stabilized until the end of the phase with an average concentration of 0.43 (± 0.15) g COD/L. Over 90% of influent carbohydrate content was degraded during this phase.
The LA concentration decreased from day 4 to day 8 reaching 4.37 g COD/L. The profile shows, then, a stable concentration of 4.14 (± 0.47) until day 27 followed by a slight increase on day 30–6.12 g COD/L and an average concentration of 5.40 (± 0.61) g COD/L until the end of the phase. Ethanol continued to increase its concentration from phase I reaching an optimum concentration of 8.02 g COD/L on day 11. After this, its concentration decreased constantly until the end of the phase when it settled to 3.75 g COD/L. Acetate was the only VFA detected in this run. Its concentration was 0 for the first 9 days when it started to be produced at a rate of 0.18 g COD/L•d reaching 1.94 g COD/L on day 20 and its maximum concentration of 3.59 g COD/L on day 46.
3.3.3. Phase II – HRT of 4 days
On day 47, the HRT was decreased from 5 to 4 days, increasing the influent volume from 160 to 200 mL. This choice was made since the carbohydrate content in the influent was constantly depleted during phase I. Additionally, this was done to see if a higher organic load in ingress could be tolerated by the bacteria present within the fermentation reactor.
The change in the HRT brought a general instability in the reactor highlighted by two main periods in which carbohydrates accumulated inside the reactor. From day 48 to day 55, the carbohydrate concentration increased to 1.75 g COD/L with a reduction on the degradation rate from 90.1% in phase I to 84.9%. After a short reduction and a recovery in the degradation rates from day 60 to day 65, carbohydrates started to accumulate again in the reactor. The carbohydrate concentration increased from 0.21 g COD/L on day 63 to 6.11 g COD/L on day 73 reaching its minimum conversion rate of the complete reactor run with just 39.7% of the ingress carbohydrate concentration depleted by the microorganisms. The situation improved from day 73 when the substrate concentration started to decrease constantly reaching 0.49 g COD/L on day 111 and staying stable until the end of phase II on day 115. The inversion of the trend in the carbohydrate concentrations was corresponding to the high drop in carbohydrates concentration in the feeding tank as explained above.
The LA profile shows an oscillating behaviour in this phase reaching concentration peaks on days 73, 82 and 89 with a concentration of 7.44 (maximum of the run), 7.07 and 7.33 g COD/L, respectively. The average concentration of LA in phase II (5.40 (± 0.77) g COD/L) was in line with the previous phase. Following the trend of phase I, ethanol decreased for the first half of this phase passing from 3.75 g COD/L on day 47 to 1.48 g COD/L on day 54. Ethanol was stable until day 76 when its concentration started gradually to increase until day 104 reaching a concentration of 7.26 and a subsequent stabilization until the end of the phase. Acetate was still present with similar values compared to phase I. Its concentration varied in a range of 1.67–3.99 g COD/L.
3.3.4. Phase III – HRT of 2 days
Phase III started on day 115 and lasted until the end of the experimental run. In this phase, the HRT was further decreased to a value of 2 days with the influent volume increased to 400 mL/day. The choice was made after the carbohydrate accumulation registered in phase II was solved and their concentration went back to normal values. The aim was to push further the bacterial activity and see if they were able to work at high substrate content.
Similar to phase II, a carbohydrate accumulation was expected after the change in the HRT; however, no relevant increased in their concentration was observed in this phase. Carbohydrate concentrations were almost always below 1 g COD/L for the entire duration, indicating that no substrate shock happened.
The LA concentration presents the same oscillating trend observed in phase II with a similar range of values. In this phase, the maximum concentration was reached on day 129 at 6.09 g COD/L with an average concentration of 4.64 (± 0.59) g COD/L. The ethanol profile shows, instead, a quick decreasing behaviour from day 114 (6.81 g COD/L) to day 123 (1.39 g COD/L) with a subsequent peak on day 129 at 5.21 g COD/L. This followed a decreasing trend in ethanol concentrations from day 129 to day 136 by 62% at around 2.0 g COD/L and it was stable until the end of day 142. Acetate was still present, but its concentration presented a slight decrease compared to phase II. In the first half of this phase, the acetate concentration decreased from 3.27 g COD/L on day 114–1.19 g COD/L on day 126.
4. Discussion
4.1. Effects of storage on influent composition
This study shows the high instability of the FW-influent composition that seriously hampers the operation of the UASB reactor. These instabilities were due to fermentation processes happening inside the feeding tank, performed by the endogenous microbial communities present in the FW. The main consequences of this were high consumption rates of carbohydrates already in the feeding tank, associated with a production of mostly ethanol and LA with minor concentrations of acetate. From day 37, the consumption of carbohydrates was much slower compared to the run of the first month as putting the feeding tank inside a fridge slowed down the bacterial kinetic growth. Moreover, after fridge storage, ethanol production was almost stopped until day 83. From this, we can state that the low temperature helps to limit the substrate degradation process but does not completely stop it. From day 61 to day 114, no fresh FW was prepared to investigate the influent modification through a longer period. After 20 days in which carbohydrates decreased constantly but slowly, there was a sudden drop on day 83 that reduced their concentration by half followed by a stabilization until day 114 (). This sudden drop was coincident with a massive production of ethanol. This is likely due to the fact that the acclimation time of FW bacteria was longer since they were put at 4°C (fridge storage) and the carbohydrates concentration drop occurred only after 20 days and not immediately.
These results are in line with the study of Zhang et al. [Citation11] who made a comparative analysis of the impacts of the FW storage time on LA fermentation. They also report the changes in the FW characteristics through 15 days of storage at ambient temperature. The total sugars concentration was reduced by 68% from 94 to 30 g/L and among these, glucose was completely depleted within 2 days [Citation11]. LA was the main metabolite produced during storage reaching 25 g/L on day 15 of storage. Ethanol and acetate were present in minor concentrations [Citation11].
The changings in the influent reported above had several direct negative consequences on the fermentation performance. The first consequence that can be highlighted is that the high amount of carbohydrates degraded outside the reactor generates a lack of potentiality in the system, since most of the time the substrate was not at its maximum concentration. Secondly, the conversion of the carbohydrates in the feeding tank by the FW endogenous community can generate undesired side products like ethanol and VFAs. These compounds heavily affect the performance of the subsequent fermentation phase since these side products cannot be used by LAB to form LA. Though LA was similarly produced in the influent tank in this study, the concentration was not optimized with ethanol taking a large part of the carbohydrate conversion representing a loss of almost 50% of the FW’s conversion value. All these issues have to be carefully taken into account for a possible application of FW for LA production. Since LA is not the sole fermentation product, storage time should be accurately estimated in a scale-up to avoid organic oxidation and to keep the substrate in its original condition. Another possibility would be to limit biological phenomena during storage such as reducing the activity of non-LABs or by inhibiting the entire FW microbial community by a thermal pretreatment or a pasteurization process [Citation10]. This last solution could be the more feasible since by the EU regulation EC1774/2002 all FW has to be pasteurized before use [Citation10].
4.2. Reactor performance
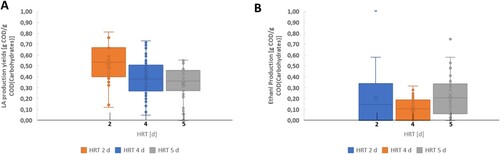
shows the substrate utilization yield and the daily production yield of carbohydrates, LA and ethanol expressed in grams of COD consumed/produced in one day/cycle divided by the influent carbohydrates concentration. shows instead the influence of the HRT on the LA ((a)) and ethanol ((b)) production yields. The results of are significant for p < 0.05.
Figure 4. Daily variation of the production of LA and ethanol and carbohydrate utilization.
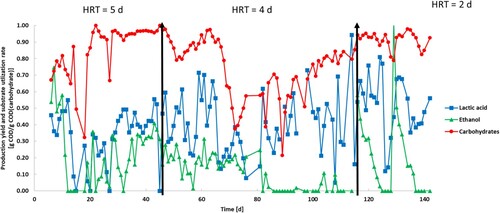
Figure 5. Influence of the HRT in the production yields of (a) LA and (b) ethanol.
Despite the high instabilities of the influent carbohydrate concentrations highlighted before, the substrate utilization rate was high for the largest part of the run with values reaching 1 g COD/g COD representing 100% substrate conversion. The overall average carbohydrate utilization rate was 0.81 (± 0.17) g COD/g COD. In phase I, the substrate utilization rate reached its maximum after 22 days and was stable between 0.9 and 1.0 g COD/g COD. During phase II, two drops can be highlighted (). The first was from day 47 to day 51, likely due to the change of HRT and subsequent increase of OLR that was set on day 47. This indicated a physiological time was required for the bacteria to get used to the new conditions since the values came back to optimum by day 60. A second big drop was recorded from day 65 to day 73 in which the carbohydrate utilization rate touched its minimum at 0.35 g COD/g COD. This is coincident to the high carbohydrate accumulation highlighted in phase II (). Bacterial activity inhibition is likely the main cause of this decrease in the carbohydrate degradation. Substrate inhibition is highly common in LA fermentation with also the acidic condition of the reactor slowing down the bacterial kinetics [Citation25]. A decrease in the substrate utilization rate and carbohydrate degradation was also found by Choi et al. [Citation39] and Tang et al. (Citation2016) [Citation15] when a low HRT and high OLR were set in their reactors. Despite this, an overall improvement was detected until the end of phase II and in phase III, with an HRT 2 days, the reactor achieved the best carbohydrate degradation with an average utilization rate of 0.91 g COD/g COD ().
LA was the main metabolite produced during the experimental run. The LA production yield averagely increased from 0.34 g COD/g COD in phase I to 0.52 g COD/g COD in phase III ((a)). Phase III presented the maximum LA production yield at 0.81 g COD/g COD produced on day 124. As shown in , the LA yield profile was characterized by high instabilities and no clear correlation can be directly made with the changes in the HRT. Generally, literature commonly observed that the decrease of the HRT, with subsequent increase in the organic loading rate has negative effects on LA yields [Citation30,Citation39,Citation44]. This is due to the increasing total solid concentration that can limit mass transfer and contact between substrate and microorganisms [Citation32]. Interestingly, this study showed instead the opposite behaviour likely because the solid fraction inside the reactor was kept at its minimum (<0.5% TS) by feeding solely the liquid fraction of the FW. Several aspects such as the formation of by-products can influence the LA fermentation resulting in a decreasing LA yield and overall reactor conversion efficiency [Citation25]. In this study, ethanol and acetic acid were produced as main co-metabolites along with LA.
Ethanol was constantly present in the effluent, but its high concentration shown in was mainly due to the fermentative processes happening in the feeding tank. shows that the ethanol production yield had a massive decrease in phase II reaching 0 from day 82 to day 114 but in the same period its concentration in the effluent increased from 2.35 to 6.81 g COD/L. In any case, for a large part of the run, especially in phase I and phase III, ethanol was also partially produced in the fermenter reaching its highest concentration of 8.29 g COD/L on day 10 and its maximum production yield on day 129 with 0.99 g COD/g COD. As shown in (b), the average ethanol production yield inside the reactor was highly stable and always lower than the LA one. The production yield passed from 0.19 g COD/g COD at HRT 5 days to 0.11 g COD/g COD at HRT 2 days. The acetate concentration was always constant during the fermentation and just slight changes were detected among the phases.
The presence of ethanol and acetate is likely due to heterofermentative processes in the reactor. LA can be synthetized from sugars through homofermentative or heterofermentative pathways. When LA production is aimed at a homofermentative pathway, it guarantees the highest conversion of sugars since every mol of hexose (glucose degraded) results in two moles of LA [Citation22]. In the heterofermentation pathway, just one mole of LA is produced along with one mol of acetate or ethanol [Citation22]. Heterofermentative pathways can be used by LAB for example to ferment pentose sugars (like xylose and arabinose) [Citation25] but can be also associated with changes in the fermentation condition such as low pH values, initial substrate concentration [Citation40] or aerobic conditions [Citation41].
4.3. Effect of the uncontrolled pH
The low pH could affect the bacterial activity having inhibitory effects on cellular metabolism and resulting in a non-steady state fermentation process. The pH was left uncontrolled for all the fermentation run aiming to work in a pH range lower than the LA pKa of 3.78. This choice to work at such low pH was made based on the findings from our previous study [Citation16] in which a pH lower than 4 was found to be the most suitable to have good LA production and accumulation inside the reactor. This is supported by different studies published in the literature [Citation30,Citation42] where it is reported that acidic conditions provide the best environment for inhibiting organic acid producers resulting in a lack of bacterial competition for carbohydrates and further LA conversion to VFAs. Great advantages are guaranteed by low pH operations in terms of costs since no reagent dose is required to maintain neutral conditions [Citation31] and this could also allow for the direct extraction of LA in liquid form simplifying the downstream processes necessary for LA purification [Citation43]. Despite these advantages, low pH work has still to be fully investigated for a possible industrial application. The main risk of working at low pH conditions is associated with LA accumulation in the system. At values below the pKa, LA is present mostly in its undissociated form. In this form, LA could pass through the cellular membrane causing cell destabilization and destruction [Citation22,Citation43]. This issue could be solved by extracting LA from the reactor continuously, thus avoiding its overaccumulation.
Conclusions
This study highlighted the instabilities that occurred during a long experimental run in which the liquid fraction of FW is used as main the substrate for the LA fermentation process. FW heterogeneity and internal modifications due to the endogenous bacterial activity were the main bottleneck in this study. The depletion of carbohydrates in the feeding tank affected the potentiality of the system performance, in particular, maximizing LA production. The storage conditions of FW were a key aspect of the good fermentation performance. Low temperature and short storage time should be considered when using FW. LA fermentation occurred for the complete experimental run with the best performance at HRT 2 days in which the reactor had the highest LA yield at 0.82 g COD/g COD. Ethanol was partially produced in the reactor and massively in the feeding tank. The presence of this by-product, due to heterofermentation, reduced the conversion efficiency of the carbohydrates. Moreover, the low pH condition set in the reactor might have partially affected the bacterial activity.
Acknowledgements
The authors would like also to thank Borja Khatabi Soliman Tamayo, Manuel Fachal and Leah Egan (NUIG, Ireland) for their help in the reactor setup and chemical analysis. This publication has emanated from the research supported by Science Foundation Ireland (SFI) through the SFI Research Professorship Innovative Energy Technologies for Biofuels, Bioenergy and a Sustainable Irish Bioeconomy (IETSBIO3; grant number 15/RP/2763) and the Research Infrastructure research grant Platform for Biofuel Analysis (Grant Number 16/RI/3401).
Disclosure statement
No potential conflict of interest was reported by the authors.
Data availability
The data will be provided on request to the corresponding author.
References
- Hoornweg D, Bhada-Tata P. What a waste: a global review of solid waste management. Washington (DC): World Bank; 2012; http://hdl.handle.net/10986/17388.
- Porter SD, Reay DS, Higgins P, et al. A half-century of production-phase greenhouse gas emissions from food loss & waste in the global food supply chain. Sci Total Environ. 2016;571:721–729. doi:10.1016/j.scitotenv.2016.07.041
- Jeswani HK, Figueroa-Torres G, Azapagic A. The extent of food waste generation in the UK and its environmental impacts. Sustain Prod Consump. 2021;26:532–547. doi:10.1016/j.spc.2020.12.021.
- FAO. (2019). The State of Food and Agriculture 2019. Moving forward on food loss and waste reduction. Food and Agriculture Organization of the United Nations, Rome.
- Amicarelli V, Lagioia G, Bux C. Global warming potential of food waste through the life cycle assessment: an analytical review. Environ Impact Assess Rev. 2021;91:106677, doi:10.1016/j.eiar.2021.106677.
- FAO. (2015). Food Wastage Footprint and Climate Change. http://www.fao.org/nr/susta inability/food-loss-and-waste. Accessed 10 March 2021.
- Ananno AA, Masud MH, Chowdhury SA, et al. Sustainable food waste management model for Bangladesh. Sustain Prod Consump. 2021;27:35–51. doi:10.1016/j.spc.2020.10.022.
- Yousuf A, Bastidas-Oyanedel JR, Schmidt JE. Effect of total solid content and pretreatment on the production of lactic acid from mixed culture dark fermentation of food waste. Waste Manage. 2018;77:516–521. doi:10.1016/j.wasman.2018.04.035.
- Linyi C, Yujie Q, Buqing C, et al. Enhancing degradation and biogas production during anaerobic digestion of food waste using alkali pretreatment. Environ Res. 2020;188:109743, doi:10.1016/j.envres.2020.109743.
- Ariunbaatar J, Panico A, Frunzo L, et al. Enhanced anaerobic digestion of food waste by thermal and ozonation pretreatment methods. J Environ Manag. 2014;146:142–149. doi:10.1016/j.jenvman.2014.07.042.
- Zhang J, Hu Q, Qu Y, et al. Integrating food waste sorting system with anaerobic digestion and gasification for hydrogen and methane co-production. Appl Energy. 2020;257:113988. doi:10.1016/j.apenergy.2019.113988
- Slezak R, Grzelak J, Krzystek L, et al. The effect of initial organic load of the kitchen waste on the production of VFA and H2 in dark fermentation. Waste Manage. 2017;68:610–617. doi:10.1016/j.wasman.2017.06.024.
- Valentino F, Munarin G, Biasiolo M, et al. Enhancing volatile fatty acids (VFA) production from food waste in a two-phases pilot-scale anaerobic digestion process. J Environ Chem Eng. 2021;9(5):106062, doi:10.1016/j.jece.2021.106062.
- RedCorn R, Engelberth AS. Identifying conditions to optimize lactic acid production from food waste co-digested with primary sludge. Biochem Eng J. 2016;105:205–213. doi:10.1016/j.bej.2015.09.014.
- Tang J, Wang X, Hu Y, et al. Lactic acid fermentation from food waste with indigenous microbiota: effects of pH,: temperature and high OLR. Waste Manage. 2016;52:278–285. doi:10.1016/j.wasman.2016.03.034
- Pau S, Tan LC, Lens PNL. Effect of pH on lactic acid fermentation of food waste using different mixed culture inocula. J Chem Technol Biotechnol 2021;97:0–3. doi:10.1002/jctb.6982.
- Leung CCJ, Cheung ASY, Zhang AYZ, et al. Utilisation of waste bread for fermentative succinic acid production. Biochem Eng J. 2012;65:10–15. doi:10.1016/j.bej.2012.03.010.
- Uçkun Kiran E, Liu Y. Bioethanol production from mixed food waste by an effective enzymatic pretreatment. Fuel. 2015;159:463–469. doi:10.1016/j.fuel.2015.06.101.
- Cappai G, De Gioannis G, Friargiu M, et al. An experimental study on fermentative H2 production from food waste as affected by pH. Waste Manage. 2014;34(8):1510–1519. doi:10.1016/j.wasman.2014.04.014.
- López-Gómez JP, Alexandri M, Schneider R, et al. A review on the current developments in continuous lactic acid fermentations and case studies utilising inexpensive raw materials. Process Biochem. 2018;79:1–10. doi:10.1016/j.procbio.2018.12.012.
- Alves de Oliveira R, Komesu A, Vaz Rossell CE, et al. Challenges and opportunities in lactic acid bioprocess design—from economic to production aspects. Biochem Eng J. 2018;133:219–239. doi:10.1016/j.bej.2018.03.003.
- Hatti-Kaul R, Chen L, Dishisha T, et al. Lactic acid bacteria: from starter cultures to producers of chemicals. FEMS Microbiol Lett. 2018;365(20):1–20. doi:10.1093/femsle/fny213.
- Ahmad A, Banat F, Taher H. A review on the lactic acid fermentation from low-cost renewable materials: recent developments and challenges. Env Technol Innov. 2020;20:101138, doi:10.1016/j.eti.2020.101138.
- Kwan TH, Hu Y, Lin CSK. Techno-economic analysis of a food waste valorisation process for lactic acid: lactide and poly(lactic acid) production. J Cleaner Prod. 2018;181:72–87. doi:10.1016/j.jclepro.2018.01.179.
- Abdel-Rahman MA, Sonomoto K. Opportunities to overcome the current limitations and challenges for efficient microbial production of optically pure lactic acid. J Biotechnol. 2016;236:176–192. doi:10.1016/j.jbiotec.2016.08.008.
- Zhang W, Li X, Zhang T, et al. High-rate lactic acid production from food waste and waste activated sludge via interactive control of pH adjustment and fermentation temperature. Chem Eng J. 2017;328:197–206. doi:10.1016/j.cej.2017.06.174.
- Kim M, Gomec CY, Ahn Y, et al. Hydrolysis and acidogenesis of particulate organic material in mesophilic and thermophilic anaerobic digestion. Env Technol. 2003;24(9):1183–1190. doi:10.1080/09593330309385659.
- Asunis F, De Gioannis G, Isipato M, et al. Control of fermentation duration and pH to orient biochemicals and biofuels production from cheese whey. Bioresour Technol. 2019;289:121722, doi:10.1016/j.biortech.2019.121722.
- Xu S, Lan K, Li J, et al. Separation of lactic acid from synthetic solutions and the mixture directly derived from corn stover by aqueous two phase extraction. Sep Purif Technol. 2018;204:281–289. doi:10.1016/j.seppur.2018.04.086.
- Itoh Y, Tada K, Kanno T, et al. Selective production of lactic acid in continuous anaerobic acidogenesis by extremely low pH operation. J Biosci Bioeng. 2012;114(5):537–539. doi:10.1016/j.jbiosc.2012.05.020.
- Joglekar HG, Rahman I, Babu S, et al. Comparative assessment of downstream processing options for lactic acid. Sep Purif Technol. 2006;52(1):1–17. doi:10.1016/j.seppur.2006.03.015.
- Lim SJ, Kim BJ, Jeong CM, et al. Anaerobic organic acid production of food waste in once-a-day feeding and drawing-off bioreactor. Bioresour Technol. 2008;99(16):7866–7874. doi:10.1016/j.biortech.2007.06.028.
- Rajesh Banu J, Merrylin J, Mohamed Usman TM, et al. Impact of pretreatment on food waste for biohydrogen production: a review. Int J Hydrogen Energy. 2020;45(36):18211–18225. doi:10.1016/j.ijhydene.2019.09.176.
- Li J, Zhang W, Li X, et al. Production of lactic acid from thermal pretreated food waste through the fermentation of waste activated sludge: effects of substrate and thermal pretreatment temperature. Bioresour Technol. 2018;247:890–896. doi:10.1016/j.biortech.2017.09.186.
- Jiang J, Gong C, Wang J, et al. Effects of ultrasound pre-treatment on the amount of dissolved organic matter extracted from food waste. Bioresour Technol. 2014;155:266–271. doi:10.1016/j.biortech.2013.12.064.
- Elbeshbishy E, Hafez H, Nakhla G. Ultrasonication for biohydrogen production from food waste. Int J Hydrogen Energy. 2011;36(4):2896–2903. doi:10.1016/j.ijhydene.2010.12.009.
- DuBois M, Gilles KA, Hamilton JK, et al. Colorimetric method for determination of sugars and related substances. J Anal Chem. 1956;28:350–356. doi:10.1021/ac60111a017.
- Apha. Standard methods for examination of water and wastewater 2012. Washington DC: American Public Health Association; 2012.
- Choi G, Kim J, Lee C. Effect of low pH start-up on continuous mixed-culture lactic acid fermentation of dairy effluent. Appl Microbiol Biotechnol. 2016;100(23):10179–10191. doi:10.1007/s00253-016-7871-3.
- Tanaka K, Komiyama A, Sonomoto K, et al. Two different pathways for D-xylose metabolism and the effect of xylose concentration on the yield coefficient of L-lactate in mixed-acid fermentation by the lactic acid bacterium Lactococcus lactis IO-1. Appl Microbiol Biotechnol. 2002;60(1–2):160–167. doi:10.1007/s00253-002-1078-5.
- Neves AR, Ramos A, Costa H, et al. Effect of different NADH oxidase levels on glucose metabolism of Lactococcus lactis: kinetics of intracellular metabolite pools by in vivo NMR. Appl Environ Microbiol. 2002;68:6332–6342.
- Feng K, Li H, Zheng C. Shifting product spectrum by pH adjustment during long-term continuous anaerobic fermentation of food waste. Bioresour Technol. 2018;270:180–188. doi:10.1016/j.biortech.2018.09.035.
- Upadhyaya BP, DeVeaux LC, Christopher LP. Metabolic engineering as a tool for enhanced lactic acid production. Trends Biotechnol. 2014;32(12):637–644. doi:10.1016/j.tibtech.2014.10.005.
- Luongo V, Policastro G, Ghimire A, et al. Repeated-batch fermentation of cheese whey for semi-continuous lactic acid production using mixed cultures at uncontrolled pH. Sustainability. 2019;11(12):1–12. doi:10.3390/su10023330.