
 ?Mathematical formulae have been encoded as MathML and are displayed in this HTML version using MathJax in order to improve their display. Uncheck the box to turn MathJax off. This feature requires Javascript. Click on a formula to zoom.
ABSTRACT
In this paper, the density and location of retail properties located within the primary retailing areas of Edinburgh, Glasgow, Hull, Liverpool and Nottingham are investigated over a 17 year period. The study is novel due to the original spatial databases developed and unique combination of established methods employed to explore spatial change within these northern UK cities. The paper starts from the premise that retailing markets display adaptive resilience where adaptations in use and variation in retail clustering will occur in response to endogenous and exogenous shocks that disturb the market’s agglomerative and competitive effects. The results suggest that significant new retail-led developments have intra-urban spatial outcomes that impact on the size and location of prime and secondary retailing pitches. In urban retailing centres where there have been no substantive supply disruptions, disturbances in the socio-economic environment can create contractions at the peripheral edges of the prime retailing pitch. This study is significant in providing a historical perspective of the micro-level effects of new development, changing customer shopping habits and shifting retailer location preferences. In addition, the research develops replicable and robust methods that can be employed to examine and monitor spatial change in urban centres. Understanding these dynamic micro-spatial effects are important for the future management of urban centres.
1. Introduction
The retail sector in the UK, as in many countries, is undergoing unprecedented change (Jones and Livingstone, Citation2017; Nanda et al., Citation2021). Following the aggressive growth of retail chains in the 1980s, 1990s, and 2000s, multiple retailers, particularly those unable to effectively embrace multi-channel retailing, are now disproportionately affected by shifts in consumers’ shopping behaviour, increased competition from online retailing, and rising operational costs which have led to multiple business failures and forced remaining retailers to rationalise their store portfolios (CBRE, Citation2018; Centre for Retail Research, Citation2022; Lamberton Smith Hampton and Revo, Citation2022). This growing trend is highlighted by Savills (Citation2021) who estimate that nearly 9,000 units occupied by multiple retailers entered some form of insolvency arrangement in 2020 in the UK, and that 63% of these stores are located on the high street or in high street shopping centres. The result of shop closures and general contraction in demand for physical space has been a steady rise in vacancy rates (7.4% to 11.3% between the first half of 2013 and 2021 across England, Scotland and Wales, a situation exacerbated by the Covid-19 pandemic (Local Data Company, Citation2022)) and a growing appreciation that the retailing sector is intertwined with the local economy and social infrastructure in urban areas (Carmona, Citation2021; Wrigley & Dolega, Citation2011).
In previous studies, the tendency has been to study either the performance of retailing centres at the aggregate national or regional level, or the behaviour of individual components within the retailing landscape in isolation with only the occasional study, such as Crosby et al. (Citation2005) and Greenhalgh et al. (Citation2020) focused on a local retail market. However, the period of change within urban centres, and the policy-response to re-create urban centres into a more balanced mix of uses, requires recognition that the retail market is part of a complex system comprising a large number of individuals and organisations with different expectations and relationships (Wrigley & Dolega, Citation2011). Moreover, it is the collective interaction of these relationships, organisations, and local and national institutional structures that shape the development and adaptive transformation of the urban landscape. It is these complex interrelations, which give rise to heterogeneous behaviours and physical reconfigurations that, over time, determine the pattern of urban development (Capello et al., Citation2015; Dolega & Celińska-Janowicz, Citation2015).
Yet, the retail sector is not just evolutionary but spatially complex, as the discussion on spatial interaction theory highlights in the Section 2. Adjustments, whether significant new developments or smaller scale changes in use, tend not to occur in isolation but to have spillover effects, resulting in spatial as well as temporal changes that influence the movement of stakeholders and their interactions with neighbouring locations. For instance, a new supermarket can draw trade from shops in an existing location. Such competition, especially between in-town and out-of-town centres and between different urban settlements, has given rise to the decline and degeneration of many town centres and suburban High Streets, and has dominated much of the academic attention (for example, Guy, Citation1998, Citation2007, Citation2008; Kok, Citation2007). Consequently, it is widely accepted that adjustments to retail provision affect inter-urban retail dynamics, however there is a weak evidence-based understanding of the micro-level spatial effects occurring within UK urban centres.
The hypothesis that intra-urban retail development impacts on the spatial dynamics of the urban retailing system is the starting point for this explorative study into how the retail market adapts. Through the exploration of the micro-level dynamics of land use change on the High Street, the study seeks to visualise spatio-temporal patterns of land use to identify and examine spatial variability within urban retailing systems. Shifting patterns of land use may be a consequence of new development, and/or other social-economic disturbances, such as land use policy changes, and it is important that key stakeholders understand the consequences of such change. This investigation will attempt to take account of such endogenous and exogenous disturbances on the evolution of city centre retailing centres.
The paper contributes to the literature in two ways. The first stage of the analysis links diverse administrative and commercial datasets in a manner that has not been undertaken before, to enable investigation into non-domestic property use within the core retailing areas of five northern UK cities. The second stage of the analysis uses a unique combination of established spatial methods to explore temporal spatial changes in the distribution of shops in relation to the most desirable retail locations (the prime pitchFootnote1) in the case study centres. The exploratory methods employed should inform future retail location research while the investigation into the impact of development activity and land use changes on the spatial-dynamics of retailing centres should contribute to the ongoing debate in the UK on planning flexibility and enabling urban retailing centre resilience.
First, the theoretical basis for the analysis of intra-urban spatial interaction in a retailing system is discussed below, before moving to the methods in Sections 3 and 4. In Section 3 the use of five case study areas is introduced, along with an explanation of the datasets linked to create the spatial-temporal databases used in the empirical application to explore the spatio-temporal pattern of property use. The methods used to capture spatial changes are detailed in Section 4. Results from the comparative studies are presented in Section 5. Finally, in Section 6, general conclusions are drawn about the implications of the findings for retailing centres as they continue to evolve and adapt.
2. Spatial interactions within retailing systems
The traditional approach to explaining urban retail development patterns used inter-urban systems, which examined spatial arrangements at the macro-level. These include Reilly’s retail gravity model (Reilly, Citation1929, Citation1931) and Christaller’s Central Place Theory (Christaller, Citation1933); the former recognising the relative attractiveness of centres as a function of centre attributes, exerting pull (attraction) and friction (distance) forces, and the latter introducing the notion of the retailing hierarchy whereby size and functionality shape the relative performance and position of retailing centres within the retailing system (Borchert, Citation1998). Both concepts have continuing relevance to explain inter-centre competition and form the basis of many spatial interaction models,Footnote2 often used to explain the spatial effects of out-of-town shopping malls that drew trade away from traditional High Streets and undermined the sustainability of town centres and suburbs.
Guy (Citation1999) was one such study. He described the decline of an established shopping centre following the introduction of a new out-of-town shopping development, where the subsequent reduction in shoppers and relocation of retailers triggered a net loss in retailers and rise in vacancies as shops closed and the rate of new shop openings fell. In response to such a consequential fall in centre vitality and viability, landlords and occupiers can cut capital expenditure (CAPEX) on stores as they delay or even cancel store refurbishments. This drives further decline in the shopping environment which, in turn, encourages more shoppers and retailers to relocate, the richness of retail provision contracts and the older centre enters a downward trajectory of decline. Beyond the tipping point, it becomes exceedingly difficult to reverse the decline. This is akin to Berry’s (Citation1963) end of a centre’s life cycle which would then require public sector investment in urban renewal to stem the spread of blight and possibly rejuvenate the failing urban centre.
In the UK, for decades the growth in the use of the motor car for shopping trips drove the shift in comparison shopping from smaller town centres to out-of-town shopping developments and larger city centres (Teale, Citation2012). The visible effects on declining centres, combined with findings from inter-urban empirical models, led to the redefining of retail planning policy in the 1990s to discourage further out-of-town retail development activity (Office of Deputy Prime Minister, Citation1996; Scottish Office, Citation1998). Trade draw assessments were another tool historically used by policy-makers to assess the potential impacts of large out-of-town or edge-of-town supermarket planning proposals on the vitality and viability of established urban centres. Widely used in practice, Guy (Citation1999) argues they had limited usefulness due to the difficulty of accurately isolating the impacts of trade draw from other processes.
In more recent research, and marking a change in focus for studies, retail markets are acknowledged as complex systems with adaptive resilience (Dolega & Celińska-Janowicz, Citation2015; Wrigley & Dolega, Citation2011). In such a system, mechanisms are driven by actors and their social agency to anticipate, evolve and adapt to endogenous and exogenous shocks. As systems adapt, agglomeration forces and associated benefits emerge that pull together complementary stakeholders while centrifugal forces disperse others, creating spatially variable interdependences, flows and structures. Hence, urban centres respond heterogeneously, and display different responses and levels of resilience to shock; the notion is that, the more diverse an urban economy, the higher its resilience to economic change (Capello et al., Citation2015). This heterogeneity is determined by a range of factors, including the structure and variety of its economic functions, the quality of its infrastructure provision and the strength of external linkages and co-operation networks that exist within the economy (Martin & Sunley, Citation2015). Together, this complex array of factors interact to create retailing centres with self-organising adaptive capacities that anticipate or react to socio-economic change and evolve at differential rates across the UK (Wrigley & Dolega, Citation2011). As variation has been shown to arise at the inter-urban level and result in differential rates of growth, it is not a huge leap of faith to conclude that intra-urban variations in the creation of new configurations, interdependences and further heterogeneity are possible in response to more localised endogenous shocks.
Studies into the spatial processes of change within intra-urban retail systems are rare. One exception is the seminal work of Berry (Citation1963), who envisaged urban retail systems as a series of inter-connected shopping districts subject to physical, economic, functional, and frictional factors that impact on their sustainability. Another exception is Crosby et al. (Citation2005). They investigated The Oracle in-town complex opening in Reading town centre and identified spatial variation in the effects. They found a loss in comparison outlets in the north end of the town while the higher loss of retailers in the fringe area was accompanied by a downgrading of the quality of retail outlets. The consequent rise in vacancies and slowdown in rental growth was found to be short term as services such as bars and restaurants replaced the lost retailers. Yet, they voiced concern that strong consumer spending and a vibrant local economy could be masking spatial structural changes in Reading’s urban system. This suggests that in-town shopping malls, actively encouraged by policy-makers in the 2000s in pursuit of retail-led urban renewal to increase the vitality and pulling power of a centre, could result in localised spatial externalities by diverting trade even within larger successful High Streets.
Urban retailing centres have ‘spatial form and context’ (Kärrholm et al., Citation2014), and can be split into prime and secondary retail pitches based on retail activity. The prime pitch is highly accessible and attractive in terms of walkability, street layout and connectivity, factors underpinning the generation of the highest levels of footfall. Reimers and Clulow (Citation2004) claim that it is possible to have an optimal distribution of shops on traditional High Streets, with comparison shopping concentrating on these sought-after prime pitches. National and international retailers (often as destination flagship stores in city centres or increasingly as showrooms as they embrace omni-channel retail formats) tend to locate here, and with the demand for space outstripping supply (at least historically), the prime pitch has the highest rents and best lease terms. The secondary pitch, although usually contiguous to the prime pitch, is perceived by the market as a poorer location. Any factor that interrupts the spatial convenience to shoppers, by increasing the time and physical effort involved in shopping, is also likely to disturb retailing activity and market perceptions of the boundaries between prime and secondary areas (Brown, Citation1989; Hotelling, Citation1929). In secondary locations, footfall is generally lower and consequently market rents are lower, with pitches tending to be occupied by more cost-conscious comparison retailers and traditionally those with weaker financial covenants.Footnote3 The consequent higher investment void risks and lower income security drive the higher investment yields attached to these lower quality assets (Lim et al., Citation2013).
Complementary and substitutable comparison shops, aggregated in close proximity, traditionally dominate the prime and secondary pitches in UK city centres. Stahl (Citation1982) argued that, despite the possible increase in competition, diverse retail clusters evolved to minimise the travel costs incurred by consumers and maximise the convenience by which multi-stop shopping trips can be made. Substitutable retailers, knowing the preferences of their customer base, co-locate to benefit from positive spillover effects from the greater footfall and aggregate demand drawn to such retail clusters which create higher sales volumes and profitability (Zhou & Clapp, Citation2015) although in today’s complicated retailing environment these physical store interactions often translate into higher online sales rather than in-store purchases. Brueckner (Citation1993) associated similar inter-store externalities as the reason for complementary retailers co-locating while Benjamin et al. (Citation1992) argued that the sharing of customers (localisation economies) underpinned the effectiveness of high sales generators, such as department stores,Footnote4 who function as anchors in shopping centres. Even when shopping for one product, consumer taste uncertainity and low price expectations can create a market size effect that encourages retail clustering as the higher concentration of stores increases the probabaility of the shopper finding a buyable purchase (Konishi, Citation2005).
Often the development of in-town shopping malls happens adjacent to the prime pitch as this is perceived as a viable way to extend the prime pitch, increase the supply of sought-after retail space, and maintain the spatial convenience to shoppers. However, Teale (Citation2012) maintained that in some centres this strategy has reduced, rather than enhanced vitality, with the over-development of inner-centre shopping producing spatial effects associated with congestion and poorer shopping experiences. This suggests clusters of retail activity in city centres have an optimal size. Clapp et al. (Citation2019) found a trade-off exists between the marginal increase in profits arising from the increase in consumer attraction from an additional store and reduction in the customer base caused by an additional competitor. They conclude that when the optimal size is reached, profits earned by existing retailers and the market rent they are willing to pay fall as additional new retail development occurs. Resultant over-supply can shift footfall which gives rise to urban blight on shopping streets as they are unable to internalise competitive effects like department stores and shopping centres (Clapp et al., Citation2019).
Despite further evidence of retail clusters and spatial variation in retailing in other countries (for example, Nyström & Folke, Citation2001), the deployment of land use clusters/densities to define town centre boundaries and the high street (Thurstain-Goodwin et al., Citation2002; Office of National Statistics and Ordnance Survey, Citation2019, Citation2020) and examples of the importance of use mix and clustering within shopping centres (for Brown, Citation1992; M G Brown, Citation1999), few studies exist examining the spatial changes that are occurring within local retailing streets in the UK and the impact of new development on retail clustering on the prime pitch within the urban retailing system. The impetus is now to transform and diversify retailing centres, but understanding the distribution of retail use and spatial effects on retailing activity, that may or may not occur when localised use changes transpire, remains limited. This explorative paper seeks to investigate the hypothesis that new retail developments effect the distribution of retail clustered on prime shopping streets. Understanding, and mastering, the evolution of retailing systems and influence of agglomerative and competitive effects in their adaptive capacity are pre-requisites if policy-makers are to introduce and implement urban policies that promote desirable development within the system and avoid unintended spatial outcomes.
3. Case Study Design and Data
3.1 Case study areas
City centres play a significant economic, social, and place-making role, yet are facing unprecedented challenges. They therefore form the focus of this study. This is a change of direction from previous studies which tended to explore smaller declining town centres. Specifically, using a case study approach, the core central retailing areas of five northern UK city centres are explored over a period of almost two decades. The choice of a northern sample avoids the complexity of the north-south disparities in economic, social and political forces that differentiate retail markets in the UK (Wrigley & Dolega, Citation2011). Selecting regionally significant cities central to the levelling-up debate in the UK, some defined as large core cities (Glasgow, Liverpool and Nottingham) and others more compact (Edinburgh and Hull), some experiencing significant development activity within the study period and some not, permits comparison of the effects of retail development and urban renewal processes at different scales within cities.Footnote5 The focus is on the central retailing areas, defined as the primary shopping area (PSA) or principal retailing area (PRA) where ground floor retail was prescribed and designated by local authority planning policy, and these are analysed over the period 2000–2017.Footnote6
The boundaries of the PSA/PRA have shifted over time so the study areas selected for micro-level analysis are taken as the maximum area of coverage by the PSA/PRA definitions adopted in the city plans spanning the study period. As boundary effects can occur in spatial studies, particularly when using spatial point data, buffer zones were also created. Including buffer zones in spatial analysis is a common technique used to avoid this bias where property units beyond the retail core are examined in terms of their effect on points within the study area but are not analysed in any other way so that edge effects are eliminated from the study area (Fotheringham & Rogerson, Citation1993).
Rather than pick an arbitrary buffer zone distance, zones based on the actual width of two street blocks around the edge of the PRA/PSA are set and therefore the width of buffer zones varies across cities due to street patterns, and allowances are made for the presence of open and physical features such as canals, rivers and dual carriageways.Footnote7 In Edinburgh the buffer zone width varies between 15.9 m and 178.9 m; Glasgow between 65.7 m and 194.6 m; Liverpool between 50.3 m and 205.5 m; and Nottingham typically between 64.2 m and 145 m although at one point is 272.7 m wide. The selected buffer zone for Hull is deeper to capture possible wider interactions as a PSA definition was not adopted until the 2017 city plan.
3.2 Data and data linkage
This study is original, in part because it links administrative and commercial datasets in a manner that has not been undertaken. This provides novel spatial stock databases that track the use of all non-residential property units within the case study city centres.Footnote8 summaries the data sources and variables created by this linking process (detailed in Supplementary File).
Table 1. Data variables and sources.
The five new stock datasets contain event point data consisting of all the legally recognised non-domestic properties (excluding car parking spaces, ATMs and advertisement and telecommunication facilities) within each of the PRA/PSA. The use for all the properties contained within these databases as at 1st April in 2000, 2005, 2010, and 2017 are categorised using a standardised system that dissects property use into 11 very broad categories: Shops; Entertainment, Leisure & Recreation; Food & Drink; Accommodation Services; Public & Social Value Services; Business, Commerce & Office Space; Industrial; Transport-Related; Vacant; Other, and Unknown.Footnote9 The classification approach taken, which embraces Guy’s (Citation1998) argument that a combination of definitions is the best approach, is based on the type of good/service produced and statutory planning use classes, and is required because of the differences in the classifications used by the different occupier data sources employed (Orr & Stewart, Citation2021). presents the number of properties within each category within the case study samples.
Table 2. Number and Variety of Non-Domestic Properties in Case Study Samples.
These figures illustrate both the significant spatial scale of the study and the extent of change in use over the study period. They reveal a drop in the number of shops in all five case study centres. However, the timing of this contraction depends on the city. For Glasgow, it occurred steadily through the study period with the earlier reductions linked to the merging of smaller units into the larger units sought by national and international retailers but, later, due to store closures. For Edinburgh and Nottingham the number of shops fell from 2005, whereas in Hull and Liverpool, following large scale retail development (St Stephen’s Shopping Centre and Liverpool One, respectively) between 2005 and 2010, the contraction in shop numbers came later. Steadily rising over the study period has been the number of food and drink outlets as many shops changed to this use, although more recently empty hospitality outlets as well as shops, form part of the rising number of vacancies. The two categories of ‘shops’ and ‘food and drink’ dominate the uses in each case study area, aside from office accommodation which, while adding to the vitality of an area through the influx of office workers, tends towards the lunchtime and after-hours periods of the day. Shops, as well as food and drink outlets (Sevtsuk, Citation2014), are those identified as most likely to exhibit spatial interdependency and clustering.
Other changes include a rise in accommodation services, typically in the form of hotels and student accommodation. These new uses have typically been conversions of former banks and building societies, lower quality office space and vacant upper floors that previously were used as storage. The number of offices has also risen but this change reflects the increase in the number of smaller uses as large floor plates have increasingly been subdivided into smaller office suites or serviced office space.
4. Methods used to examine spatial patterns of shops
Brown (Citation1987) argues that micro-level retail location behaviour displays, at least in part, centripetal tendencies that give rise to clusters of comparison retailers. This behaviour, typically displayed by fashion retailers, bookshops and mobile phone shops, is underpinned by Hotelling’s principle of minimum differentiation where retailers benefit from close proximity as it minimises the walking distance between shops and effort required by shoppers (Brown, Citation1989). Since Hotelling (Citation1929), the focus has been on localisation economies and market size effects, rather than game theory, as drivers of co-location, as discussed in Section 2. If these hold, it is expected that shop clusters would be present and that clusters corresponding with the prime retailing pitch, being the most central and accessible locations, would typically command higher market rents. Yet, as new development has occurred (Clapp et al., Citation2019) and/or retailing centres have become more diverse, encouraged by the policy shift influenced by The Portas Review (Portas, Citation2011) and The Grimsey Reviews (Grimsey et al., Citation2013, Citation2018), it is possible that these centripetal forces are being weakened by competitive effects, forcing retailing to become more dispersed or for changes to occur to the size or even location of prime pitch clusters.
To reveal such spatio-temporal changes, the five novel datasets described above are mapped within ArcGIS, enabling empirical examination of time-lapsing spatial patterns in the use and rents (proxied by rateable values). The geolocation for each property in the databases is derived by matching the property addresses with the addresses and grid coordinators in the AddressBase Premium. This provides a consistent mapping methodology which uses the central internal position of the property and is typically 2.5 m within the centre of the building polygon contained within OS MasterMap (Ordnance Survey, Citation2018). Mapping is carried out for the two dominant categories of use contributing to the vitality and vibrancy of an area identified in : Shops, and Food & Drink. Both are also identified as most likely to display spatial interdependencies and therefore most important in terms of exploring spatio-temporal patterns of change. This is achieved using three different spatial techniques: standard deviational ellipse, kernel density estimation, and optimised hotspot analysis.
Standard Deviational Ellipse (SDE) is a geoprocessing tool employed here to ascertain if the location behaviour of a specific land use had changed over time. SDE functions by measuring the compactness of the feature under study, in this instance point data of properties within the retailing areas, at specific time points, also enabling temporal comparison to be made. SDEs are advantageous as they measure the orientation and direction of features (something which a tool such as standard distance would not do) meaning that spatial trends in a distribution of features can be abstracted (Mitchell, Citation2009). SDEs are used to determine whether the distribution of different types of properties has changed over time and to identify directional trends in the location of specific groups of property use.
SDEs can be used to summarise three aspects of the spatial characteristics of use features: central tendency, dispersion, and directional trends. Weightings can also be applied to SDEs. The tool measures the standard deviation of the properties from the mean centre separately for the x- and y- co-ordinates of each observation point to define the axis of the ellipse (Mitchell, Citation2009).
The standard deviational ellipse created is calculated as:
Equation 1
where x- and y- are the coordinates for observation point i; n is the total number of observation points and are the coordinates for the mean centre of all the observation features. This gives equation 2:
Equation 2
which is the standard deviation of the x- and y- axis when the sample covariate matrix is factored into a standard form (Mitchell, Citation2009). The SDEs for Shops (S) and Food & Drink (FD), weighted by rateable value,Footnote10 are estimated for each retailing centre at each time point. To limit the impact of edge effects and outliers, the standard deviational ellipses are created only for properties located within the study area and 1 standard deviation is used. These enabled analysis of the distribution of Shops (and Food & Drink) within the designated retailing area and how these have changed over time.
Kernel density estimation (KDE) is a spatial density analysis method which is widely used with point data (Yang et al., Citation2019), and used here to display the geographic density of properties at different points in time to detect locations of high and low concentration. Examples of prior use include identifying accident and crime hotspots (for instance, Anderson, Citation2009; Chainey et al., Citation2008) and it has been used to identify the density of retail and services in areas of Bologna (Porta et al., Citation2009). KDE functions by transforming a geographically distributed set of points into a density surface by fitting a smooth curved surface over each point, in this instance the x- and y-coordinates of each Shop (or Food & Drink outlet). This is achieved by using a kernel function that estimates the density of neighbouring properties within a fixed area (cell) around each observation point as the sum of the fractions of all observations within the cell’s range. The kernel density estimated in each cell is defined in Equation 2:
Equation 3
where i = 1, 2 … ., n are the property points under observation; pi is the population field value of property i,Footnote11 di is the distance between the property i that is included in the sum and the x- and y- co-ordinates at the centre of the cell and b is the bandwidth.
Within each cell, the kernel function defined in Equation 3 gives more weight to objects nearer to the observation property at the centre of the cell than distant objects (Bailey & Gatrell, Citation1995; Fotheringham et al., Citation2000; Silverman, Citation1986). By doing so, the KDE converts the weighted count data of individual properties into a continuous density surface known as a raster (Porta et al., Citation2009).
The parameters used to create density surfaces influence the resulting map, so choosing appropriate parameters for the KDEs is important. The two parameters with the potential to change the results are cell size and bandwidth (b in Equation 3). The cell size is that created using the KDE tool to generate the raster surface and the user can either use the default calculated by the ArcGIS software, or select their own cell size. The default value varies between cities and time points as it is based on a calculation made on the area covered by the properties. To ensure consistency between cities and time points, the cell size was therefore specified. The cell size changes the level of smoothing in the surface, with larger cell sizes increasing the level of smoothing. For the purposes of this study the impact of smoothing is reduced to enable a more accurate depiction of the location of ‘hot’ and ‘cold’ spots. Sensitivity analysis was undertaken to establish the most appropriate cell size and, following this, a cell size of 5 m by 5 m is selected; which produced maps which are both meaningful but at the same time reduced the impact of smoothing.
The second parameter which influences the results of the KDE is the bandwidth. The larger the bandwidth the more smoothing there is, but using too small a bandwidth can result in too much of a focus just on the individual observations and thus negates the use of aggregated densities. Finding an optimal bandwidth is therefore important and the default was selected as it provides fast and accurate estimators for data with distribution close to normal (Heidenreich et al., Citation2013). Within ArcGIS the default is calculated specifically for each input data using a spatial variant of Silverman’s Rule of Thumb that is robust to spatial outliers. This is specified as:
Equation 4
where Dm is the median distance from mean centre; n is the number of points used when the optional population field is not used or is the sum of the population field values if used; and SD is the standard distance that can be calculated as the unweighted or weighted sum of the distances between property i and the mean centre for the properties.
As KDE takes account of the location and values of observations around each property, it is subject to boundary effects. Boundary effects occur when an artificial edge is imposed on spatial data (such as the edge of the retailing area) where there is not an actual physical boundary (such as a river) and results in properties just outside the boundary not being included despite the fact that there are likely to be interactions. To reduce the impact of this, the properties in the buffer zone around the retailing area are included. Once the density surfaces have been created, the raster surfaces are clipped to the retailing area so that only the results for the properties under study are shown. This is also done because, whilst the observations outside the retailing area are needed to overcome edge effects, the observations in the buffer zone are themselves subject to edge effects and so must be excluded.
The classification method used to group and display the outputs of the KDE was manually set, to allow comparison between different time periods, with values of 0 excluded so that areas with no data were not shown and not incorporated into the classification. This also meant that it was possible to distinguish between cold spots and areas with no use counts, making it easier to identify areas with high and low densities while the use of the same classification boundaries to map the density estimates for each time period enabled consistent comparison to highlight changes in density over time. The boundaries were calculated using quintiles which divided the KDE into five groups of even values at the benchmark time point. The benchmark time point being set as the time point that contained the largest range of densities.
Whilst kernel density is more scientific than other forms of heat map, there is still a level of subjectivity. It is possible to change what the maps look like by changing the parameters and using different classification methods. Whilst some of this subjectivity can be reduced – such as by using a classification system that suits the distribution of data – subjectivity remains. So, whilst kernel density maps are useful in identifying areas with high and low land use densities at each time point and enable changes to be identified, they lack a certain amount of rigour as they do not facilitate statistical analysis.
To overcome this, the third method of analysis is employed. A more objective form of point pattern analysis is Optimised Hot Spot Analysis (OHSA), based on inferential testing to determine if properties with a specific land use are distributed in a random or systematic pattern. It is used here on the PSA/PRA plus buffer zone, to identify clusters of high and low values of shops (and food and drink outlets) to see if the distribution of property values has changed as the retailing markets evolved. The Getis-Ord () statistic is the spatial autocorrelation method employed in the OHSA and is used to determine the location of the observation points that display statistically significant high spatial association (hot spot) and areas of low spatial association (cold spots). The spatial dependency of the observation property i over all the properties under observation, n, in the dataset is defined in Equation 5 as:
Equation 5
This form of (standardised, based on its sample mean and variance) is essentially a z-score as it measures the number of standard deviations from the sample mean where xj represents the magnitude of variable x at observation point j over all n events; wi,j is the spatial weight between property i and j;
is the sample mean (
) and the sample variance of variable x is defined as
(Songchitruksa & Zeng, Citation2010). This test is statistically reliable when there is a minimum of 30 properties (n) within the sample of observations.
The z-scores estimated using Equation 5 are used to examine the spatial pattern of the properties, and clusters of high values, relative to a critical p-value threshold, are identified as statistically significant hot spots, whereas a cold spot is a cluster of negative z-score values. A close to zero implies the null hypothesis of random distribution holds.
Optimisation of the hot spot results is achieved in Equation 5 by computing, for each property, its average nearest neighbour distance and if it is more than one standard deviation distance away from its closest non-coincident neighbour then this is deemed a location outlier that is excluded from the analysis. Spatial weights (wi,j) are also applied to a property when estimating Equation 5 based on either the property’s Zone A rateable value,Footnote12, Footnote13 or total rateable value, depending on the type of property, while the scale of analysis is determined by identifying peak distances when the Global Moran’s I statistics are employed on a series of systematically increasing distances. The peak distance is the distance where intensification of clustering is found to be present in the data. If no peak distance is found then the average distance that yields K (0.05xn) neighbours for each observation point is used. A limitation of this method is that it cannot differentiate between clusters of different uses, so the analysis is run separately for shops and for food and drink outlets (Songchitruksa & Zeng, Citation2010).
For shops, the OHSA are weighted by the rateable value in terms of the Zone A rate per square metre (ITZA). Rateable values are net annual rents estimated using a standardised valuation methodology and market data that captures changes in supply and demand flows in the retail market. Frodsham (Citation2016) cites an unpublished study by The Mall Research Consultancy that plotted Zone A rateable values from the VOA to examine the distribution of shops in central London, which they found to be a good indicator of the relative investment quality of assets on the same pitch. Therefore, the ITZA rateable values are used as a proxy for market rent to weight the OHSA, enabling the changes in the prime pitches to be explored. For the food and drink outlets, the total rateable value is used as a proxy for total market rent, as for many types of hospitality uses overall rents are derived using the profits method of valuation rather than a rent per square metre using the comparable method of valuation.
5. Spatial analysis and prime pitch boundary findings
Within the five case study areas, the use of shops has been adjusting to alternative uses, as illustrated in above. These urban retailing centres have become more diverse, although the balance in the mix of use, and in the richness and diversity of use, is uneven within and between centres. This section presents the findings of the three stages of the analysis to investigate these changes further and reveal spatio-temporal patterns of land use with/without new retail development, enabling exploration of the spatial impacts on established trading areas. This will help city centre policy-makers to better understand how different shopping forms and leisure uses within the retailing system are inter-connected and thus be better placed to work towards enabling greater spatial resilience through the rebalancing of use in urban centres. Given the dominance of shops, mapping and commentary is presented in the following sections, while mapping of food and drink outlets is reserved for the supplementary files. As detailed above, the three stages of the mapping process reveal, firstly, spatial patterns in the spread of shops and food and drink outlets and how these have shifted over the last two decades, visualised with directional ellipses for each city (Section 5.1 and, for shops, ); secondly, the geographic density of retail properties using Kernel Density mapping to provide a more detailed look at the scale of changes; and, thirdly, the dispersal of use and clusters of high and low values using Optimised Hotspot Analysis (OHSA). The second two stages are mapped together, for shops, in in Section 5.2.
Figure 1. Edinburgh: shop standard directional ellipses 2000–2017.
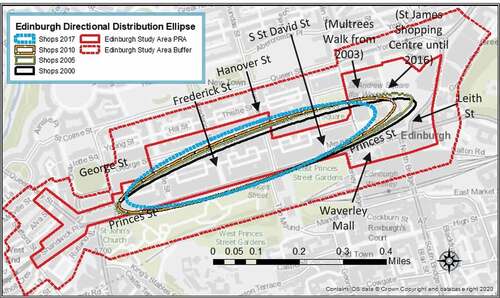
figure 2. Glasgow: shop standard directional ellipses 2000–2017.
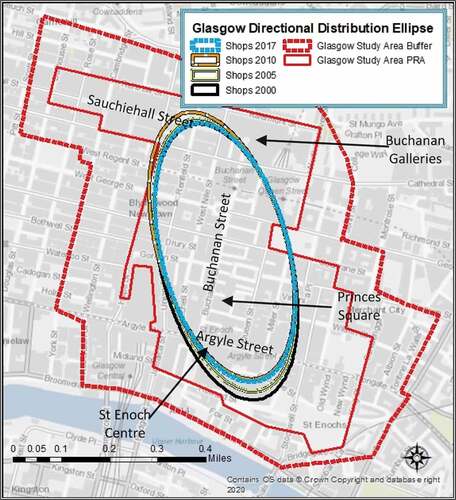
Figure 3. Nottingham: shop standard directional ellipses 2000–2017.
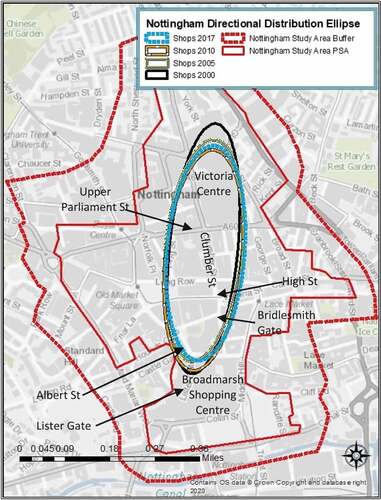
Figure 4. Hull: Shop standard directional ellipses 2000–2017.
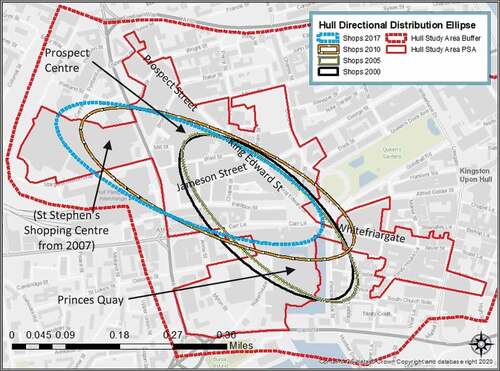
Figure 5. Liverpool: Shop standard directional ellipses 2000–2017.
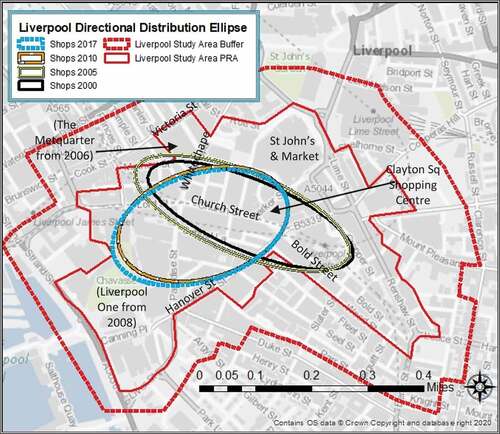
Figure 6. Spatial analysis of shops (weighted by Rateable Value per square ITZA) in Edinburgh’s PRA.
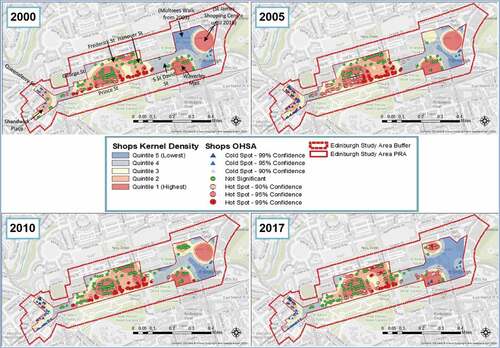
Figure 7. Spatial analysis of shops (weighted by Rateable Value per square ITZA) in Glasgow’s PRA.
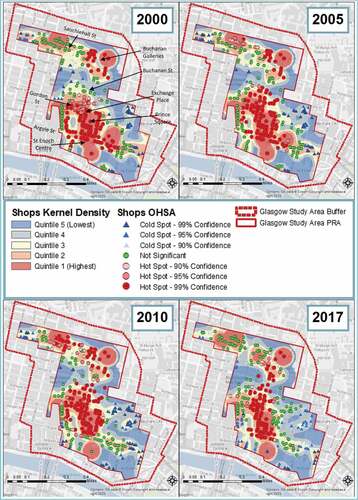
Figure 8. Spatial analysis of shops (weighted by Rateable Value per square ITZA) in Nottingham’s PSA.
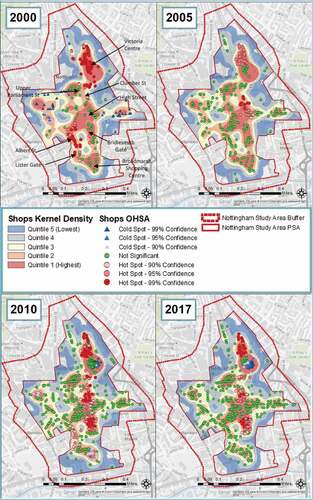
Figure 9. Spatial analysis of shops (weighted by Rateable Value per square ITZA) in Hull’s PSA.
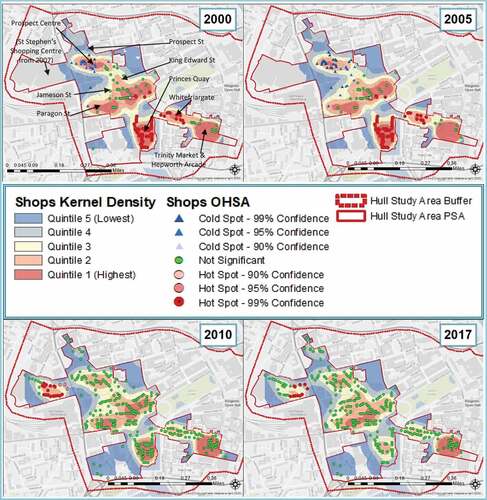
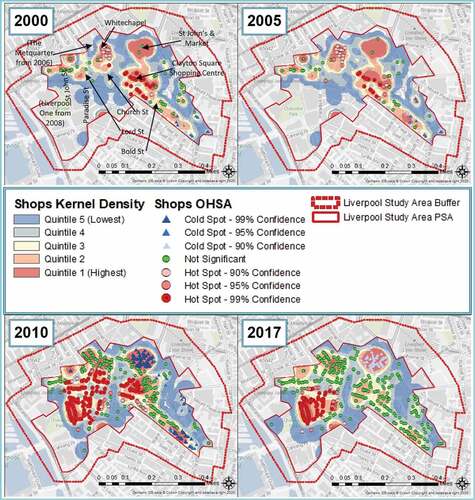
Figure 10. Spatial analysis of shops (weighted by Rateable Value per square ITZA) in Liverpool’s PSA.
5.1 Spatio-temporal patterns of change: directional ellipses
The stock of retail space grew significantly in the 1990s and 2000s but, as suggested by Crosby et al. (Citation2005) in their study of change in Reading, spatial externalities were masked by the concurrent growth in consumer spending and expansion in the retailing industry. With the subsequent and ongoing reduction in consumer spending in physical stores, the consequences are now seen through the rise in vacant retail units and the spatio-temporal patterns of these consequences are revealed here. The standard directional distribution ellipses (SDEs) presented in this section reveal shifts in the structure of the five case study markets. Overall, the retail core in all five case study cities has changed over the study period, either contracting or fundamentally altering in response to significant new development. These findings are presented for each case study city in turn.
The four SDEs for Edinburgh over the study period are shown in , as is the boundary of the PRA and buffer zone. It is clear that the core retailing area has shifted over the period 2000 (solid black) to 2017 (blue dashes). The traditionally long, linear prime area of Princes Street has contracted at the eastern and western ends, while simultaneously widening to increasingly capture the expansion of the retail market on to George Street, which runs parallel to the north. The contraction was greatest between 2010 (orange/white ring) and 2017 (ring in blue dashes), possibly reflecting the temporary removal of the St James Shopping Centre to the east of Princes Street from the active stock of retail units although it would not explain the contraction that also occurred in the west end.
Similar shifts are revealed for Glasgow and Nottingham (), with contractions or slight shifts at the peripheral edges. The centrality of these shopping districts has not changed. By contrast, in Hull () and Liverpool () there have been massive shifts in the centrality and shape of the retail markets. In Hull in 2000 and 2005 the distribution of the majority of shops extended from King Edward Street to the top of Whitefriargate, encompassing Princes Quay Shopping Centre, but the development of St Stephen’s Shopping Centre appears to have triggered a huge shift away from Whitefriargate and Princes Quay, and overall expansion of the retail core. Similarly in Liverpool, the shops were mainly distributed on Church Street and bottom end of Bold Street with shops on traditional primary frontages pulling the market along Whitechapel, towards Victoria Street in the early time points. However, the development of Liverpool One has shifted the central distribution of the entire retail market to the west, fundamentally reorientating it by almost 90 degrees.
The scale of change differs between the study areas, but even at the smaller end of the scale, the values of individual stock and streets have changed, revealing shifts in underlying market fundamentals. Such shifts are often also seen to ‘creep’ over time, be that in response to purposeful changes in planning policy,Footnote14 or more organic shifts in the fortunes of parts of the market. Revealing the progressive nature of such ‘creeping’ changes is important for key stakeholders.
5.2 Inter-urban spatial change: kernel densities and rental value hotspots
While directional ellipses are useful exploratory tools that reveal trends in the location of and distribution around the retail core, they give no guidance on the density or scale of change. Kernel Density mapping provides a more detailed look at the scale of change, while mapping the Optimised Hotspot Analysis (OHSA) shows the dispersal of use and clusters of high and low values when weighted by property value. The OHSA and Kernel Density heat maps are presented in .
Looking at Edinburgh in , as measured by the Kernel Density, the density of all types of shops increased between 2000 and 2005, intensifying between Princes Street and George Street to the north as areas in quintile 3 move to quintile 4, but this trend reverses between 2010 and 2017. Some of the changes coincide with non-chain retailers being drawn to George Street although this trend appears to have contracted in 2017. As Multrees Walk has become more established towards the eastern side of the PRA, the density of shops at the west end of Princes Street has decreased, as it has on Queensferry Street and Shandwick Place, the two streets converging at this point. It should be noted that the disruption of the tram construction between 2008 and 2012 contributed, at least in part, to the decline of comparison retailing around Shandwick Place.
This fall-off towards the western end of the PRA is evident in the OHSA, as also shown in , which illustrates that clusters of 99% and 95% significant high value retail units, once spread throughout the central part of Princes Street, have contracted markedly by 2017 becoming insignificant. In 2017 the high-value clusters tended to be situated between Frederick Street and South St David Street, suggesting that the prime retailing pitch, traditionally recognised as the majority of Princes Street, has contracted and shifted eastwards.
While the density of shops has increased towards the eastern end of central Princes Street, the density of food and drink (F&D) outlets (shown in the supplementary figures) has increased steadily throughout the area over the study period. This is especially marked in the western periphery, where the rise in vacancies seen in 2010 as retail contracted has been filled by F&D use. The densest area of F&D is highest behind Princes Street, expanding in the area between Frederick Street and Hanover Street. A further pocket of F&D has become established at the far eastern end of Princes Street, likely to be drawn there by a leisure and entertainment centre in the buffer zone at the eastern edge of the PRA.
Turning to Glasgow (see, ) the most marked change is the contraction of retail frontages along Argyll Street, running broadly east:west through the lower part of the PRA, seen in the change in quintiles in each successive period. There is a similar change on Sauchiehall Street, running broadly east:west through the top part of the PRA, but this is less marked and the fluctuations that can be seen are around the Sauchiehall Centre. Buchanan Street runs broadly north:south through the centre of the PRA, and is traditionally the core of the prime retail area. The cluster of rental hot spots remains focused around this street, albeit narrowing in 2017 but simultaneously pushing upwards from the central part of the street. At the very top of Buchanan Street there were high-value clusters up until the last period, when the only high-value clusters seen are in or close to Buchanan Galleries shopping mall. Overall, there is a marked contraction in retail provision and rental values seen clearly during the study period, most especially towards the latter part.
Food and drink outlets have seen huge change throughout the study period, and significant growth in coverage and density around the centre and top end of Buchanan Street (between Gordon Street/Exchange Place and Sauchiehall Street) during the latter half of the period. This was at the expense of the high-value F&D clustered at the eastern end of Sauchiehall Street in 2010 although the density of F&D has steadily increased here and replaced retail units further along Sauchiehall Street.
Little major retail development has taken place in Nottingham although the spread and concentration of retail outlets have contracted at the south end of Bridlesmith Gate with significant clusters of high-value units (as seen in ) located on Clumber Street between 2005 and 2017 and on Albert Street/Lister Gate in 2000 and 2010 although the densest pocket of retail throughout the study period is around the Upper Parliament Street/Clumber Street junction. Food and drink outlets steadily increased in the west of the PSA, accelerating in 2017 as shops contracted and vacancies increased.
The findings for Hull are presented in . As expected, following the reorientation of the ellipse seen in , there are marked shifts in density and value patterns. The main areas of change are that Princes Quay and the western half of Whitefriargate show fundamental change, with loss of retail density and value hotspots, parallel to an increase in the density of vacant units, following the opening of St Stephen’s shopping centre in the previously featureless area to the far west of the PSA. The marked change in value hotspots indicates a fundamental change in the location of the prime shopping area. There has also been contraction and loss of value in the central part of the PSA on and around King Edward Street, Jameson Street and Paragon Street, but slight increases in value hotspots, insofar as the cold spots have become neutral, along Prospect Street, which is closer to the new St Stephen’s shopping centre. There is a stubbornly dense pocket of retail units at the eastern end of Whitefriargate, in and around Trinity Market and Hepworth Arcade, which formed significant low value clusters in 2017. St Stephen’s shopping centre also contains food and drink outlets, and contributed to the steady rise and spread of food and drink operators within Hull. By 2017 these had spread throughout the PSA as shops were converted into alternative uses.
As revealed in Section 5.1, there has also been huge change in Liverpool over the study period and the details are shown in . At the start of the study period, the prime retailing area, in terms of both density and value, was in the central section of the PSA on Bold Street, Church Street, Whitechapel and to the north towards St John’s Shopping Centre. The development of Liverpool One has fundamentally shifted the market westward. All the high-value clusters in 2017 are situated in Lord Street, Paradise Street and South John Street which lie in the heart of Liverpool One. Significant low value clusters now exist in and around the St John’s Shopping Centre and Market, the most marked cold spots of any of the case studies. The effect of the large-scale development on the surrounding streets is absolutely clear.
Food and drink outlets have expanded into the gaps left by retail on Bold Street and around The Metquarter and, moreover, have expanded in spread and density throughout the PSA as shown in 2010 and 2017, albeit with fluctuations in value hot- and cold-spots.
Overall, it is clear that there are marked spatio-temporal patterns of change in land use and that there is spatial variability in these patterns within urban retailing systems. The extent of change in response to large-scale retail development is significant and fundamentally alters the city centre. Perhaps the most consistent pattern of change is the dispersed increase in the number of food and drink businesses, often occupying previous retail spaces. This detailed analysis allows exploration of the micro-level dynamics of land use change over time, revealing spatial impacts on established trading areas. The consequences of such changes are drawn out in the final section, below, highlighting the importance of such analysis for key stakeholders.
6. Discussion, conclusions and recommendations
This empirical study reveals the spatial adaptations taking place within urban retailing centres. The main findings are summarised here and the consequences and conclusions drawn out. The aim is to provide the evidence base for understanding the spatial impacts of change, so that key stakeholders are better able to understand and anticipate the consequences of change.
Overall, it is clear that all five retailing centres have self-organising adaptive capacities,Footnote15 anticipating or reacting to socio-economic change, evolving at differential rates, those characteristics identified at the inter-urban scale by Wrigley and Dolega (Citation2011). Thus, this analysis of intra-urban variations has identified the creation of new configurations, interdependences and further heterogeneity in response to both wide-scale socio-economic and behavioural change as well as more localised endogenous shocks. The centres have all experienced a contraction in the number of retail units, although this is more associated with recent structural changes, the decline of retail and rise in heterogeneityFootnote16 appears to have started in the wake of the 2008 Great Financial Crisis. In markets where there has been an injection of new space, the reduction in the number of occupied retail units was delayed, evidencing Capello et al.’s (Citation2015) notion that the more diverse an urban economy, the higher its resilience to economic change. In those areas where there have not been significant injections of new space, the result has been store closures, the introduction of independent and low-cost retailers, and changes in use on the periphery of the prime retailing area, effectively contracting the prime retailing clusters. Change of use has also led to more dispersed food and drink outlets in the secondary retailing pitch. However, it is evident that those urban centres where new development of sizeable scale has occurred alongside the general ongoing socio-economic disturbances, a hugely fundamental shift in the prime retail pitch has taken place, supporting the hypothesis that underpins this study. It is known that prime and secondary pitches are not fixed, and this is evidenced here by the expansions and contractions at the periphery over time, but the scale of change in markets where there has been significant retail redevelopment, is significant and the centrality of retail activity clustered on the prime pitch has entirely altered.
These new supply shocks, usually in the form of in-town shopping centres, affect shopping preferences and behaviours in a variety of ways, such as competition effects where more attractive or novel tenant mixes pull shoppers away from where they previously shopped; or by enticing retailers to relocate into newer purpose-built space; or a combination of these effects. Thus, recognising the retail market as a complex system with adaptive resilience as promoted by Dolega and Celińska-Janowicz (Citation2015), as actors exercise their social agency to anticipate, evolve and adapt to such endogenous and exogenous shocks which effect retail profitability, the outcome is an increase in voids and reduction in the attractiveness of the streets retailers vacated. This is akin to the spatial changes Guy (Citation1999) described when out-of-town superstores and regional centres are developed and the evidence presented here is that new developments can lead to intra-urban micro-level spatial effects that often are not anticipated. As predicted by Crosby et al. (Citation2005), structural changes in trading patterns, masked previously by rising in-store consumer spending and buoyancy of occupation demand from retailers, are now visible as the retail sector and consumer spending have contracted. Less profitable retailing areas now no longer within the prime retailing cluster are characterised by increases in vacancies and falls in rents, very clear consequences revealed by the analysis, as perceptions change and they are no longer seen as the most attractive in terms of tenant mix, or walkability as signs of blight materialise.
Looking at the issue of supply shocks in urban retailing centres through the lens of adaptive capacity remains pertinent, even though this study focuses on how urban retailing centres spatially evolved before the pandemic. In Edinburgh, the dramatic rise in vacancy rates and proposed hospitality and leisure conversions on Princes Street after the opening of St James Quarter in 2021 suggest the prime retail pitch continued to move eastwards while the supply shocks experienced in other centres have potential to further effect the prime retail pitches. In Glasgow and Nottingham, the proposed replacement of in-town shopping centres with mixed-use neighbourhoods and public realm improvements could, at least in theory, further change pedestrian flows on the prime retail pitch.Footnote17 Other adaptations experienced in urban retailing centres, accelerated by the pandemic, include radical alterations to the leasing model (Orr et al., Citation2022a), the repurposing of redundant large format stores into leisure, entertainment and residential uses, and continued growth in independent retailers and operators (Orr et al., Citation2022c). Changes, made possible by the fall in retail market rents and rise in redundant space, which continue to increase the diversity of city centres, and their attractive pull to day- and night-time visitors.
The findings in this study not only have implications for property owners and the risks attached to their investments by providing investors with tested methods that can be used to support anecdotal observations of market change, but also have relevance for town centre management policy. Many of the use changes identified are necessary in the evolution of city centres, and will continue as areas adapt from retailing centres into the more integrated commercial and leisure hubs required of today’s cities. However, for those areas, streets and properties experiencing decline as a result, as shoppers and retailers relocate, store refurbishments are halted, and vitality and vibrancy decrease as there is a downwards trajectory of decline and movement towards Berry’s (Citation1963) end of a centre’s life cycle, public sector investment in urban renewal is often required to stem and reverse the spread of blight. Thus, in terms of the spatial effects revealed here, the findings highlight the need for greater consideration to be given by planning and economic development professionals with regard to the micro-level effects of new development and use changes on the market dynamics of the surrounding retailing area. The vacancies and falls in value that are seen to result have both an immediate impact on vibrancy and vitality, but can also trigger longer term ‘creeping’ decline.
The consequences of the Use Class Order 2020 introduced in England that remove the protection granted to retail use on the prime pitch are yet to work their way through the retailing system and it remains unclear whether its aim, to promote flexibility within the High Street by permitting more types of use changes without the need for planning permission, will be achieved and whether there will be unintended outcomes. It may help reduce the oversupply of surplus retail space, but the changes of use need to be monitored to ensure the repurposing of redundant retail space, particularly at ground floor level, does not have unintended spatial impacts on established uses within retailing streets. This may include the creation of dead frontages that dissect active frontages, altering the visual streetscape and creating a sub-conscious barrier to previous patterns of footfall, redirecting day- and night-time pedestrian flows and reducing the vibrancy of the immediate area.
The spread of food and drink outlets amongst retailing, similar to the change identified by Greenhalgh et al. (Citation2020) in York, suggests that centres are diversifying, but there is the potential for reduced shop localisation economies to increase the complexity of managing and improving urban retail centres. This is likely to compound the difficulties presented by the increased heterogeneity and fragmentation of ownership in city centres revealed by Orr et al. (Citation2022b), that similarly present challenges for management and overarching stewardship. Subsequently, city centre retail areas may benefit from masterplans to create a shared vision for reimagining and integrating retailing streets, and to co-ordinate private- and public-sector stakeholders to work in partnership to create vibrant, unique places that improve the overall quality of city centres. The master-planning of future development and land use change also needs to give more consideration to how users engage with different land uses and locations to better understand intra-urban movement flows.Footnote18 This is akin to the micro-management undertaken by shopping mall managers with respect to retail mix and mall layout, increasingly through monitoring the flow of users via phone signal tracking. Such insights will enable policy-makers to better see the interdependencies between different uses and areas within the city centre. Such insights would enable anticipation of the type of changes revealed in this paper, enabling urban professional stakeholder groups to improve connectivity and better exploit the desirable co-location of uses while minimising unwanted competitive effects, recognising the core area of cities as dynamic retailing systems.
Revised_Supplementary_File_18-10-22.docx
Download MS Word (9.1 MB)Acknowledgments
The authors are grateful to the data service at the Urban Big Data Centre (UBDC), University of Glasgow for providing access to data.
Disclosure statement
No potential conflict of interest was reported by the author(s).
Supplementary material
Supplemental data for this article can be accessed online at https://doi.org/10.1080/09599916.2022.2141133
Correction Statement
This article has been corrected with minor changes. These changes do not impact the academic content of the article.
Additional information
Funding
Notes on contributors
Allison M Orr
Allison M Orr joined Urban Studies at the University of Glasgow in June 2006 as a real estate senior lecturer. She has extensive experience modelling the pricing of commercial and residential property markets, and researching the inter-linkages between urban change, urban development and adaptation in the investment and occupation sectors of the property market.
Joanna L Stewart
Joanna L Stewart is a lecturer based in Urban Studies, University of Glasgow. Her research interests draw from a range of academic disciplines including geography, spatial analysis, planning, retailing, transport, health and wellbeing.
Cath C Jackson
Cath C Jackson is a senior lecturer in the Department of Urban Studies and Planning, University of Sheffield. Her research explores investment decision-making at stock and local market levels, with particular interest in retailing markets and how stakeholders and the policy environment impact on town centre promotion and management.
James T White
James T White is a professor of planning and urban design at University of Glasgow. He is a Chartered Town Planner and a Member of the Urban Design Group. His research focuses on spatial planning tools and mechanisms, and how flexibility and innovation in design can be embraced to enhance the design quality of real estate development and build resilience into urban placemaking.
Notes
1. The prime retail pitch represents the best location within a retailing centre that attracts the greatest pedestrian footfall and traditionally tenants with strong financial covenants on the best least terms. Super-prime retail is a term increasingly used to refer to the shops that command the highest rents on the prime retail pitch.
2. These are not the only concepts that explain the location of retailers. Bid rent theory (Haig, Citation1926; Alonso,Citation1964) and Hotelling’s principle of minimum differentiation (Hotelling, Citation1929) are examples of concepts that help explain the clustering of retailers within the centre of settlements. See, Brown (Citation1993) for a detailed discussion on the development of retail location theory.
3. Investor perceptions around covenant strength have drastically changed in recent years with the differentiation between retailers that locate on and off the prime retail pitch becoming increasingly blurred. This includes a growing number of independent retailers now locating on or close to the prime pitch as demand has fallen from multiple retailers and lease terms have become more flexible (Orr et al., Citation2022a).
4. Department stores have struggled to embrace online retailing and compete with omni-channel retailers in recent years. This has led to the closure of some of the biggest department stores in the UK since the Global Financial Crisis (Centre for Retail Research, Citation2022).
5. All five centres sit at the top of their local retail hierarchy. Glasgow and Nottingham had a relatively stable supply of retail floorspace during the study period while substantial development activity in Liverpool has resulted in it now being the largest of the five centres. Edinburgh and Hull, the two smallest centres, have approximately the same amount of retail floorspace and experienced extensive retail development activity between 2000 and 2010 (Citation2021). A detailed rationale for the case study selection is set out in Orr et al. (Citation2021).
6. Thurstain-Goodwin et al. (Citation2002) highlight alternative ways to define a retailing centre. In their London based pilot study, they adopt the broader definition of town centre activity. This work identified town centres for statistical purposes using density contours estimated from turnover, employee jobs and floorspace statistics disaggregated to unit postcode level. More recently, ONS and Ordnance Survey (2019 and 2020) defined high streets based on clusters of at least 15 roadside retail properties, no further apart than 150 m. As this study is interested in the retail core, narrower in definition to the wider town centre but wider than just the main retail cluster, it was agreed, in consultation with the Project Steering Group, to focus on the policy defined areas.
7. The distance of an appropriate buffer zone depends on the geographical feature being analysed. For instance, Li et al. (Citation2010) used buffer analysis to examine the urban expansion of Shanghai, and found the size of the urban settlement influences the buffer width. Fang et al. (Citation2021) found 100 m buffers around major roads capture the majority of large retail developments in Nanjing while other studies (for example, Ko & Jeong, Citation2007) advocate variable buffers as they are better at representing the ‘walkable’ catchment area of a urban feature than simple fixed distance buffer zones.
8. The databases also contain data on ownership but is not used to determine the property use which is the focus of this paper. A breakdown of the ownership of the data is presented in Orr et al. (Citation2022b).
9. A description of the use of every property is provided in the VOA/SAA datasets, and it is the legally recognised use that is used by assessors to determine the property’s rateable value. This is checked against the use categories defined in the Experian Goad and Local Data Company datasets, and visual inspection of the building frontages in time dated google maps. If data is missing or conflicting for a property then the use is categorised as unknown, although the combination of data sources ensures close to 100% coverage of known use in the ground floor properties within the main retail clusters within the city centres.
10. Not every property had rateable value data (See Table SF1 in the supplementary file) so the tests were repeated with unweighted data. Similar results were found but are not reported here.
11. This is an optional variable that can be used to weight the count data. If not included, as in this study because the focus was on the density of specific property uses, only distance is used to weight the count data.
12. Rateable values determine the local property tax liability of the occupier. The rateable values used for the shop analysis was the rateable value per metre in terms of Zone A. Zoning is a measurement methodology used in the UK to compare shops of different sizes and layouts, and used in the valuation of retail units.
13. Rateable values and rateable values per metre in terms of Zone A were missing from some properties. This was greatest in the earlier years. If this was to effect the OHSA analysis it would result in a reduction in the hot and cold spots identified in the earlier year but the inverse is found. The unweighted KDE is mapped against the OHSA analysis as a cross-check as they also show changes in the density of shops.
14. City Plans are developed in consultation with stakeholders every 5 years but adoption can take up to 24 months. They provide a degree of certainty on individual planning applications decisions.
15. Business Improvement Districts (BIDs), present in HullBID; Nottingham City Centre Alliance BID; Liverpool Retail and Leisure BID; and Essential Edinburgh BID, play a role in the strategic self-organising capacity of four cities as they are involved in place-making improvements, and the marketing and promotion of these retail centres. Glasgow City Centre Retail Association is another business-led association which works in partnership with public-sector bodies to market, promote and support local retailers. Yet, more can be done to engage the growing number of smaller landowners in urban centres (Orr et al., Citation2022b).
16. The rise in heterogeneity has not only been experienced in terms of more diverse property uses but includes greater variation in how retailers are using their retail space. For instance, many retailers no longer require storage and auxiliary space, in the past on upper floors, due to more frequent stock deliveries and servicing customer needs from warehouse location. Some retailers, a trend that became more common during the pandemic, use sales floor stock to service online orders while other retailers use their physical stores as showrooms. There are also examples of retail brands sharing space with other brands to cut occupation costs, and retailers developing their in-store experiential offering to shoppers (White et al., Citation2022).
17. The completion of the demolition of Broadmarsh Shopping Centre, Nottingham in 2022 is an example of this. Plans also exist in Glasgow to demolish Buchanan Galleries and redevelop the St Enoch Centre, both shopping centres that bookend the prime retail pitch. Examples outside the case study centres exist where local authorities have acquired key retail and high street assets to take control of how they are repurposed, include the purchase and demolition of the Castlegate Shopping Centre in Stockton-on-Tees to create an urban park.
18. This includes micro-planning the co-location of new residential accommodation with bars, night-clubs and other night-time economy uses to minimise the tensions and conflict that can emerge between these property uses.
References
- Alonso, W. (1964). Location and land use. toward a general theory of land rent. Harvard University Press.
- Anderson, T. K. (2009). Kernel density estimation and K-means clustering to profile road accident hotspots. Accident Analysis & Prevention, 41(3), 359–364. https://doi.org/10.1016/j.aap.2008.12.014
- Bailey, T. C., & Gatrell, A. C. (1995). Interactive spatial data analysis (Vol. 413). Longman Scientific & Technical.
- Benjamin, J. D., Boyle, G. W., & Sirmans, C. (1992). Price discrimination in shopping center leases. Journal of Urban Economics, 32(3), 299–317. https://doi.org/10.1016/0094-1190(92)90020-L
- Berry, B. J. L. (1963). Commercial structure and commercial blight. Department of Geography, Research Paper 85. University of Chicago.
- Borchert, J. G. (1998). Spatial dynamics of retail structure and the venerable retail hierarchy. GeoJournal, 45(4), 327–336. https://doi.org/10.1023/A:1006976407047
- Brown, S. (1987). A perceptual approach to retail agglomeration. Area, 19(2), 131–140. https://www.jstor.org/stable/i20002431
- Brown, S. (1989). Retail location theory: The legacy of Harold Hotelling. Journal of Retailing, 64(4), 450–470 https://link.gale.com/apps/doc/A8193466/AONE?u=gogglescholar&sid=googleScholar&xid=0564b6ef.
- Brown, S. (1992). Retail location: A micro-scale perspective. Avebury.
- Brown, S. (1993). Retail location theory: Evolution and evaluation. The International Review of Retail, Distribution and Consumer Research, 3(2), 185–229. https://doi.org/10.1080/09593969300000014
- Brown, M. G. (1999). Design and value: Spatial form and the economic failure of a mall. Journal of Real Estate Research, 17(1/2), 189–226. https://doi.org/10.1080/10835547.1999.12090970
- Brueckner, J. (1993). Inter-store externalities and space allocation in shopping-centers. Journal of Real Estate Finance & Economics, 7(1), 5–16. https://doi.org/10.1007/BF01096932
- Capello, R., Caragliuy, A., & Fratesi, U. (2015). Spatial heterogeneity in the costs of the economic crisis in Europe: Are cities sources of regional resilience? Journal of Economic Geography, 15(5), 951–972. https://doi.org/10.1093/jeg/lbu053
- Carmona, M. (2021). The existential crisis of traditional shopping streets: the sun model and the place attraction pardigm. Journal of Urban Design. Early Online Publication. 1–35. https://doi.org/10.1080/13574809.2021.1951605
- CBRE. (2018). Weathering the perfect storm in UK retail real estate.
- Centre for Retail Research. (2022). Who’s gone bust in retail? “ See.“ https://www.retailresearch.org/whos-gone-bust-retail.html.
- Chainey, S., Tompson, L., & Uhlig, S. (2008). The utility of hotspot mapping for predicting spatial patterns of crime. Security Journal, 21(1–2), 4–28. https://doi.org/10.1057/palgrave.sj.8350066
- Christaller, W. (1933). Central Places in Southern Germany. ( translated by.) C. Baskin 1966. Prentice-Hall, Englewood Cliffs.
- Clapp, J. M., Ross, S. L., & Zhou, T. (2019). Retail agglomeration and competition externalities: Evidence from openings and closings of multiline department stores in the US. Journal of Business and Economic Studies, 37(1), 81–96. https://doi.org/10.1080/07350015.2016.1272460
- Crosby, N., Hughes, C., Lizieri, C., & Oughton, M. (2005). A message from the oracle: The land use impact of a major in-town shopping centre on local retailing. Journal of Property Research, 22(2–3), 245–265. https://doi.org/10.1080/09599910500453848
- Dolega, L., & Celińska-Janowicz, D. (2015). Retail resilience: A theoretical framework for understanding town centre dynamics. Studia Regionalne i Lokalne, 60, 8–31. https://mpra.ub.uni-muenchen.de/72319/
- Fang, Y., Mao, J., Liu, Q., & Huang, J. (2021). Exploratory space data analysis of spatial patterns of large-scale retail commercial facilities: The case of Gulou District, Nanjing, China. Frontiers of Architectural Research, 10(1), 17–32. https://doi.org/10.1016/j.foar.2020.02.002
- Fotheringham, A., Brunsdon, C., & Charlton, M. (2000). Quantitative geography: Perspectives on spatial data analysis. SAGE Publications.
- Fotheringham, A. S., & Rogerson, P. A. (1993). GIS and spatial analytical problems. International Journal Geographical Information Systems, 7(1), 3–19. https://doi.org/10.1080/02693799308901936
- Frodsham, M. (2016). Defining Investment Quality. Short Paper 29, January 2016. IPF.
- Greenhalgh, P., King, H., Muldoon-Smith, K., Adebayo, A., & Ellis, J. (2020). Using GIS to explore the potential of business rating data to analyse stock and value change for land administration: A case study of York. ISPRS International Journal of Geo-Information, 9(5), 321–344. https://doi.org/10.3390/ijgi9050321
- Grimsey, B., Hopkinson, M., Hood, N., Pascoe, E., Shellard, C., Sadek, J., Cassidy, K., Dehullu, V., & Baker, M. (2018). In S. Crozier (Ed.), The Grimsey Review 2. vanishinghighstreet.com. http://www.vanishinghighstreet.com/wp-contents-uploads/2018/07/GrimseyReview2.pdf
- Grimsey, B., Turner-Mitchell, Shellard, C., Pascoe, E., Baker, M., Vasili, S., Hopkinson, M., Hood, N., & Sadek, J. (2013). The grimsey review: An alternative future for the high street. vanishinghighstreet.com. http://www.vanishinghighstreet.com/wp-contents/uploads/2016/03/GrimseyReview04.092.pdf
- Guy, C. M. (1998). Controlling new retail spaces: The impress of planning policies in Western Europe. Urban Studies, 35(5–6), 953–979. https://doi.org/10.1080/0042098984637
- Guy, C. M. (1999). Retail location analysis. In M. Pacione (Ed.), Applied geography: principles and practises (pp. 450–462). Routledge.
- Guy, C. (2007). Planning for retail development: a critical view of the British experience. Routledge.
- Guy, C. (2008). Assessing the competition. Town and Country Planning, 77, 14–16.
- Haig, R. M. (1926). Toward an understanding of the metropolis: 11. the assignment of activities to areas in urban regions. Quarterly Journal of Economics, 40(May), 402–434. https://doi.org/10.2307/1885172
- Heidenreich, N., Schindler, A., & Sperlich, S. (2013). Bandwidth selection for kernel density estimation: A review of fully automatic selectors. ASTA Advances in Statistical Analysis, 97(4), 403–433. https://doi.org/10.1007/s10182-013-0216-y
- Hotelling, H. (1929). Stability in Competition. The Economic Journal, 39(153), 41–57. https://doi.org/10.2307/2224214
- Jones, C., & Livingstone, N. (2017). Emerging implications of online retailing for real estate. Twenty-first century clicks and bricks. Journal of Corporate Real Estate, 17(3), 226–239. https://doi.org/10.1108/JCRE-12-2014-0033
- Kärrholm, M., Nylund, K., & Prieto de la Fuente, P. (2014). Spatial resilience and urban planning: Addressing the interdependence of urban retail areas. Cities, 36, 121. https://doi.org/10.1016/j.cities.2012.10.012
- Ko, K., & Jeong, S. (2007). Assessing the spatial distribution of urban parks using GIS. Landscape and Urban Planning, 82(1/2), 25–32. https://doi.org/10.1016/j.landurbplan.2007.01.014
- Kok, H. J. (2007). Restructuring retail property markets in Central Europe: Impacts on urban space. Journal of Housing and the Built Environment, 22, 107–126. https://doi.org/10.1007/s10901-006-9068-z
- Konishi, H. (2005). Concentration of competing retail stores. Journal of Urban Economics, 58, 488–512. https://doi.org/10.1016/j.jue.2005.08.005
- Lamberton Smith Hampton and Revo. (2022). How can we deliver the recovery and renaissance of our towns. High Streets & Shopping Centres?.
- Lim, L. C., Berry, J., & Sieraki, K. (2013). Prime versus secondary real estate: When to buy and sell. Journal of Property Investment & Finance, 31(3), 254–266. https://doi.org/10.1108/14635781311322229
- Li, X., Zhang, L., & Liang, C. (2010). A GIS-based buffer gradient analysis on spatiotemporal dynamics of urban expansion in Shanghai and its major satellite cities. Procedia Environmental Sciences, 2, 1139–1156. https://doi.org/10.1016/j.proenv.2010.10.123
- Local Data Company. (2022). In GB Retail and Leisure Market Analysis. Full Year 2021. Local Data company.
- Martin, R., & Sunley, P. (2015). On the notion of regional economic resilience: Conceptualization and explanation. Journal of Economic Geography, 15(1), 1–42. https://doi.org/10.1093/jeg/lbu015
- Mitchell, A. (2009). The ESRI guide to GIS analysis, volume 2: Spatial measurements and statistics (First e-book) ed.). ESRI Press.
- Nanda, A., Xu, Y., & Zhang, F. (2021). How would the COVID-19 pandemic reshape retail real estate and high streets through acceleration of E-commerce and digitalization? Journal of Urban Management, 10(2), 110–214. https://doi.org/10.1016/j.jum.2021.04.001
- Nyström, M., & Folke, C. (2001). Spatial resilience of coral reefs. Ecosystems, 4(5), 406–417. https://doi.org/10.1007/s10021-001-0019-y
- Office of Deputy Prime Minister. (1996). PPG 6: Town centres and retail development. ODPM. June 1996
- Office of National Statistics and Ordnance Survey. (2019). High Streets in Great Britain. Office of National Statistics.
- Office of National Statistics and Ordnance Survey. (2020). High Streets in Great Britain: March, 2020. Office of National Statistics.
- Ordinance Survey. (2018). AddressBase Premium - Technical Specification. version 2.5
- Orr, A. M., Gardner, A., Jackson, C., & White, J. T. (2022a). Changing tenant covenant perceptions and flexibility in the lease model in UK city centres. Journal of Property Research, 1–24. Early Online Publication. https://doi.org/10.1080/09599916.2022.2057866
- Orr, A. M., Jackson, C., White, J. T., & Stewart, J. L. (2021). REPAIR case study cities: Selection rationale and context. REPAIR Working Paper. University of Glasgow.
- Orr, A. M., & Stewart, J. L. (2021). Classifying property use and ownership. REPAIR Working Paper. University of Glasgow.
- Orr, A. M., Stewart, J., & Gardner, A. (2022c). City centre real estate markets: Changing retail practice and adaptation, 2020-2021 (p. 10.5255/UKDA-SN-855943). UK Data Service. Data Collection].
- Orr, A. M., Stewart, J. L., Jackson, C., & White, J. T. (2022b). Ownership diversity and fragmentation: a barrier to urban centre resilience. Environment and Planning B: Urban Analytics and City Science. Early Online Publication. https://doi.org/10.1177/23998083221124600
- PMA(2021). UK Retail Historic Time Series Data: Edinburgh, Glasgow, Hull, Liverpool and Nottingham. Property Market Analysis.
- Portas, M. (2011). The portas review: An independent review into the future of our high streets. Department for Business, Innovation and Skills.
- Porta, S., Strano, E., Iacoviello, V., Messora, R., Latora, V., Cardillo, A., Wang, F., & Scellato, S. (2009). Street centrality and densities of retail and services in Bologna, Italy. Environment and Planning. B, Planning & Design, 36(3), 450–465. https://doi.org/10.1068/b34098
- Reilly, W. J. (1929). Methods for the study of retail relationships. University of Texas Bulletin.
- Reilly, W. J. (1931). The Law of Gravitation. Knickerbocker Press.
- Reimers V and Clulow V. (2004). Retail concentration: a comparison of spatial convenience in shopping strips and shopping centres. Journal of Retailing and Consumer Services, 11(4), 207–221. https://doi.org/10.1016/S0969-6989(03)00038-9
- Savills. (2021) Retail and leisure insolvency activity, UK Retail Outlook Report – 2021,
- Scottish Office. (1998). NPPG 8: Town centres and retailing. October 1998.
- Sevtsuk, A. (2014). Location and agglomeration: The distribution of retail and food businesses in dense urban environments. Journal of Planning Education and Research, 34(4), 374–393. https://doi.org/10.1177/0739456X14550401
- Silverman, B. (1986). Density estimation for statistics and data analysis. Chapman and Hall.
- Songchitruksa, P., & Zeng, X. (2010). Getis-Ord spatial statistics to identify hot spots by using incident management data. Transportation Research Record Journal of Transportation Research Board, 2165(1), 42–51. https://doi.org/10.3141/2165-05
- Stahl, K. (1982). Location and spatial pricing theory with nonconvex transportation cost schedules. The Bell Journal of Economics, 13(2), 575–582. https://doi.org/10.2307/3003478
- Teale, M. (2012). The challenges of attracting investment back to the High Street. Journal of Urban Regeneration and Renewal, 6(2), 154–163.
- Thurstain-Goodwin, M., Haklay, M., Lloyd, D., Batty, M., Boott, R., Hyman, A., Batty, S., Tomalin, C., Sheppard, S., Curtis, S., Cardell, C., & Falk, N. (2002) Producing boundaries and statistics for town centres; London Pilot Study Technical Report; ODPM and Centre for Advanced Spatial Analysis UCL.
- White, J. T., Hickie, J., Richardson, R., Jackson, C., & Orr, A. M. (2022) The experience economy in UK city centres: A multidimensional and interconnected response to the “death of the high street”?, REPAIR Working Paper. University of Glasgow.
- Wrigley, N., & Dolega, L. (2011). Resilience, fragility, and adaptation: New evidence on the performance of UK high streets during global economic crisis and its policy implications. Environment & Planning A, 43(10), 2337–2363. https://doi.org/10.1068/a44270
- Yang, J., Zhu, J., Sun, Y., & Zhao, J. (2019). Delimitating urban commercial central districts by combining Kernel density Estimate and road intersections: A case study in Nanjing City, China. ISPRS International Journal of Geo-information, 8(2), 93–117. https://doi.org/10.3390/ijgi8020093
- Zhou, T., & Clapp, J. M. (2015). The location of new anchor stores within metropolitan areas. Regional Science and Urban Economics, 50, 87–107. https://doi.org/10.1016/j.regsciurbeco.2014.11.003