
Abstract
Sugar sweetened beverages (SSB), artificially sweetened beverages (ASB), juice, coffee and tea has been associated with risk of metabolic disease. High consumption of these beverages may be associated with certain characteristics of the overall diet that would be important to take into account when analysing beverage-disease associations. Here, we investigate five beverages and their association with lifestyle and diet in 25,112 individuals from the Malmö Diet and Cancer Cohort. We observed that high consumption of SSB was associated with lower intakes of foods perceived as healthy. However, high consumption of both tea and juice was associated with higher intakes of foods perceived as healthy. Further, high consumption of ASB was associated with higher intakes of low-fat products. High consumption of coffee was associated with higher intakes of meat and high-fat margarine, and lower intake of breakfast cereals. We observe five beverages to associate with different lifestyle and dietary patterns.
Introduction
Dietary habits have, in large parts of the world, changed over the last decades towards higher intakes of processed and energy rich foods, including beverages (Fagherazzi et al. Citation2013). In parallel with this, obesity and other metabolic diseases have increased globally. However, beverages are part of overall dietary patterns and in order to explore the role of single beverages per se in disease development, it is essential to understand how beverage intakes relate to other diet and lifestyle characteristics.
Lately great attention has been given to health aspects of beverage consumption and many studies have investigated specific beverages and their associations with disease. Several studies have found consistent associations between specific beverages and metabolic disease (Fagherazzi et al. Citation2013; Ding et al. Citation2014; Larsson et al. Citation2014; Vuong Citation2014). These findings may have great public health relevance since the consumption of several beverages has increased, especially consumption of sugar-sweetened beverages (SSB) (Nielsen and Popkin Citation2004; Malik et al. Citation2013), which have been linked to increased risk of obesity, diabetes and CVD in the cohort assessed in this study (Brunkwall et al. Citation2016; Ericson Citation2017) as well as in other populations (Hu and Malik Citation2010; Malik et al. Citation2010; Larsson et al. Citation2014). In contrast juice, which contains the same amount of energy as SSB, has not been associated with increased risk of metabolic diseases (O'Neil et al. Citation2012; Fagherazzi et al. Citation2013). There are a number of factors that may have influenced observed associations such as collinearity and adjustments for dietary factors containing measurement errors (Willett Citation2012; Maki et al. Citation2014). Knowledge about correlations between food intakes in a population is of great concern for accurate adjustment and interpretation of results, as collinearity makes it difficult to link observed associations to a specific food of interest (Tarasuk and Brooker Citation1997). Our diet consists of foods and beverages, consumed separately or in different combinations, and the patterns may vary depending on factors such as geography, culture and socioeconomic status (Manjer et al. Citation2001). Some studies have examined the covariance between foods and beverages; consumption of pure orange juice has for example been associated with a higher overall diet quality (Crowe-White et al. Citation2016; Rampersaud and Valim Citation2017), whereas consumption of artificially sweetened beverages (ASB) has been associated with lower diet quality and dieting (Vagstrand et al. Citation2009; Piernas et al. Citation2014; Barnes et al. Citation2015). Even though dietary patterns may be more powerful in predicting disease risk it is of interest to investigate single foods or beverages since specific components in a pattern may drive observed disease associations (Wirfalt et al. Citation2013). However, it is important to identify potential confounders to avoid misleading conclusions.
As beverages are a part of our diet and overall lifestyle, we hypothesised that the level of consumption may be associated with certain diet and lifestyle characteristics of particular importance for the interpretation of beverage-disease associations. Therefor we set out to systematically investigate whether diet and lifestyle characteristics are associated with intake levels of SSB, ASB, juice, coffee and tea in the Malmö Diet and Cancer cohort.
Method
Study participants and data collection
The Malmö Diet and Cancer Study (MDCS) is a prospective cohort study that was conducted in the city of Malmö in Sweden (Manjer et al. Citation2001). All men born between 1923 and 1945 and all women born between 1923 and 1950 in Malmö were invited via personal letters and advertisements in the local newspaper and public places during the baseline examination conducted 1991–1996. Their age at baseline was between 44 and 74 years of age. The only exclusion criteria were mental incapacity and inadequate Swedish language skills. In total, 28,098 individuals (17,035 women and 11,063 men) provided complete dietary information and anthropometric measures, representing about 40% of the eligible individuals. All participants visited the research clinic on two occasions about 10 days apart. On the first visit, they received detailed instructions and information about the study, and the study material was given to them. They were all asked to fill in a menu booklet and two questionnaires: one with questions about their food habits and one with questions concerning lifestyle and socioeconomic aspects. At the first visit, nurses also drew blood and anthropometrical measures were taken. On the second visit, the participants were interviewed by trained staff to complete the dietary history and to check the completeness of the lifestyle questionnaire. All individuals provided a written informed consent, and the ethics committee of Lund University approved the MDCS protocols.
In the present study, we included all individuals with complete dietary data without any history of cancer, diabetes or CVD at the time of the baseline examinations (n = 25,112, of which 15,312 were women).
Dietary data
MDCS used a modified interview-based diet history method specially designed for the study which included; (1) a 7-day menu book for recording of cooked meals and cold beverages; (2) a 168-item questionnaire for assessment of intake frequencies and portion sizes of regularly consumed foods, including hot beverages, which were not covered by the menu book; and (3) a 45-min interview including more questions about cooking methods and food choices. The interviewer also very carefully controlled that information from the questionnaire and the 7-day menu book did not overlap. The relative validity of food and nutrient intakes was in general high (i.e. Pearson correlation coefficients >0.6) (Elmstahl et al. Citation1996; Riboli et al. Citation1997). The average daily food intake (g/day) was calculated based on the questionnaire and the 7-day menu book. To convert the food intake into energy and nutrient information, the MDCS food database was used. The majority of the nutrient information in the MDCS database was from the PCKOST2-93 from the National Food Administration in Uppsala, Sweden. A variable was created for the season of data collection; winter (December–February), spring (March–May), summer (June–August), and fall (September–November). The processing of data was slightly altered in September 1994, and the method version variable indicates if the data were collected before or after the 1 September 1994.
Dietary variables
The dietary variables examined in this study were SSB, ASB, juice, coffee and tea (g/MJ), 24 food groups (g/MJ) representing the overall diet, macronutrients [energy percentage (E%)], fibre (g/MJ) and alcohol (g/MJ) (). The variables were adjusted for non-alcohol energy if applicable.
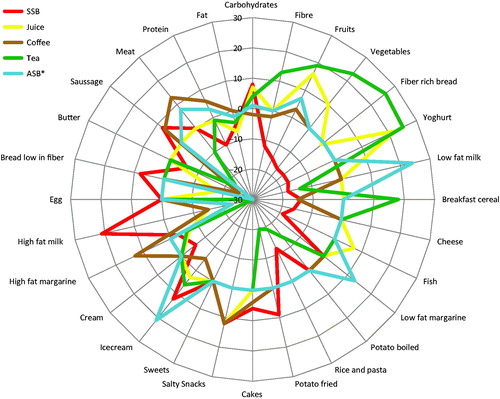
Figure 1. Differences in food and macronutrient intakes (%) between the highest and lowest intake levels of sugar sweetened beverages (SSB), juice, tea, coffee and artificially sweetened beverages (ASB) (g/MJ). All differences above or below zero indicate significant associations (p for trend < 0.002) across five intake levels (three levels for ASB) in the total study population (n = 25,112).
The categorical beverage variables SSB, juice, coffee and tea consisted of five groups, and ASB of three groups. Coffee intake was divided into quintiles. For SSB, juice and tea the first group included the zero and seldom consumers, which were more than 20% of the population, and the other four groups were quartiles of the consumers. As a large part of the population were zero or seldom consumers of ASB (90%), these composed the first group, and the second and third groups included the consumers dichotomised. In sex-specific analyses, we used three intake groups per beverage to avoid too small groups. The ASB groups were considered to be too small for sex-specific analysis, therefor ASB was only analysed in the whole cohort.
Anthropometric measures
Weight was measured using a balance-beam scale. The participants wore light clothes and no shoes. Height was measured with a fixed stadiometer calibrated in centimetres. Body mass index (BMI) was calculated from the weight in kilograms divided by the height in square metres (kg/m2).
Statistical methods
All analyses were carried out in STATA/SE (StataCorp LP, Collage Station, TX). A chi2 test was used for all categorical variables. For all continuous variables, linear regression was used to test associations across intake groups of beverages. All analyses were adjusted in two steps, the basic model with age, sex, dietary method version and season and the full model with additional adjustments for BMI, leisure time physical activity level, smoking, education and alcohol intake.
The 24 food groups were logarithmically transformed to normalise the distributions before analyses. Tests for trends were performed for group medians of transformed values. To handle transformation of zero-consumers, a small value was added. To extract mean and confidence intervals (CI) the untransformed food groups were used. In addition, non-parametric trend-tests across the ordered groups were performed (nptrend in STATA) and as the results were similar to the parametric analyses, only the results of the parametric analyses are presented.
To correct for multiple testing, when analysing beverage consumption in relation to intakes of macronutrients and 24 food groups, Bonferroni correction was applied and therefore statistical significance was assumed at p < 0.002 (0.05/28).
All significant associations between the highest and lowest beverages intake groups were plotted indicating the differences in per cent (between the highest and lowest intake groups) using radar diagrams created in Excel.
Results
Lifestyle associates with beverage consumption
Higher intake of SSB was significantly (p for trend <0.05 for all) associated with higher BMI, higher total energy intake, lower alcohol intake and a lower frequency of individuals with a university degree (). Higher intake of coffee was significantly associated with younger age, higher BMI, lower total energy intake, lower alcohol intake and a lower frequency of never smokers and individuals with a university degree. Higher ASB intake was significantly associated with younger age, higher BMI, lower total energy intake and a lower frequency of individuals with a university degree. Higher intake of both juice and tea was significantly associated with a higher level of leisure time physical activity and a higher frequency of both never smokers and individuals with university degree. Higher tea intake was additionally significantly associated with lower BMI and lower alcohol intake.
Table 1. Lifestyle characteristics according to five intake levels (g/MJ) of sugar sweetened beverages (SSB), juice, tea, coffee and three levels of artificially sweetened beverages (ASB) in the Malmö Diet and Cancer Study (n = 25,112).
Lifestyle associations are similar in men and women
In sex-specific analysis, the associations were similar except for that we found significant associations (p for trend <0.05 for all) between higher consumption of juice and lower BMI and higher total energy intake in women, and between higher consumption of juice and younger age in men. Further, higher consumption of coffee did not significantly associate with higher alcohol intake in women (Supplementary table 1 and 2).
Macronutrient and fibre associate with beverage consumption
Higher intakes of SSB, juice, tea and ASB were significantly associated (p for trend <0.002 for all) with higher intake of carbohydrates [E% per quintile (SEM): 0.75 (0.02), 0.63 (0.02), 0.34 (0.03) and 0.28 (0.08)], and lower intake of fat [E% per quintile (SEM): −0.44 (0.02), −0.056 (0.02), −0.27 (0.03), −0.36 (0.08)] ( and supplementary table 3). Higher intake of coffee was significantly associated (p for trend <0.002 for all) with higher protein intake [E% per quintile (SEM): 0.09 (0.01)], while higher intakes of SSB, juice and tea were significantly associated (p for trend <0.002 for all) with lower protein intake [ E% per quintile (SEM): −0.31 (0.01), −0.08 (0.01), −0.07 (0.01)]. Higher intake of SSB, juice and coffee were significantly associated (p for trend <0.002 for all) with lower fibre intake [g/1000 kcal per quintile (SEM): −0.06 (0.002), −0.01 (0.002), −0.02 (0.003)] while higher intake of tea was significantly associated with a higher intake of fibre [g/1000 kcal per quintile (SEM): 0.4 (0.003)] These associations were observed to be similar in men and women (Supplementary table 4 and 5).
Food intake associates with beverage consumption
We observed associations between beverage intakes and specific food groups when investigating five beverages in relation to 24 food groups. For all significant associations (p for trend <0.002 for all), the difference in percentage between the highest and lowest beverages intake groups are presented in and supplementary table 3. All differences larger than 10% are in this paper referred to as substantial differences and presented below.
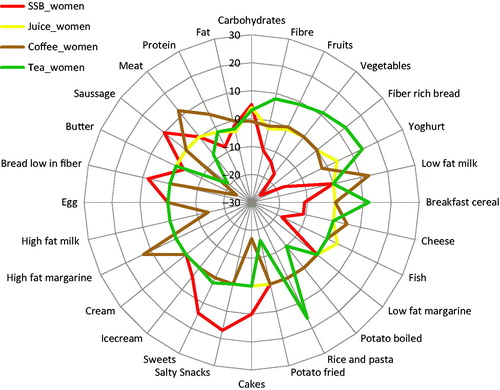
High consumption of SSB was significantly associated with substantially lower intakes of fruits (−15%), vegetables (−17%), yoghurt (−17%), breakfast cereals (−14%), fibre rich bread (−17%), cheese (−16%), low-fat milk (−18%), rice and pasta (−12%) and fish (−19%) and higher intakes of high-fat milk (21%), ice cream (12%) and salty snacks (12%). High consumption of juice was significantly associated with substantially higher intakes of fruits (16%), vegetables (10%), yoghurt (22%) and salty snacks (12%), and lower intakes of high-fat milk (−15%) and bread low in fibre (−18%). High consumption of tea was significantly associated with substantially higher intakes of fruit (19%), vegetables (23%), fibre-rich bread (26%), yoghurt (25%) and breakfast cereals (18%) and lower intakes of low-fat milk (−14%), boiled potatoes (−14%), rice and pasta (−19%), fried potatoes (−20%), high-fat milk (−30%), sausage (−23%) and meat (−10%). High consumption of coffee was significantly associated with substantially higher intakes of salty snacks (12%), high-fat margarine (13%) and meat (13%), and lower intakes of breakfast cereals (−15%), high-fat milk (−15%) and butter (−25%). High consumption of ASB was significantly associated a higher intakes of low-fat milk (24%), low-fat margarines (13%), ice cream (21%), and lower intakes of high-fat milk (−23%) and butter (−30%). The overall patterns were similar in men and women, but fewer associations were observed to reach statistical significance in men ( and , Supplementary tables 4–5).
Figure 2. Differences in food and macronutrient intakes (%) between the highest and lowest intake levels of sugar sweetened beverages (SSB), juice, tea and coffee (g/MJ). All differences above or below zero indicate significant associations (p for trend < 0.002) across five intake levels in all men (n = 9 800).
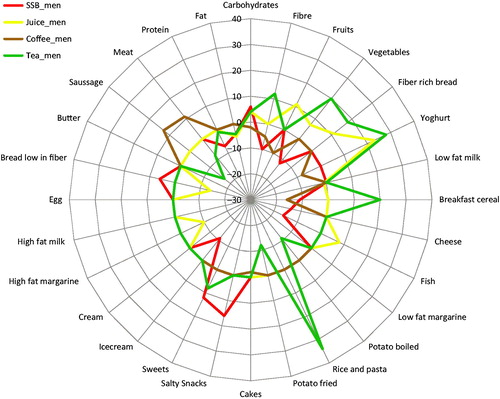
Figure 3. Differences in food and macronutrient intakes (%) between the highest and lowest intake levels of sugar sweetened beverages (SSB), juice, tea and coffee (g/MJ). All differences above or below zero indicate significant associations (p for trend <0.002) across five intake levels in all women (n = 15 312).
Additionally, we tested how the beverages associated with one another, high consumers of SSB consumed significantly less coffee and ASB. High consumers of coffee consumed less SSB, juice, tea and more ASB. High consumers of juice consumed significantly less coffee. High consumers of tea consumed significantly less coffee. High consumers of ASB consumed more SSB and coffee (Supplementary table 6).
Discussion
We observed high intake of five commonly consumed beverages to associate differently with lifestyle and diet characteristics in a population of 25,112 individuals. Intakes of specific beverages have previously been observed to associate with specific parts of the diet, however to the best of our knowledge this is the first study that systematically examined several beverages in relation to both diet and other lifestyle factors in a large cohort.
SSB have been widely investigated and found to associate with many diseases in different cohorts including MDCS, while juice, which has similar energy content, has not (Malik et al. Citation2010; O'Neil et al. Citation2012; Brunkwall et al. Citation2016). However, in this report from the MDCS, we present results showing that high consumption of SSB also associates with a less healthy overall diet including lower intakes of foods generally perceived as healthy such as fruits, vegetables, yoghurt, fibre-rich bread and fish, while high consumption of juice associates with the opposite; higher intakes of foods perceived as healthy such as fruits, vegetables and yoghurt, and additionally higher level of physical activity. In line with our findings, previous studies have indicated that high consumption of SSB and juice may be associated with very different diet and lifestyle characteristics (Vagstrand et al. Citation2009; Barnes et al. Citation2015; Crowe-White et al. Citation2016; Rampersaud and Valim Citation2017). In a study of 8861 individuals, consumption of 100% orange juice was associated with a higher score of a healthy-eating index (O'Neil et al. Citation2012) and in another study (n = 233), using a similar index, individuals who consumed SSB as a snack scored lower on the healthy-eating index (Barnes et al. Citation2015). Additionally, in a large study investigating both purchases from the Homescan longitudinal data (140,352 households) and dietary intake from a cohort study (n = 34,393), consumption of SSB was associated with an overall lower diet quality (Piernas et al. Citation2014).
In the present study, we observed ASB intake to be associated with higher intake of low fat products, and an unhealthier lifestyle. These findings are in line with previous studies in which ASB associated with consumption of other low-calorie products and a lower overall diet quality (Mullie et al. Citation2012). We observed high ASB intake to be associated with a higher BMI but with a lower total energy intake. One interpretation of this might be that individuals who consume ASB are heavier but try to reduce their energy intake by consuming specific low-calorie products such as ASB. In line with this, high intake of ASB has in epidemiological studies been associated with obesity and weight gain even though ASB do not contain any energy (Fowler et al. Citation2008).
Tea, a beverage that has earlier been found to strongly associate with overall health, was in the present study associated with very healthy overall lifestyle and diet (Vuong Citation2014). To compare, we observed high tea consumption to be associated with a higher fibre intake, while high consumption of SSB associated with lower fibre intake. Further, when investigating fibre rich foods in the diet, we observed tea consumers to have increased intakes and SSB consumers to have decreased intakes of fibre rich foods, such as vegetables and fibre-rich bread (Boeing et al. Citation2012; Ye et al. Citation2012).
Coffee is also a beverage previously associated with a decreased risk of metabolic diseases (Poole et al. Citation2017). In the present study, the differences in lifestyle and diet between high and low consumers of coffee were not as clear as for consumers of the other beverages, high consumption tended to be linked to healthy as well as less healthy characteristics. This might be explained by the very high overall consumption of coffee in Sweden. Further, one possible explanation for that both coffee and SSB have been associated with chronic diseases in many studies (albeit to opposite directions) might be that they both are commonly used and easy to measure, with any kind of dietary assessment tool, as they are consumed in standardised cans and cups and the intake is relatively season independent. This may result in lower degree of measurement error than for other foods.
Additionally, we observe associations between the beverages, such that high consumers of the beverages associating with an unhealthy dietary intake reported a lower intake of the beverages associating with a healthier dietary intake. These finding would strengthen our interpretation that specific beverages are a part of specific dietary patterns.
Our results suggest that lifestyle factors including overall dietary characteristics may partly explain previously observed associations between beverages consumption and metabolic disease. Researchers have advocated limited consumption of SSB (Hu Citation2013). Our observations show that SSB are part of an overall unhealthy diet and lifestyle, suggesting that to only limit SSB intake would not be enough, but that in addition, high consumers of SSB would be an important target group for lifestyle interventions, including dietary advice. In favour of this point of view, a review by Trumbo et al. concluded that associations between SSB intake and obesity are inconsistent among studies adjusting for total energy intake (Trumbo and Rivers Citation2014). It is indeed challenging to investigate health implications of beverages or specific foods due to strong associations with total energy intake and overall dietary characteristics. Consequently, accurate dietary assessment of foods commonly consumed in a population are crucial, as well as knowledge about how these factors are related. The findings extracted in this study, could be of importance in future studies investigating the relationship between specific beverages and disease in the MDC cohort and enable selection of relevant confounders to adjust for, minimising the risk of over adjustment. The information could also be taken into account when interpreting results.
The major limitation of our study is that it, similarly to other observational studies with dietary data, has self-reported dietary data. However, the study population is large (n = 25,112) and the dietary assessment was very thorough with a 7-day food record, a 168-item questionnaire and an interview performed by a trained interviewer (Elmstahl, Gullberg, et al. Citation1996; Elmstahl, Riboli, et al. Citation1996; Thiebaut et al. Citation2008).
In the present study, SSB consumption associated with unfavourable food habits, including low intakes of fibre-rich plant foods, whereas consumption of juice and tea associated with beneficial lifestyle characteristics including healthy food choices. Individuals consuming ASB tended to eat more low fat-products but still have a higher BMI. Knowledge about the role of beverages as part of overall lifestyle and dietary patterns may be critical when interpreting results from studies examining beverages consumption in relation to disease, and in designing future public health prevention strategies.
Supplementary Tables 1-6
Download PDF (691.9 KB)Disclosure statement
No potential conflict of interest was reported by the authors.
Additional information
Funding
Related Research Data
References
- Barnes TL, French SA, Harnack LJ, Mitchell NR, Wolfson J. 2015. Snacking behaviors, diet quality, and body mass index in a community sample of working adults. J Acad Nutr Diet. 115:1117–1123.
- Boeing H, Bechthold A, Bub A, Ellinger S, Haller D, Kroke A, Leschik-Bonnet E, Muller JM, Oberritter H, Schulze M, et al. 2012. Critical review: vegetables and fruit in the prevention of chronic diseases. Eur J Nutr. 51:637–663.
- Brunkwall L, Chen Y, Hindy G, Rukh G, Ericson U, Barroso I, Johansson I, Franks PW, Orho-Melander M, Renstrom F. 2016. Sugar-sweetened beverage consumption and genetic predisposition to obesity in 2 Swedish cohorts. Am J Clin Nutr. 104:809–815.
- Crowe-White K, O'Neil CE, Parrott JS, Benson-Davies S, Droke E, Gutschall M, Stote KS, Wolfram T, Ziegler P. 2016. Impact of 100% fruit juice consumption on diet and weight status of children: an evidence-based review. Crit Rev Food Sci Nutr. 56:871–884.
- Ding M, Bhupathiraju SN, Satija A, van Dam RM, Hu FB. 2014. Long-term coffee consumption and risk of cardiovascular disease: a systematic review and a dose-response meta-analysis of prospective cohort studies. Circulation. 129:643–659.
- Elmstahl S, Gullberg B, Riboli E, Saracci R, Lindgarde F. 1996. The Malmö Food Study: the reproducibility of a novel diet history method and an extensive food frequency questionnaire. Eur J Clin Nutr. 50:134–142.
- Elmstahl S, Riboli E, Lindgarde F, Gullberg B, Saracci R. 1996. The Malmö Food Study: the relative validity of a modified diet history method and an extensive food frequency questionnaire for measuring food intake. Eur J Clin Nutr. 50:143–151.
- Ericson U, Hindy GDI, Schulz CA, Brunkwall L, Hellstrand S, Almgren P, Orho-Melander M. 2017. Dietary and genetic risk factors for type 2 diabetes increase the risk in an independent fashion. Submitted.
- Fagherazzi G, Vilier A, Saes Sartorelli D, Lajous M, Balkau B, Clavel-Chapelon F. 2013. Consumption of artificially and sugar-sweetened beverages and incident type 2 diabetes in the Etude Epidemiologique aupres des femmes de la Mutuelle Generale de l'Education Nationale-European Prospective Investigation into Cancer and Nutrition cohort. Am J Clin Nutr. 97:517–523.
- Fowler SP, Williams K, Resendez RG, Hunt KJ, Hazuda HP, Stern MP. 2008. Fueling the obesity epidemic? Artificially sweetened beverage use and long-term weight gain. Obesity (Silver Spring). 16:1894–1900.
- Hu FB. 2013. Resolved: there is sufficient scientific evidence that decreasing sugar-sweetened beverage consumption will reduce the prevalence of obesity and obesity-related diseases. Obes Rev. 14:606–619.
- Hu FB, Malik VS. 2010. Sugar-sweetened beverages and risk of obesity and type 2 diabetes: epidemiologic evidence. Physiol Behav. 100:47–54.
- Larsson SC, Akesson A, Wolk A. 2014. Sweetened beverage consumption is associated with increased risk of stroke in women and men. J Nutr. 144:856–860.
- Maki KC, Slavin JL, Rains TM, Kris-Etherton PM. 2014. Limitations of observational evidence: implications for evidence-based dietary recommendations. Adv Nutr. 5:7–15.
- Malik VS, Popkin BM, Bray GA, Despres JP, Hu FB. 2010. Sugar-sweetened beverages, obesity, type 2 diabetes mellitus, and cardiovascular disease risk. Circulation. 121:1356–1364.
- Malik VS, Willett WC, Hu FB. 2013. Global obesity: trends, risk factors and policy implications. Nat Rev Endocrinol. 9:13–27.
- Manjer J, Carlsson S, Elmstahl S, Gullberg B, Janzon L, Lindstrom M, Mattisson I, Berglund G. 2001. The Malmo Diet and Cancer Study: representativity, cancer incidence and mortality in participants and non-participants. Eur J Cancer Prev. 10:489–499.
- Mullie P, Aerenhouts D, Clarys P. 2012. Demographic, socioeconomic and nutritional determinants of daily versus non-daily sugar-sweetened and artificially sweetened beverage consumption. Eur J Clin Nutr. 66:150–155.
- Nielsen SJ, Popkin BM. 2004. Changes in beverage intake between 1977 and 2001. Am J Prev Med. 27:205–210.
- O'Neil CE, Nicklas TA, Rampersaud GC, Fulgoni VL. 3rd. 2012. 100% orange juice consumption is associated with better diet quality, improved nutrient adequacy, decreased risk for obesity, and improved biomarkers of health in adults: National Health and Nutrition Examination Survey, 2003-2006. Nutr J. 11:107.
- Piernas C, Mendez MA, Ng SW, Gordon-Larsen P, Popkin BM. 2014. Low-calorie- and calorie-sweetened beverages: diet quality, food intake, and purchase patterns of US household consumers. Am J Clin Nutr. 99:567–577.
- Poole R, Kennedy OJ, Roderick P, Fallowfield JA, Hayes PC, Parkes J. 2017. Coffee consumption and health: umbrella review of meta-analyses of multiple health outcomes. BMJ. 359:j5024.
- Rampersaud GC, Valim MF. 2017. 100% Citrus juice: nutritional contribution, dietary benefits, and association with anthropometric measures. Crit Rev Food Sci Nutr. 57:129–140.
- Riboli E, Elmstahl S, Saracci R, Gullberg B, Lindgarde F. 1997. The Malmo Food Study: validity of two dietary assessment methods for measuring nutrient intake. Int J Epidemiol. 26(Suppl 1):S161–S173.
- Tarasuk VS, Brooker AS. 1997. Interpreting epidemiologic studies of diet-disease relationships. J Nutr. 127:1847–1852.
- Thiebaut AC, Kipnis V, Schatzkin A, Freedman LS. 2008. The role of dietary measurement error in investigating the hypothesized link between dietary fat intake and breast cancer-a story with twists and turns. Cancer Invest. 26:68–73.
- Trumbo PR, Rivers CR. 2014. Systematic review of the evidence for an association between sugar-sweetened beverage consumption and risk of obesity. Nutr Rev. 72:566–574.
- Vagstrand K, Linne Y, Karlsson J, Elfhag K, Lindroos AK. 2009. Correlates of soft drink and fruit juice consumption among Swedish adolescents. Br J Nutr. 101:1541–1548.
- Vuong QV. 2014. Epidemiological evidence linking tea consumption to human health: a review. Crit Rev Food Sci Nutr. 54:523–536.
- Willett W. 2012. Nutritional epidemiology. 3rd ed. USA: Oxford University Press.
- Wirfalt E, Drake I, Wallstrom P. 2013. What do review papers conclude about food and dietary patterns? Food Nutr Res. 57.
- Ye EQ, Chacko SA, Chou EL, Kugizaki M, Liu S. 2012. Greater whole-grain intake is associated with lower risk of type 2 diabetes, cardiovascular disease, and weight gain. J Nutr. 142:1304–1313.