
ABSTRACT
In both the scientific and professional community, the need to integrate transport and land-use policies in order to achieve more sustainable urban development is widely recognized. Accessibility can provide a conceptual focus for this integration because it relates to both features of the transport system (e.g. speed, and travel costs) as well as the land-use system (e.g. density and functional mix). The concept of accessibility is well known within the scientific literature. The understanding of how it can improve transport land-use planning integration in practice, however, is still limited. In order to address this gap between theory and practice, we discuss two case studies in the Netherlands in which policy-makers from both transport and land-use planning developed and used accessibility indicators to generate and select effective combinations of transport and land-use interventions. For each case, the type of accessibility indicators used and the way they contributed to an integrated assessment of the quality of the transport and land-use system and the different policy options that resulted from the assessment are discussed. Finally, we reflect on the potentials and limits of this approach, and on the opportunities and barriers for its implementation in day to day planning practice.
1. Introduction
The relationship between transport and land-use is one that has attracted the attention of scientists and practitioners for many decades (Bertolini, Citation2017; Levinson & Krizek, Citation2008; Wegener & Fürst, Citation1999). Given the interdependent nature of transport and land-use patterns and the mutual influence of changes in both domains, it is essential to fine-tune transport and land-use planning strategies, as many authors have contended (Banister, Citation2005; Bertolini, Le Clercq, & Kapoen, Citation2005; Hull, Citation2012; Meyer & Miller, Citation2001). Achieving integration between transport and land-use planning in practice is, however, easier said than done (Banister, Citation2005; Geerlings & Stead, Citation2003; Hull, Citation2012). One can see many examples of discrepancies between the development of the land-use and the transport system. There are, for instance, numerous examples of high-density urban developments at locations which offer poor accessibility by public transport (Banister, Citation2005; Hamers et al., Citation2014; Snellen, Hilbersand, & Hendriks, Citation2005; TRB, Citation2001) and examples of fruitless attempts to provide competitive public transport in low density urban areas (Bruegmann, Citation2008). Transport and land-use planning seem to function as separate worlds, with their own institutions, disciplinary and cultural backgrounds, planning procedures and concepts. If transport and land-use planning integration is to be achieved, all of these institutional and substantive aspects need to be addressed (Geerlings & Stead, Citation2003; Hull, Citation2012). This paper focuses on one of them, namely the need for shared planning concepts that could help transport and land-use planners identify more integrated solutions. Within the scientific literature, accessibility is seen as a crucial concept that could answer this plea (Bertolini et al., Citation2005; Geurs & van Wee, Citation2004; Halden, Citation2002; Handy & Niemeier, Citation1997, p. 2002; Straatemeier & Bertolini, Citation2008). Following its basic definition as the number and type of localized opportunities that can be reached within a certain travel time or cost, accessibility relates to features of both the transport system (e.g. speed and cost of travel) and the land-use system (e.g. density, functional mix). It can, therefore, enable transport and land-use planners to identify interdependencies and relevant trade-offs between these systems. While there is broad consensus on these theoretical principles among researchers, the understanding of how planning for accessibility could unfold in practice is much more limited.
Efforts to address this knowledge gap were once sparse (Bertolini et al., Citation2005; Straatemeier & Bertolini, Citation2008) but have picked up momentum in recent years (Papa, Silva, te Brömmelstroet, & Hull, Citation2016; Silva, Bertolini, Te Brömmelstroet, Milakis, & Papa, Citation2017). In this literature, the expectation that a focus on accessibility will lead to more integrated planning is largely assumed, and the analytical focus is rather on identifying opportunities and barriers for implementing accessibility planning in practice. However, a relevant and interesting question is also to what degree and in which ways a focus on accessibility indeed leads to more integrated planning. What is, in other words, the distinctiveness and added value of accessibility planning relative to current ways of planning transport and land use? And are there perhaps also drawbacks that a full-fledged shift from mobility-centred planning towards accessibility-centred planning could entail? Finally, to what sort of transport and land use planning could acknowledgment of both added value and drawbacks lead in practice? These questions are the focus of this paper.
To answer these questions, we applied the process of accessibility strategy-making labelled ‘Joint Accessibility Design’ (Straatemeier & Bertolini, Citation2008) in two real-world planning cases in the Netherlands. In these cases, transport and land-use planners worked together to come up with strategies for addressing existing problems. To assess if the strategies the practitioners produced can indeed be seen as more integrated strategies, and in which ways, we use the well-known transport and land use feedback cycle (Giuliano, Citation2004; Meyer & Miller, Citation2001; Wegener & Fürst, Citation1999) as a conceptual framework to describe the type of interdependencies and trade-offs the planners identified. We compare the result of the cases to previous policies to see if outcomes were more integrated once the concept of accessibility was used, and how. We conclude with a discussion of the benefits and caveats of using the concept of accessibility to achieve more integrated transport and land-use strategies and reflect on the implications of the findings for the adaptation of day to day planning practice.
2. What constitutes transport and land-use integration?
To assess if and how the use of accessibility as a planning concept leads to more integrated transport and land-use strategies, a definition for an integrated strategy is needed. For this, we use the land-use transport feedback cycle (Giuliano, Citation2004; Meyer & Miller, Citation2001; Wegener & Fürst, Citation1999) as a starting point (see ).
Figure 1. Transport and land-use feedback cycle (Giuliano, Citation2004; Meyer & Miller, Citation2001; Wegener and Fürst, Citation1999).
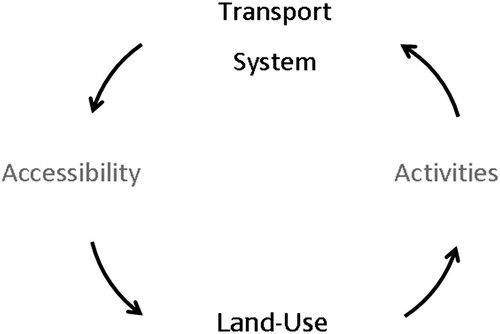
The land-use transport feedback cycle shows the two-way interaction between transport and land-use. The distribution of different land-uses co-determines where activities (e.g. living, working, recreating) take place. The spatial distribution of activities creates the need for a transport system that offers people and goods the opportunity to travel or be transported from one activity to the other. In turn, ‘the distribution of infrastructure in the transport system combined with existing land-use patterns creates opportunities for spatial interaction and can be measured as accessibility’ (Wegener & Fürst, Citation1999, p. vi). Finally, the quality of accessibility co-determines where different types of land-uses are developed, which then influences the spatial distribution of activities and starts the cycle anew.
The transport land-use feedback cycle is a highly simplified representation of reality. Important external factors (e.g. broader socio-economic processes) are excluded and internal complexities are denied (for a version acknowledging these factors see Bertolini, Citation2012). The cycle can, however, be usefully employed to explore interdependencies and trade-offs between the two systems, even with a non-expert audience. With the transport and land-use feedback cycle, it is, for instance, possible to explain the interplay between the democratization of the car, the expansion of the highway system and suburbanization. Rising incomes and cheaper production made cars available for the masses after World War II. Access to cars coupled with the expansion of highways decreased the need to live close to work or a railway station, thus fuelling suburbanization. This meant that activities took place over longer distances and at different locations, which lead to a growing need for a transport system that could facilitate these new activity patterns: the highway. The development of the highway system further improved accessibility at the urban fringe, which fostered more suburbanization. It is hard to determine whether suburbanization caused the expansion of the highway system or if it was, in fact, the other way around. It should be seen rather as a mutual, self-reinforcing relationship as is reflected in the transport land-use feedback cycle. A similar reasoning can be applied to the relationship between compact urban development and the enhancement of public transport, biking and walking. While these may appear as obvious interdependencies, the dynamic mutual relationship of transport and land-use is not always recognized by policy makers, as discussed in the introduction.
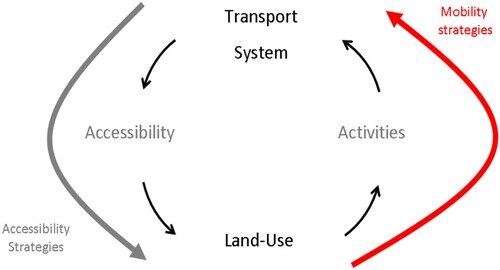
When transport land-use interdependencies are acknowledged in planning practice there is a strong emphasis on what Handy (Citation2002) calls ‘mobility strategies’, which address only one half of the transport land-use feed-back cycle, the right-hand side (see ). Mobility strategies take current or proposed land-use patterns as a given. The strategies focus on the question of how to deal with the additional mobility that is caused by a particular urban development. Two types of strategies are common (Handy, Citation2002): mobility enhancing strategies (e.g. building new roads), or mobility limiting strategies (e.g. road pricing, reducing road capacity). The focus on mobility strategies can also be seen in the transport models that are most commonly used (Handy, Citation2008; Meyer & Miller, Citation2001). Here, what can be called ‘accessibility strategies’ is related to the left-hand side of the transport land-use feedback cycle (Handy, Citation2002; see ). Following the logic of the cycle, more accessibility-focused transport strategies would better acknowledge (1) the risk of planning transportation networks that will put development pressure on locations where it is not desirable (e.g. natural areas) and (2) the opportunity of planning transportation networks where they could facilitate desirable development (e.g. where there is economic or social need). Following the same logic, more accessibility-focused land-use strategies would better acknowledge (1) the risk of planning locations that, because of limited accessibility, have limited development potential, and (2) the opportunity of planning locations that, due to their better accessibility, have greater development potential. We define an integrated strategy as a combined strategy of transport and land-use measures that reinforce each other, as for example advocated in ‘Transit Oriented Development’ (Bertolini, Curtis, & Renne, Citation2012). In the next section, we discuss how the use of accessibility concepts and measures by transport and land-use planners in strategy making can lead to these enhanced insights.
Figure 2. Mobility strategies are dominant while accessibility strategies get less attention (Handy, Citation2002).
3. Joint-accessibility design
The framework ‘Joint-Accessibility Design’, developed by Straatemeier and Bertolini (Citation2008) uses accessibility as a planning concept to design integrated transport and land-use strategies. The framework consists of four basic steps. First, policy makers are asked to express wider societal goals in terms of accessibility needs. For example, the goal of enhancing regional economic productivity can be expressed in the need for the access of firms to the labour force as well as other firms (Prud'homme & Lee, Citation1999). The goal of social equity can be expressed in the need to grant all citizens access to basic services by different modes of transport (Jones, Citation2011; Preston & Rajé, Citation2007). The second step is to try to measure and analyse the identified accessibility needs using a combination of measures that is at the same time understandable for policy makers as well as an acceptable reflection of actual travel and location behaviour (Bertolini et al., Citation2005). The third step of the framework is aimed at understanding the change in accessibility conditions as a result of interventions in the transport and land-use system. The knowledge acquired during step three is then used in the fourth step to identify relevant sets of coherent interventions in the transport and land-use system which can then be designed and selected. A crucial characteristic of this approach is that accessibility measures are chosen and specified through ‘interaction’ with practitioners and in ‘relation’ to the planning problems at hand. In this approach, something is lost in terms of scientific rigour (more complex indicators are not likely to be chosen), but much is gained in terms of practical relevance (indicators are fine-tuned to the knowledge of the participants and the nature of the problems) (Bertolini et al., Citation2005).
In order to answer the questions of this paper about the relationships between a focus on accessibility and degrees and ways of transport and land use planning integration, this framework has been applied to two case studies in the second and sixth largest cities in the Netherlands, Rotterdam and Almere, respectively. In both cities, a series of meetings and workshops were conducted where the steps of the framework were carried out. In each case, 5–10 professionals, including both transport and land-use planners working for the municipal planning department, participated in the process. These participants are the senior policy makers within their cities and are representative of transport and land-use professionals working in other cities or consultancies in the Netherlands. In-depth interviews were held before and after the workshops to clarify intentions and expectations. The workshops were recorded on audio tape, and questionnaires were conducted following the workshops. The participating planning professionals were asked if the accessibility analysis changed their thinking and which new insights they had gained from the process. A few years after this exercise a senior professional in each city was interviewed to assess its long term impact on policy-making. The whole process took place between 2007 (the first orientation meetings) and 2017 (the follow-up, reflective interviews). summarizes the whole process.
Table 1. Outline of the case study.
After a short introduction of the two cases, we will discuss the impact the Joint Accessibility Design framework had on strategy making in each of the two cases.
4. Case I – Almere
The first case study is the new town of Almere, a city of 190,000 in the greater Amsterdam region (see ). Almere is a completely planned city in the Flevopolder, which is part of the last big land reclamation scheme in the Netherlands. The first house in Almere was built as recently as 1976, making Almere the fastest growing city in the Netherlands. The city has a polycentric structure of urban concentrations (each 20,000–50,000 inhabitants) separated by green belts. An extensive and articulated network of roads with a bus rapid transit system connects the different parts of the city.
Figure 3. City of Almere and current planning strategies (adapted from Metropoolregio Amsterdam, Citation2009).

Two bridges connect Almere with the urban agglomerations of Amsterdam (rail and road, to the East) and Utrecht (road, to the South). These bridges see large commuter flows leaving Almere every morning. This is partly to the fact that employment growth in the city is lagging behind the growth in population, whereas Amsterdam and Utrecht have an overabundance of jobs. In cooperation with regional planning actors, planning schemes aimed at doubling the total population to 300,000 inhabitants or more are being considered by the national government (Rijk, Provincies Noord-Holland, Flevoland en Utrecht, Gemeenten Almere en Amsterdam, Citation2013). Areas for new development are planned on the outskirts of the city in the northwest and southeast. The planned urban growth will put a great deal of pressure on the existing road and rail connections, especially the two bridges. Improving the current regional and local transport system is therefore seen as a crucial precondition for facilitating urban development in the area.
4.1. Step 1 – planning goals and accessibility needs
An important aspect of the Joint Accessibility Design framework is to directly relate the accessibility measures to wider social, economic and environmental goals in order to establish a clear link between the concept of accessibility and current policy debates (Straatemeier & Bertolini, Citation2008). During the first workshop, the transport and land-use planners in Almere identified four important goals or preconditions that are necessary for the city to prosper. We asked them to choose goals that were in one way or another debated in the existing policy arena or policy documents, not necessarily by the transport professionals. The first goals they identified was the improvement of social cohesion. The second goal was determined as the improvement of the economic competitiveness of the city, in order to attract more jobs, especially for regionally-oriented firms. The third goal is to increase the variety in living environments. Almere is mainly characterized by suburban environments. If the city continues to grow, the municipality would like to add more urban environments. The transport and land-use planners determined the fourth goal as sustainable growth with the reduction of CO2 emission and use of recycling resources according to cradle-to-cradle principles (McDonough & Baungart, Citation2002). We helped the planners identify accessibility measures that relate to these four goals. For each goal, we asked them (1) which spatial scale they believed to be most relevant, (2) which accessibility needs they considered most important and (3) which modes of transport they thought should be prioritized. summarizes the answers to these questions. It is important to stress that these are accessibility aspects that the planners thought could be of importance with respect to a specific planning goal and not necessarily the state-of-the-art scientific knowledge on how accessibility relates to the aspired goals. The step of linking societal goals to accessibility measures overall got positive reactions from the policy makers, as documented by the questionnaires both in the Almere and the Rotterdam case. Policy makers especially saw the added value of accessibility as a concept that could more easily be linked to societal goals than traditional mobility indicators. However, they sometimes seemed to struggle to select appropriate accessibility measures, because of a lack of knowledge about current travel and activity patterns and the type of accessibility improvements that could positively influence the selected policy goals.
Table 2. Planning goals and accessibility requirements, as identified by the participants during the first workshop (Almere case).
4.2. Step 2 – accessibility measures and transport model
The accessibility analysis was carried out using a potential accessibility measure with a distance decay, or impedance function (Geurs & Ritsema van Eck, Citation2001). A potential accessibility measure shows the opportunities (e.g. services, labour force, population) that can be reached from a location within a certain travel time. A distance decay or impedance function assigns a weight to opportunities relative to the travel time required to access them (opportunities that are closer get a higher weight). Together these characteristics make it an accessibility measure that directly relates to the accessibility requirements as formulated by the participants (see ), and is relatively easy for non-experts to comprehend. The travel times shown in indicate the average travel times on each spatial scale, which coincide with the point in our impedance functions where there is a 50% trip likelihood. The impedance functions were estimated with the use of the Dutch national travel survey (Rijkswaterstaat, Citation2007). Accessibility scores were calculated using a combination of a multimodal local and regional four step transport model developed by Goudappel Coffeng. The local model has 600 zones for Almere and has detailed data on inhabitants, jobs and services. Each zone has between 50 and 2000 inhabitants. The local model was used to calculate the accessibility measures at the neighbourhood and city level. To calculate accessibility measures at the metropolitan level the local model was combined with the regional model. The regional model has much less detailed data outside Almere (1000–20,000 inhabitants per zone).
Table 3. Average travel times on each spatial scale rounded off by 5 min intervals (Almere case).
4.3. Step 3 – accessibility analysis
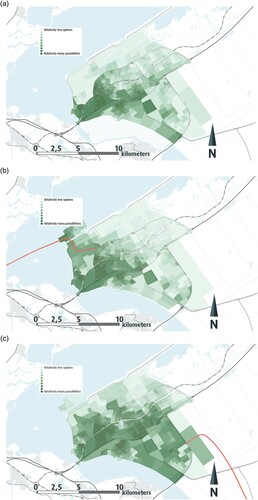
In addition to the analysis of the current situation two extreme scenarios were designed in order to learn more about the accessibility impacts of interventions in the transport system, these scenarios reflected some of the mobility-oriented strategies in place right now, but that were never analysed from an accessibility perspective. Scenario I was labelled ‘hub and spoke’ and focused on the improvement of the interregional accessibility of Almere. Scenario I means reducing travel time on existing interregional transit and highway corridors and/or adding new interregional links to regions with which Almere currently is not well connected. For public transport, one of the strategies is to increase the number of intercity services. For the car, expressways with a limited number of exits are introduced. Scenario II was labelled ‘metropolitan connectivity’ and focused on improving the connections of Almere with the rest of the Amsterdam metropolitan area. Scenario II includes a new multimodal connection across the ‘IJmeer’, a lake between Almere and Amsterdam, linking the two cities directly. Focus is on improving network capacity and introduce more exits on the highway system and more metropolitan transit nodes. The second scenario shows the most similarities with existing policies while the first scenario is quite different. The proposed future land-use was kept constant in both scenarios so only the redistribution of opportunities through interventions in the transport system is shown. While this might seem to contradict our aim to focus on integrated transport land-use strategies, the purpose was, as discussed below, to provide insight in the land-use implications of transport interventions (as in the ‘accessibility strategies’ identified by the left hand side of in ), not to address the full range of transport land use interactions (the whole of ).
The maps in (a–c) show the relative distribution of accessibility by car resulting from the two scenarios (categorized in ten classes, or deciles). The difference in impacts between the scenarios where most marked with respect to access by car, which is why these are shown. The ‘hub and spoke’ scenario leads to a more even distribution of accessibility and a higher overall growth in accessibility. The city centre and eastern parts of the city benefit from the new interregional connections that reduce travel times to the rest of the Netherlands. The ‘metropolitan connectivity’ scenario leads to an uneven distribution of and lesser overall improvement of accessibility, with the gains concentrated in the areas nearby the new cross-channel connection and the existing bridge.
Figure 4. (a) Access to population by car (30 min. inter-peak) – 2010; 10 classes or deciles, from dark grey (relative more opportunities) to light grey (relative less opportunities) – calculated with local and regional four step transport model. (b) Access to population by car (30 min. inter-peak) – 2030, scenario I: metropolitan connectivity – new bridge to Amsterdam; 10 classes, from dark grey (relative more opportunities) to light grey (relative less opportunities) – calculated with local and regional four step transport model. (c) Access to population by car (30 min. inter-peak) – 2030, scenario II: hub and spoke – new highway to the eastern part of the country; 10 classes, from dark grey (relative more opportunities) to light grey (relative less opportunities) – calculated with local and regional four step transport model.
4.4. Step 4 – strategic insights
The transport and land-use planners that participated in the case study identified several strategic insights which they derived from the joint accessibility analysis. The majority of the participants stressed the added value of accessibility to serve as a benchmark. It shows how opportunities and thus the development potential for land-use are geographically distributed and makes it easy to compare the competitive position of different locations within the urban region. The analysis generated several new insights compared to existing plans we discussed in the interviews before the workshop. Both transport and land-use planners stressed for example that they were surprised by the relatively weak regional accessibility of Almere as compared to other parts of the metropolitan region. This connects to the second point which was made by the participants, namely that the analysis helped better structure the debate about where to position new urban development. The analysis showed that the planned areas for new development in the northwest and southeast have relatively low development potential in terms of accessibility in the existing situation, and possibly not enough accessibility to support current planning aims. For instance, because of its location close to two highways, the new business development site shown in was originally seen as a very interesting location for regionally oriented firms, especially by land-use planners. The accessibility analysis, however, showed that other locations have much better access to the regional labour force. Some of the participants found the multimodal approach in the accessibility analysis especially helpful in the debate about urban development. It shows where public transport is competitive and where it is not in terms of opportunities within reach, and these insights can help the discussion about where to increase density and locate public services. For example, the analysis showed that it is very difficult to make public transport competitive in the eastern part of the city, even if the service is significantly improved. A final strategic insight mentioned by the professionals participating in the Almere case study concerned the impact of investments in the transport system on the access to opportunities. They were surprised by the difference in the distribution of accessibility between the two scenarios. The accessibility maps were seen as very helpful to assess if new infrastructure leads to an increase of accessibility in the areas one wishes to improve. A comparison between (a) and (b) shows, for instance, that the urban development in the north-western part of Almere depends not only on the new bridge being built but also that the impact of the bridge’s accessibility to other parts of the city are relatively limited. The transport planners mentioned that the analysis made them much more aware of the impacts of choices about where to locate a highway exit or a public transport stop on the accessibility of locations, and thus on land-use development opportunities. The greater even distribution of accessibility created in the first scenario was, in this respect, very interesting. However, because it was not consistent with current transport investments and required quite a detour from dominant ways of thinking, transport professionals found it hard to embrace the first scenario. One land-use planner found the accessibility analysis too complex to be useful for strategy making. A transport professional highlighted that only when accessibility analysis would become part of cost–benefit analysis it would get more attention.
5. CASE II – Rotterdam
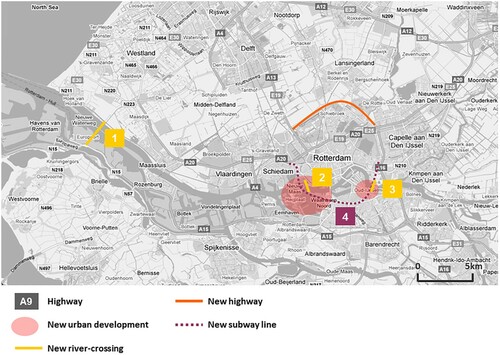
Rotterdam is the second largest city in the Netherlands with close to 600,000 inhabitants. The Rotterdam Metropolitan Region contains around 1.3 million people. The city is located in the Province of South Holland, situated in the western part of the Netherlands (see ). Strategically located at the mouth of the Rhine-delta, Rotterdam is well known for its port, which is one of the busiest in the world. The city of Rotterdam is cut in half by the river Nieuwe Maas. The case study focuses on the areas south of the river. Several deprived areas with a high concentration of social and economic problems characterize the south of Rotterdam. Plans for new urban development along the riverbanks include a new football stadium combined with leisure and housing. The national government has made investments in infrastructure, housing quality and the local economy a priority (Ministerie van Binnenlandse Zaken, Citation2011). As part of a strategy to improve the position of the southern part of the city, plans for new river crossings will make new developments accessible.
Figure 5. Map of Rotterdam including proposed transport and land-use plans. Numbers refer to the proposed new river-crossings discussed in Section 5.3.
5.1. Step 1– planning goals and accessibility measures
Similar to the Almere case, the transport and land-use planners taking part in the Rotterdam workshops were asked to identify different societal goals that could be served by improvements in accessibility. Three goals were agreed upon (see ). The first and most important goal is to improve the social-economic position of the people living in the deprived areas. The second goal is to attract labour-intensive and/or knowledge-based industries in the area to increase the number of jobs and attract higher income households. The third goal is to attract national services and leisure activities. Again, participants were asked to identify accessibility requirements related to these goals with respect to spatial scale and accessibility needs (see ; transport modes and travel times are discussed in Section 5.2). In particular, the discussion centred around the need to improve the accessibility to current job concentrations in the region for those living in the areas south of the river and the accessibility of Rotterdam South to both the rest of the region as well as the entire country in order to attract new businesses and services.
Table 4. Planning goals and accessibility requirements, as identified by the participants during the first workshop (Rotterdam case).
5.2. Step 2 – accessibility measures and transport model
In contrast to the case of Almere, the accessibility analysis in Rotterdam was carried out with a contour measure (Geurs & Ritsema van Eck, Citation2001). Participating planners found the measure to be more transparent (and thus acceptable) than the potential accessibility measure adopted in Almere (or even more complex measures). Differently than potential measures, contour measures compute opportunities that can be reached within a given travel time without a distance decay function. All opportunities within the chosen isochrone (i.e. the line connecting places at the same travel time) are weighted equally regardless of the time it takes to travel to reach them. Opportunities that are outside the isochrone are not taken into consideration. The contour measure, while easy to comprehend, possesses some important drawbacks in terms of scientific rigour (Geurs & Ritsema van Eck, Citation2001 – for a discussion of the rigour relevance trade-offs when measuring accessibility see Bertolini et al., Citation2005). The contour measure can give a misleading indication of accessibility, especially if there are large concentrations of opportunities just outside the isochrone. To address these shortcomings the contour measure was calculated several times using different isochrones for different opportunities and transport modes. These travel times were chosen with the help of data from the national travel survey on average travel times for these opportunities and modes (Rijkswaterstaat, Citation2007). shows the different contour measures that were calculated. For access to jobs, the planners would ideally have differentiated between the type of jobs, with a special focus on jobs that matched the skills of the people currently living in the South of Rotterdam, but the available data did not allow for such a segmentation.
Table 5. Contour measures (Rotterdam case).
The accessibility analysis in Rotterdam was carried out with the regional transport and environmental impact model (RVMK-model), due to the fact that this model was readily available and familiar to (and therefore trusted by) the participants. In essence, the RVMK-model is a traditional, four-step transport demand model. Its added value lies within its multimodality, including car, public transport and bike. Furthermore, it calculates travel times for the car both in the peak and off-peak (free flow) period with reasonable accuracy. This makes it possible to show the impacts of congestion on the potential accessibility of firms and households. The transport model has more than 3400 zones. The level of spatial detail is high in Rotterdam; zones have no more than 5000 inhabitants in one area. Outside Rotterdam, the zoning structure is quite coarse, which can have an influence on the accessibility scores.
5.3. Step 3 – accessibility analysis
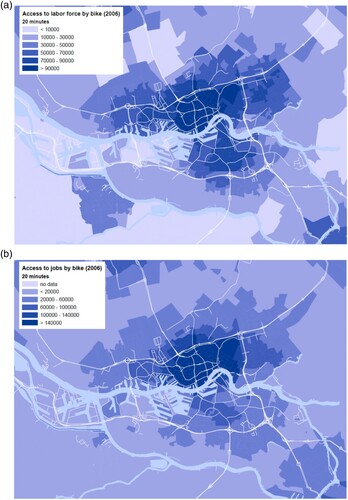
We will highlight some of the outcomes of the accessibility analysis that played an important role in the discussion. (a) and (b) show differences in the accessibility by bike to labour force and jobs between the northern part of Rotterdam, which includes the city centre, and the neighbourhoods in the southern part of the city. The first map shows good labour force accessibility on both sides of the river, whereas the second shows that access to jobs is clearly better north of the river, where most jobs are concentrated.
Figure 6. (a) Access to labour force by bike – 2006 – calculated with the RVMK model. (b) Access to jobs by bike – 2006 – calculated with the RVMK model.
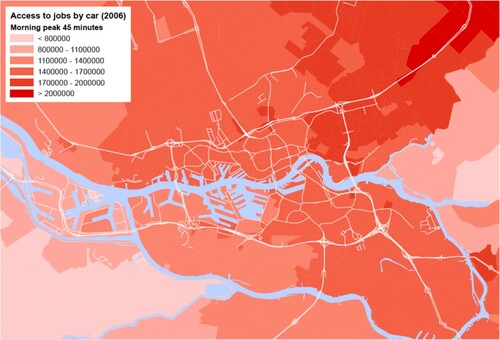
shows access to jobs by car during the peak period. The areas with the highest accessibility are located on the northern and eastern part of the orbital motorway. These areas are the closest to other cities lying in the highly urbanized Randstad region, including The Hague, Utrecht and Amsterdam.
Figure 7. Access to jobs by car – 2006 – calculated with the RVMK model.
The aim of the scenario analysis was to gain insight into the impacts of four new river-crossings on the accessibility in areas south of the river. Currently, there are eight river crossings: two for national and regional car traffic, three for national and regional public transport traffic, and three for mixed local car, public transport and bicycle traffic. shows the different new crossings under consideration. The first (no. 1 in the figure) is a new highway crossing to improve the connection between the Rotterdam harbour and its planned expansion into the North Sea and the region of The Hague. The second and third (no. 2 and 3 in the figure) are new bridges connecting recent development areas on the south side of the river with the city centre and northern parts of the city. These bridges serve cars, bicycles and local public transport. The second bridge is very close to one of the existing river crossings. A new tangential subway line proposed by the municipality is highlighted in no. 4 in . Crossing the river twice and linking with existing subway lines on the river banks, the subway line would connect the most important centres in the south of Rotterdam and the proposed developments, while offering interchanges with the existing subway and rail corridor that runs from north of the city to the south. Just as in Almere, the land-use scenarios were kept constant in order to focus on accessibility impacts and land use implications of interventions in the transport system.
The analysis shows that the accessibility impacts of the proposed river-crossings differ quite significantly. The connection between the harbour and The Hague (no. 1 in ) improves the strategic position of the harbour, which is currently only connected by highway to the city of Rotterdam. The accessibility impacts on the rest of the region are, however, limited. The impact of new bridges for cars and bicycles in the inner city (no. 2 and 3 in ) is even more restricted. Accessibility effects are only visible in the immediate vicinity of the bridges, while impacts in a wider area are almost non-existent. The primary reason for the limited impact is because of the existing eight river crossings in Rotterdam, of which three are located in the inner city and are already open for mixed car, public transport and bicycle traffic. From a theoretical point of view, an accessibility measure with a distance decay function might better capture the effects on the car and especially accessibility by bicycle.
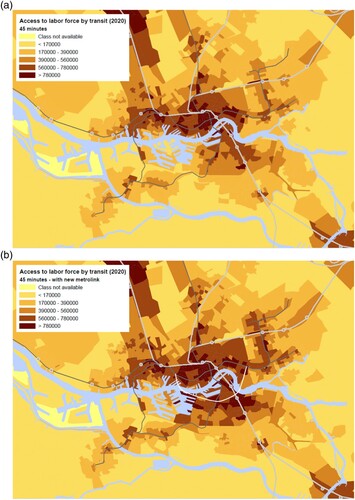
The new tangential subway line (no. 4 in ) is a different matter in terms of its impact on accessibility. The connection between existing centres on both sides of the river and the linking of the new line to the existing subway and railway networks brings accessibility in the southern part of the city on the same level as the rest of the city centre (see (a,b)).
Figure 8. (a) Access to labour force 2020 by transit – base line scenario; existing subway lines are in dark grey, existing railways lines in light grey. – calculated with the RVMK model. (b) Access to labour force 2020 by transit – scenario new tangential subway (white line); existing subway lines are in dark grey, existing railways lines in light grey – calculated with the RVMK model.
5.4. Step 4 – strategic insights
The comments made by the transport and land-use planners in Rotterdam were very similar to the ones in Almere. All the participants noted that they acquired new knowledge that was useful in the designing of more integrated transport and land-use strategies. The ability of accessibility maps to serve as a regional benchmark for development opportunities was mentioned several times. The participants also highlighted that they were sometimes surprised by the geographical distribution of accessibility and how the distribution changed as a result of interventions in the transport system. The planner’s idea of the best accessible locations appeared at times in contradiction with reality. For example, some of them thought the locations on the northern part of the orbital motorway would have low levels of car accessibility since they suffer from heavy congestion, but the analysis showed that even if you take congestion into account these locations offer high accessibility by car due to their central location within the highway network and proximity to concentrations of opportunities. It helped to explain why the part of the city north of the river is still favoured by developers, at the cost of locations south of the river. A transportation planner emphasized that the multidimensional perspective on accessibility adopted in the study is particularly helpful. One needs to look at accessibility for different modes and for different opportunities in order to have a better understanding of the strategic position of a location. Especially the land-use planners were surprised to realize how limited the impact of new bridges on the accessibility of cars and bicycles were. In terms of land-use strategy, the impressive impacts of the new subway line convinced some of the land-use planners that the new developments should be more transit-oriented. The fact that the southern part of the city lags especially behind in terms of access to jobs makes a fast transit connection to existing jobs concentrations elsewhere in the city appear as a logical investment. Some questions were raised about the accuracy of travel times calculated by the RVMK-model which is mostly used to determine level-of-service measures. A transport professional highlighted that if you let these accessibility analysis guide your land-use policy this would lead to mobility effects that might negatively influence accessibility. This stresses the need to combine accessibility and more traditional mobility impact analysis (the other half of the feedback cycle in ).
6. Long-term impact
During and directly after the workshops we found that the participants were quite positive about the concept of accessibility and the possible implications for policy making. But what has been the long term impact of the exercise on the policies in each of the cases? To shed light on this issue in each of the cases one leading professional was interviewed in 2017. They were asked if they still used and favoured the accessibility concept and if so if it had influenced policy making.
The long-term impact in Almere is limited. Most of the participants from the Almere workshop had shifted position within the municipality (no longer working on transport and land-use) or left Almere altogether. They took the acquired knowledge away with them. Accessibility was not one of the indicators in the most important policy document of the city and the national government about the future development of Almere the so-called ‘RRAAM overeenkomst’ (Rijk, Provincies Noord-Holland, Flevoland en Utrecht, Gemeenten Almere en Amsterdam, Citation2013). As already mentioned during the workshops the approach of planning for accessibility was quite contrary to the existing transport policy of Almere that is primarily focused on increasing highway and rail capacity to Amsterdam, and the workshops were not able to change that. However one of the professionals highlighted that the accessibility maps had played a role in thinking about the trade-offs between speeds and number of stops for the new public transport connections for Amsterdam they were working on.
In Rotterdam, the use of the Joint-Accessibility-Design framework had a much more lasting impact. The interviewee described it as the starting point for using these types of accessibility analysis for important transport studies. Since then they have used such measures in several occasions (e.g. Masterplan Rotterdam Vooruit, Citation2009), and especially in studies that focused on improving the accessibility of the deprived area of Rotterdam South. The interviewee said that they have learned valuable lessons both in terms of the concept as well as the impact on policy making. They learned that accessibility is especially useful when debating possible land-use decisions or evaluating the land-use impacts of large transport projects or infrastructure programs. On the other hand, small transport interventions hardly show any change in the accessibility indicators, suggesting different metrics might be required. Furthermore, they found out it is important to compare the accessibility of areas that are broadly similar. The access to jobs by public transport in the city centre will always be better than in the suburbs, one transport intervention, however big, cannot change that. It is much more interesting to compare, for instance, different suburban areas with each other with respect to accessibility. Finally, the interviewee also highlighted that, while both transport and land use planners could work with the maps, explaining them to politicians remains a challenge, especially the potential accessibility maps.
In terms of using these insights to influence the decision making on major transport infrastructure the results have been mixed, and particularly when the national government has to provide most of the funding. One of the problems is that improved accessibility is not well acknowledged by a traditional cost–benefit analysis, the key instrument for assessing investment in the Netherlands, which overwhelmingly relates benefits to travel time savings. Especially transport projects that aim to enable new interactions between areas where there are not many at present (as is the case with Rotterdam South) do not perform well in a traditional cost–benefit analysis, whereas they do well in an accessibility analysis. Illustrating this tension, the accessibility maps showing the positive impact of the new metro connections discussed in our original workshops, became part of a political debate between city and national government. The latter was at pain integrating this type of information with their existing assessment framework and investment logic, rather centred around achieving travel time savings and fighting congestion. However, the interviewee also observed that slowly the tide seems to be shifting. The new accessibility indicator developed by the National Government (MuConsult BV and Move Mobility, Citation2014) although not adequately reflecting the logic of access to opportunities at least shows geographically which areas are better connected and which ones are less. In many current national projects accessibility indicators have become part of the evaluation criteria along with more traditional level-of-service measures. There have also been valuable contributions within the scientific community to find ways to calculate the economic value of accessibility benefits so they could be taken into account in cost–benefit-analysis (see Geurs, de Bok, & Zondag, Citation2012; Geurs, De Montis, & Reggiani, Citation2015).
Overall, reflecting on the different outcomes between the two cases, it seems that in Rotterdam the concept of accessibility was much more in line with policy needs already existing at the moment of the workshops, whereas in Almere they had enduring troubles linking it to their current strategy.
7. Conclusions and discussion
In this paper we sought an answer to the questions: To which degree and in which ways does a focus on accessibility leads to more integrated transport and land-use strategies in planning practice? What are the added value and possible drawbacks of planning for accessibility relative to current ways of planning transport and land use? With what implications for planning practice? In order to answer these questions, accessibility concepts and measures were used to support two integrated strategy-making exercises involving transport and land-use planners in two urban regions of the Netherlands. Following the logic of the left hand side of the transport land-use feedback cycle (see ‘accessibility strategies’ in ), we expected that the use of accessibility concepts and measures would help better acknowledge (1) the risk that planning transportation networks could develop pressure on locations where it is not desirable; (2) the opportunity that planning transportation networks could facilitate desirable development; (3) the risk of developing locations that, due to their limited accessibility, have restricted development potential; and (4) the opportunity for developing locations that because of better accessibility, have greater development potential.
Through participating in the strategy-making exercise, the planners in Almere and Rotterdam seem to have better acknowledged these risks and opportunities, as shown by the acquired insights discussed above. In both cases, these insights lead them to question existing beliefs and policies, and to start considering new possibilities. Planning for accessibility, as articulated in the Joint Accessibility Design framework does in this respect appear to have the potential of leading to more integrated transport and land-use planning, or, more precisely, to a greater awareness of current development potential of locations given the quality of accessibility and future land-use implications of transport interventions. There are, however, two important considerations.
First, as underlined by the discussion of the transport land-use feedback in Section 2, and as noted by the participants in the workshops, particularly in Rotterdam, we should not forget that mobility strategies (the right-hand side of the cycle in ) must continue to play a role. Accessibility changes will affect land-use changes which, in turn, will affect location and mobility behaviour. These impacts need to be acknowledged and policies managing their implications need to be developed, as in the ‘mobility strategies’ discussed by Handy (Citation2002), either ‘enhancing’ or ‘limiting’ the generated mobility. Mobility policies will, in turn, affect accessibility, and so on. The challenge for research and practice seems then to set up and support a planning process that could keep ‘shifting’ between an accessibility and a mobility perspective and keep ‘combining’ the obtained insights.
A second, and possibly more fundamental challenge, is to understand how insights similar to those generated in the two cases can be incorporated in day-to-day planning practice, thus overcoming the still very significant institutional barriers hampering transport land-use planning integration in general, and a focus on accessibility strategies in particular. The workshops and follow-up interview in Rotterdam suggested more emphasis on incorporating accessibility benefits in cost–benefit-analysis or at least combining more traditional level-of-service indicators with accessibility indicators as possible first steps. However, as the limited long term impact in Almere compared to Rotterdam showed, there first has to be a political willingness to embrace the concept of accessibility and explore other policy options. In Almere, it was not so much the concept of accessibility itself that was challenged, but the fact that the accessibility analyses seemed to challenge current policies. The fact that the concept is more difficult to understand, as was stressed by the policy makers involved, might have added to the difficulty of embracing it. More in general, this discussion points at a limit of this paper. This paper mainly focused on integrating transport and land use planning knowledge, not so much integration of formal transport and land use planning procedures and organizations. The latter, of course, is also essential in enabling a shift to an integrated, accessibility centred policy focus, as underlined by Papa et al. (Citation2016), and for the Dutch context by Duffhues and Bertolini (Citation2015). Future research could try and disentangle the relative contribution of this different kind of barriers to policy integration, and explore pathways to break through the barriers.
In regard to lessons for contexts other than Almere and Rotterdam, including outside of the Netherlands, the main contribution of the paper is that of an enhanced understanding of the added value and possible drawbacks of a focus of planning on enhancing accessibility relative to current ways of planning transport and land use. Participants and problems will be different in each context, possibly leading to other choices in terms of type and specification of accessibility measures (see for some directions Papa et al., Citation2016). However, as long as these measures (1) reflect the basic notion of accessibility embraced in this paper, (2) can be related to the goals policy makers find important and (3) strike an acceptable balance, between theoretical soundness and usability of the measure by professionals, the process is likely to increase the awareness of the land-use implications of transport interventions and help shape planning strategies informed by that awareness. At the same time, we pointed at the need of finding ways to combine accessibility-focused planning with more traditional mobility-focused planning. Future research could usefully focus on further articulating this combination, including on how to embed it in day to day planning practice.
Disclosure statement
No potential conflict of interest was reported by the authors.
Additional information
Funding
Related Research Data
References
- Banister, D. (2005). Unsustainable transport. London and New York: Spon.
- Bertolini, L. (2012). Integrating mobility and urban development agendas: a manifesto. disP-The Planning Review, 48(1), 16–26. doi: https://doi.org/10.1080/02513625.2012.702956
- Bertolini, L. (2017). Planning the mobile metropolis: Transport for people, places and the planet. London: Macmillan International Higher Education. doi: https://doi.org/10.1057/978-1-137-31925-8
- Bertolini, L., Le Clercq, F., & Kapoen, L. (2005). Sustainable accessibility: a conceptual framework to integrate transport and land use plan-making. Two test-applications in the Netherlands and a reflection on the way forward. Transport Policy, 12(3), 207–220. doi: https://doi.org/10.1016/j.tranpol.2005.01.006
- Bertolini, L., Curtis, C., & Renne, J. (2012). Station area projects in Europe and beyond: Towards transit oriented development? Built Environment, 38(1), 31–50. doi: https://doi.org/10.2148/benv.38.1.31
- Bruegmann, R. (2008). Point: Sprawl and accessibility. Journal of Transport and Land Use, 1, 5–11. doi: https://doi.org/10.5198/jtlu.v1i1.30
- Duffhues, J., & Bertolini, L. (2015). From integrated aims to fragmented outcomes: Urban intensification and transportation planning in the Netherlands. Journal of Transport and Land Use, 9(3). doi: https://doi.org/10.5198/jtlu.2015.571
- Geerlings, H., & Stead, D. (2003). The integration of land use planning, transport and environment in European policy and research. Transport Policy, 10, 187–196. doi: https://doi.org/10.1016/S0967-070X(03)00020-9
- Gemeente Rotterdam, Ministerie van Verkeer en Waterstaat, Provincie Zuid-Holland and Stadsregio Rotterdam. (2009). Masterplan Rotterdam Vooruit. Rotterdam: Projectorganisatie Rotterdam Voorruit.
- Geurs, K. T., de Bok, M., & Zondag, B. (2012). Accessibility benefits of integrated land use and public transport policy plans in the Netherlands. In K. T. Geurs, K. J. Krizek, & A. Reggiani (Eds.), Accessibility analysis and transport planning challenges for Europe and North America (pp. 135–153). Cheltenham, UK: Edward Elgar.
- Geurs, K. T., De Montis, A., & Reggiani, A. (2015). Recent advances and applications in accessibility modelling. Computers, Environment and Urban Systems, 49, 82–85. doi: https://doi.org/10.1016/j.compenvurbsys.2014.09.003
- Geurs, K. T., & Ritsema van Eck, J. R. (2001). Accessibility measures: Review and Application. Utrecht: RIVM.
- Geurs, K. T., & van Wee, B. (2004). Accessibility evaluation of land-use and transport strategies: Review and research directions. Journal of Transport Geography, 12, 127–140. doi: https://doi.org/10.1016/j.jtrangeo.2003.10.005
- Giuliano, G. (2004). Land-use impacts of transportation investments. In S. Hanson and, & G. Giuliano (Eds.), The Geography of urban transportation (pp. 237–273). New York: The Guildford Press.
- Halden, D. (2002). Using accessibility measures to integrate land-use and transport policy in Edinburgh and the Lothians. Transport Policy, 9, 313–324. doi: https://doi.org/10.1016/S0967-070X(02)00017-3
- Hamers, D., Snellen, D., Breedijk, M., Hilbers, H., Nabielek, K., & Tennekes, J. (2014). Kiezen én delen. Strategieën voor een betere afstemming tussen verstedelijking en infrastructuur. Den Haag: Planbureau voor de leefomgeving. (PBL).
- Handy, S. (2002). Accessibility- vs. mobility-enhancing strategies for addressing automobile dependence in the U.S. Presented at the European conference of ministers of transport, 2002.
- Handy, S. (2008). Regional transportation planning in the US: An examination of changes in technical aspects of the planning process in response to changing goals. Transport Policy, 15(2), 113–126. doi: https://doi.org/10.1016/j.tranpol.2007.10.006
- Handy, S., & Niemeier, D. A. (1997). Measuring accessibility: An exploration of issues and alternatives. Environment and Planning A: Economy and Space, 29(7), 1175–1194. doi: https://doi.org/10.1068/a291175
- Hull, A. (2012). Transport matters. Abingdon/New York: Routledge.
- Jones, P. (2011). Developing and applying interactive visual tools to enhance stakeholder engagement in accessibility planning for mobility disadvantaged groups. Research in Transportation Business and Management, 2, 29–41. doi: https://doi.org/10.1016/j.rtbm.2011.08.001
- Levinson, D. M., & Krizek, K. J. (2008). Planning for place and plexus. London/New York: Routledge.
- McDonough, W., & Baungart, M. (2002). Cradle to cradle, remaking the way we make things. New York: North Point Press.
- Metropoolregio Amsterdam, Noord-Holland and Flevoland. (2009). Gebiedsagenda Noordwest Nederland Amsterdam.
- Meyer, M. D., & Miller, E. J. (2001). Urban transportation planning (2nd ed.). New York: Mc Graw Hill.
- Ministerie van Binnenlandse Zaken. (2011). Zuid werkt! Nationaal programma kwaliteitssprong Zuid, Kamerstuk 26 September 2011. Den Haag: Ministerie van Binnenlandse Zaken.
- MuConsult B.V. and Move Mobility. (2014). De SVIR bereikbaarheidsindicator, handleiding voor toepassing in MIRT en Beter Benutten. Den Haag: Ministerie van Infrastructuur en Milieu.
- Papa, E., Silva, C., te Brömmelstroet, M., & Hull, A. (2016). Accessibility instruments for planning practice: A review of European experiences. Journal of Transport and Land Use, 9(3), 57–75.
- Preston, J., & Rajé, F. (2007). Accessibility, mobility and transport-related social exclusion. Journal of Transport Geography, 15(3), 151–160. doi: https://doi.org/10.1016/j.jtrangeo.2006.05.002
- Prud'homme, R., & Lee, C. (1999). Size, sprawl, speed and the efficiency of cities. Urban Studies, 36(11), 1849–1858. doi: https://doi.org/10.1080/0042098992638
- Rijk, Provincies Noord-Holland, Flevoland en Utrecht, Gemeenten Almere en Amsterdam. (2013). Bestuursovereenkomst RRAAM: Rijk-Regioprogramma Amsterdam – Almere – Markermeer. Den Haag: Ministerie van Infrastructuur en Milieu.
- Rijkswaterstaat. (2007). Mobiliteitsonderzoek Nederland 2007: Tabellenboek. Den Haag: Rijkswaterstaat.
- Silva, C., Bertolini, L., Te Brömmelstroet, M., Milakis, D., & Papa, E. (2017). Accessibility instruments in planning practice: Bridging the implementation gap. Transport Policy, 53, 135–145. doi: https://doi.org/10.1016/j.tranpol.2016.09.006
- Snellen, D., Hilbersand, H., & Hendriks, A. (2005). Nieuwbouw in beweging. Een analyse van het ruimtelijk mobiliteitsbeleid van VINEX. Rotterdam: Ruimtelijk Planbureau, NAI Uitgevers.
- Straatemeier, T., & Bertolini, L. (2008). Joint Accessibility Design: a framework developed for and with practitioners to stimulate the integration of regional land-use and transport strategies in the Netherlands. Transportation Research Record, 2077, 1–8. doi: https://doi.org/10.3141/2077-01
- Transportation Research Board. (2001). Making transit work, TRB. Special report 257. Washington D.C.: National Academy Press.
- Wegener, M., & Fürst, F. (1999). Land-use transport interaction: State of the art. Report. 46. Institutfür Raumplanung, Dortmund, 1999.