?Mathematical formulae have been encoded as MathML and are displayed in this HTML version using MathJax in order to improve their display. Uncheck the box to turn MathJax off. This feature requires Javascript. Click on a formula to zoom.
ABSTRACT
A key objective of the EU Framework Programmes for Research and Innovation is the creation of cross-country research networks. We make use of Social Network tools to describe the evolution of the EU research network across countries on the basis of unique data covering collaborative projects launched during the first four years of implementation of Horizon 2020 and its predecessor programmes, the Sixth and Seventh Framework Programme. We describe the positioning of all EU-countries in the collaborative research network, the positioning of the older member EU-15 and the newer member EU-13 countries in particular, and to what extent the network has been subject to change during the period 2003–2017. EU-15 and EU-13 countries have become more integrated, and some organizations fulfil a bridging function in the EU research network. EU-13 countries are more heavily engaged in parts of the programme on lower complexity research activities.
1. Introduction
A key objective of the European Research Area is to stimulate research collaboration and knowledge diffusion in the European Union through the Framework Programmes (FP) that represent one of the largest transnational efforts worldwide, funding thousands of collaborative research and innovation (R&I) projects (European Commission, Citation2017, Citation2018). The FPs offer collaboration opportunities for researchers. The majority of the budget of the current FP, Horizon 2020, is spent on supporting such collaboration through collaborative R&I projects. To fully reap the benefits of collaborative R&I, it is important that the research network remains open and easily accessible to new participants. In this context, a good understanding of the way countries and organizations collaborate within the FP is crucial.
The main objective of the paper is to present the Horizon 2020 research network making use of Social Network Analysis tools. This collaborative research network across countries is constructed on the basis of unique data covering collaborative projectsFootnote1 launched during the first four years of implementation of Horizon 2020. The data is drawn from the Common Research Data Warehouse (CORDA)Footnote2. It includes data on the Horizon 2020 programmeFootnote3 as well as full data on the implementation of its predecessor programmes, the Sixth and the Seventh Framework Programme for Research and Technological Development (FP6 and FP7)Footnote4. We describe the positioning of all EU-countries in this collaborative research network, and in particular the positioning of the older member EU-15 versus newer member EU-13 countries that joined the EU after 2004. Our findings show that the two groups of countries have become more integrated during the period 2003–2017, and that some organizations fulfil a bridging function in this overall research network. However, the EU-13 countries tend to focus more on parts of the programmes that deal with low complexity research activities.
We structure the paper as follows. First, we briefly review the literature on research collaboration in the EU. Then, we analyze the research collaboration network under Horizon 2020, with particular attention to the positioning of EU-15 and EU-13 countries. Moreover, we take a dynamic perspective, including data on FP6 and FP7, to assess how the EU research collaboration network has changed over time. Finally, we conclude.
2. Collaborative research networks in the EU
Knowledge is a crucial asset for economic development. Countries engage in research to produce new knowledge to gain competitiveness (Foray, Citation2004). To an increasing extent, knowledge production is the outcome of a collective activity in which agents interact and recombine existing knowledge in novel ways. This is especially true for production of complex knowledge that requires inputs from other agents (Jones, Citation2009). This is reflected in a persistent increase of collaborative research over time (Tijssen, Citation2008; Wuchty, Jones, & Uzzi, Citation2007; Wouden & Rigby, Citation2017). Collaborative research is promoted by public policy because it would tackle the problem of fragmentation of research, provide savings in the cost of research, contribute to avoiding duplication of research effort, and facilitate knowledge spillovers and cross-fertilization of ideas between firms and between firms and other organizations, such as universities (Katz & Martin, Citation1997). There is some evidence that such spillover effects do indeed exist, for instance on inventive output (see e.g. Broekel, Citation2015; Czarnitzki & Fier, Citation2003; Hazir, LeSage, & Autant-Bernard, Citation2016; Hoekman, Scherngell, Frenken, & Tijssen, Citation2013; Wanzenbock, Scherngell, & Brenner, Citation2014; Uhlbach, Balland, & Scherngell, Citation2017).
The European Union is very active in promoting collaborative R&I projects through its Framework Programmes, such as Horizon 2020. While the main objective is to reduce the spatial barriers to research collaboration, the question is whether this leads to a level playing field among countries and contributes to reducing spatial disparities across Europe, as targeted by Cohesion policy through the Structural Funds. Studies (e.g. Autant-Bernard, Billand, Frachisse, & Massard, Citation2007; Maggioni & Uberti, Citation2009; Moreno, Paci, & Usai, Citation2005) have expressed concerns in this respect, claiming there is a natural tendency of research activity to concentrate in space when national barriers are removed and freedom of movement of knowledge and researchers is established.
Network theory would predict that the structure of knowledge networks is often skewed, that is, some countries or regions are highly connected, while others are poorly or not connected at all (Giuliani, Citation2007; Huggins & Thompson, Citation2014; Maggioni, Nosvelli, & Uberti, Citation2007; Powell, White, Koput, & Owen-Smith, Citation2005). This may be due to features of countries (such as absorptive capacity), forms of proximities between countries (e.g. geographical proximity) that reduce search and coordination costs, and network positions of countries (like being a hub in the overall network) (e.g. Balland, Citation2012; Balland, de Vaan, & Boschma, Citation2013; Boschma & Frenken, Citation2010, Citation2018; Breschi & Lissoni, Citation2009; Cassi & Plunket, Citation2015; Ponds, van Oort, & Frenken, Citation2010; Scherngell & Lata Citation2013; Singh, Citation2005; Stuck, Broekel, & Revilla Diez, Citation2016; Ter Wal, Citation2014; Tsouri, Citation2018). Countries prefer to collaborate with other countries that show research excellence (Hoekman, Citation2012), are close geographically (Scherngell & Barber, Citation2009), have been engaged in previous collaborations (Breschi & Lissoni, Citation2009), share similar knowledge (Gilsing, Nooteboom, Vanhaverbeke, Duysters, & van den Oord, Citation2007; Nooteboom, Citation2000) and common institutions (like language), and form a hub in the network (Vicente, Balland, & Brossard, Citation2011). All these factors tend to contribute to a self-reinforcing tendency in the spatial evolution of knowledge networks (Barabasi & Albert, Citation1999; Glückler, Citation2007).
This has led to recurrent concerns that FP funding runs the risk of reproducing or even deepening already existing divides in research excellence across countries in the European Union (e.g. Autant-Bernard et al., Citation2007; Breschi & Cusmano, Citation2004; Olechnicka, Ploszaj, & Celinska-Janowicz, Citation2019; Paier & Scherngell, Citation2011; Wanzenbock et al., Citation2014). Another obstacle to full integration of the knowledge network in the EU is that countries may lack the absorptive capacity. This implies it remains a challenge to reconcile the pursuit of excellence through R&I policy and inclusive growth and income convergence across countries and regions in the EU (Farole, Rodriguez-Pose, & Storper, Citation2011; Hoekman, Citation2012). In this respect, serious concerns have been voiced that the older EU member states (EU-15) continue to take up the lion share of FP funding. Although the newer EU-13 member states are participating in the FP to an increasing extent (Radosevic & Yoruk, Citation2014), they are not in terms of their relative participation rate compared to EU-15, and the effect on innovation has been modest (Radosevici & Ciampi Stancova, Citation2018). This spatial imbalance of research and innovation performance is persistent over time, despite massive efforts by the EU through Cohesion Policy and its Structural Funds to tackle such disparities.
Having said that, research also shows that FP funding is more evenly distributed across regions in the EU than often expected, and that there are some signs of a positive impact of FP funding in lagging regions (Hoekman et al., Citation2013). De Noni, Orsi, and Belussi (Citation2018) has identified a positive effect of collaboration of lagging-behind European regions with especially knowledge-intensive regions on their innovative performance. In this respect, it is crucial to know which countries take up a bridging position in the overall knowledge network, connecting different parts of the network that enable the diffusion of knowledge across countries (Breschi & Lenzi, Citation2015; Broekel & Mueller, Citation2018; Burt, Citation2004; Fleming, Mingo, & Chen, Citation2007; Graf, Citation2011; Morrison, Citation2008). The question is whether EU-13 countries are capable of acting as gatekeepers, and if so, which organizations have taken up that role.
The degree and nature of participation of countries in the EU network may also depend on the complexity of research that is involved in FP projects. However, little is known about how complexity affects the structure of the knowledge network of the EU. Sorenson, Rivkin, and Fleming (Citation2006) showed that the diffusion of more complex knowledge requires more proximate actors. Hidalgo and Hausmann (Citation2009) argued that the more complex knowledge is, the fewer countries will actually participate in the production of such new knowledge, which they define as non-ubiquitous knowledge. Balland and Rigby (Citation2017) provided empirical evidence for this, showing that the more complex technologies are more spatially concentrated. We will test whether a functional spatial division of labour actually exists within the European research space by looking at the participation of EU countries. We hypothesize that the EU-13 countries participate in those programmes that are associated with lower complexity, as compared to EU-15 countries that might participate more in higher complexity programmes.
With the use of unique and recent data, we describe the structure of the collaborative research networks under the Horizon 2020 programme, employing sophisticated network tools. We will focus particular attention on the position of EU-13 countries, as compared to the EU-15 countries. We examine the extent to which EU-13 countries have been successful in participating in the EU collaborative research network, how that has changed over time since the launch of the 6th FP in 2003, whether EU-13 countries have gained access to gatekeepers in the overall network, and to what extent they participate in projects on complex activities.
3. The Horizon 2020 network
Since 2014, Horizon 2020 has been funding a large number of collaborative projects, involving a massive network of collaborations between R&I stakeholders. Over 2014–2017, Horizon 2020 funded more than 7,500 collaborative projects among 23,664 participants from 149 countries, resulting in almost 1.5 million of one-to-one opportunities to collaborateFootnote5. The strongest connections are represented as a country-country graph in .
Figure 1. The H2020 Collaboration Network. Source: Author’s calculations based on CORDA data.
Note: This graph represents the backbone of Horizon 2020. Nodes are countries, and links represent strongFootnote15 connections based on Horizon 2020 projects. EU-15 countries are represented in blue, EU-13 countries are represented in orange, Associated Countries (AC) are represented in green. Non-associated third countries (TC) countries are not represented on the graph.
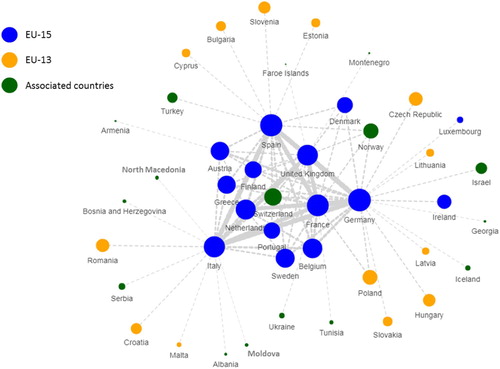
The figure shows two types of connections: (i) the single strongest connection of each country to another country, and (ii) the top 40 strongest connections in the network. Centrality can be defined as the importance of a country in the network. This importance as such can have different meanings, hence different definitions, with the most straightforward definition being based on the number of connections of a country’s participants in the whole network. The size of the nodes is proportional to the centrality of the country. The figure shows that the core of the network is mainly composed of EU-15 participants. Germany, France, the UK, Italy, and Spain appear to be key players in the network of participations to Horizon 2020.
EU-13 participants have a substantial number of collaborations with the largest players in the network, which are participants from EU-15 countries. As a result, German participants are frequent partners of several EU-13 countries, such as Czech Republic, Hungary, Latvia, Lithuania and Slovakia. Croatia, Malta and Romania present strong ties with Italy, while Bulgaria, Cyprus, Estonia and Slovenia tend to connect with Spanish participants. Important collaborators of Polish participants are French participants.
It is important to understand which countries occupy central positions in the network. Overall, as shown in the interim evaluation of Horizon 2020 (European Commission, Citation2017), the most connected countries are also the largest ones (). The most connected country is Germany, with around 12% of the collaborations within the network involving German participants, followed by Spain (11%), Italy (10%), and France (10%). Overall, 79.3% of the collaborations involve participants from EU-15 countries against 9.8% for EU-13 countries (and respectively 6.6% and 4.2% for associated and third countries). Poland is the EU-13 country with most connections (1.8% of all connections).
Figure 2. Country size and share of connections under Horizon 2020. Source: Author’s calculations based on CORDA data.
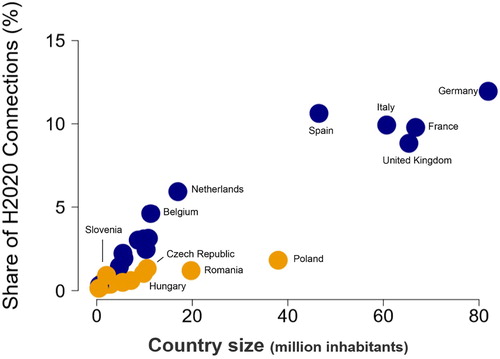
While size effect appears to be important, also shows that some countries with similar size perform differently in terms of collaborations: although population in Romania and the Netherlands are close, Dutch participants are responsible for a much higher share of connections in the Programme (6%) than Romanian participants (1.2%). On the other hand, smaller countries like Slovenia present almost as many connections as countries with a population that is five times larger or more like Hungary, Czech Republic and Romania. The graph also highlights a significant gap between Poland and Spain, with Spanish participants being involved in almost four times more collaborations than Polish participants despite the fact that both countries have a large population.
The position of countries can be more precisely assessed with different centrality measures. Centrality can be defined as the importance of a node (here a participant) in the network. This importance as such can have different meanings, hence different definitions. Using data on Framework Programmes’ project participations, a network of participants was constructed, represented by an n × n matrix X = (xij), where xij represents the number of connections between participant i and participant j (i, j = 1, … , n).
The positions of participants are analysed in this global network using four different metrics: degree centrality, eigenvector centrality, network hubs, and EU15-EU13 gatekeeping position. Degree centrality refers to the number of direct connections of a given node, and is computed as follows: Eigenvector centrality takes into account the centrality of participants a participant is connected to. Eigenvector centrality takes into account the whole network structure, and is equal to the leading eigenvector of the column stochastic n × n matrix X = (xij) - whose leading eigenvalue is 1:
.
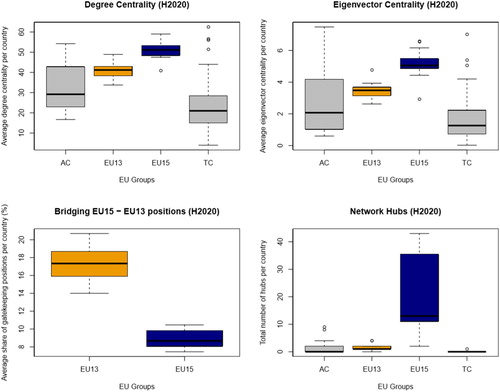
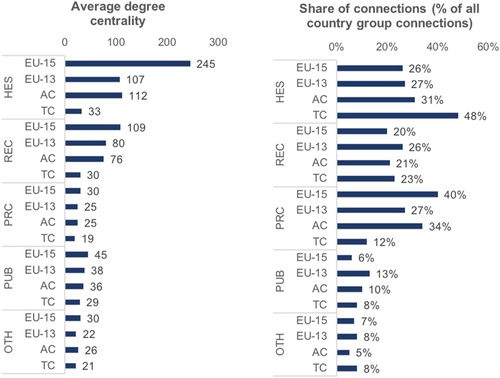
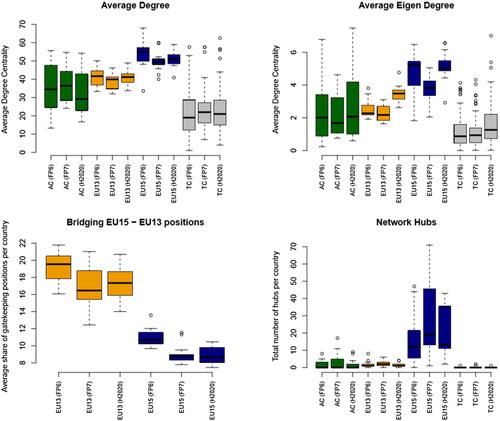
As shown in , centrality measures show that participants from EU-15 countries tend to be more central than participants from EU-13 countries, associated countries and third countries in Horizon 2020. There are, however, important variations, with some EU-13 participants being more central than many EU-15 participants. Both in terms of degree centrality (number of direct connections) and eigenvector centrality (tendency to be linked to nodes that are themselves central), participants from EU-15 countries appear to be on average more central than participants from other country groupsFootnote6. The average degree centrality of EU-15 participants is 50, compared to 41 for EU-13 participants, 42 for participants from associated countries and 28 for participants from third countries, indicating more direct connections for EU-15 participants. The influence of a country in the network can also be measured by examining whether participants are linked to other important participants (i.e. participants with many connections). This is measured by the eigenvector centralityFootnote7 that is also significantly higher on average for EU-15 participants (5.33) than EU13 countries (3.52).
Figure 3. Centrality measures in Horizon 2020Footnote16. Source: Author’s calculations based on CORDA data.
Note: All network measures are first computed at the participant-level, and then summed up/averaged at the country level. The boxplots in this figure show the distributions of these measures at the country level (thick line = median, limits of the box = interquartile interval, upper and lower whiskers = greatest and lowest values excluding outliers). Degree centrality, for instance, represents the distribution of the average degree centrality of participants at country level. AC = associated countries, TC = third countries.
EU15-EU13 gatekeeping positions are derived from betweenness centrality and reflect the number of times a participant i connects an EU-15 participant j with an EU-13 participant k (i.e. the number of times i lies on the shortest path between EU-15 and EU-13 participants). Let’s σj,k be the total number of shortest paths from node j (EU13) to node k (EU 15), and σj,k (i) the total number of shortest paths from node j (EU13) to node k (EU 15) that passes through i. The EU15-EU13 gatekeeping position can be computed as . We present the share of EU15-EU13 gatekeeping positions that is obtained by dividing
by
(overall gatekeeping). Network hub is a dummy variable (0/1) that takes value 1 if a participant belongs to the top 2% of both the degree and eigenvector centrality distribution.
As shown in , while EU-15 participants more frequently play a role of hub in the network, critical intermediaries between EU-13 and EU-15 participants are more represented by EU-13 organizations. Most network hubs (participants having a significantly larger number of connections in the network) are EU-15 participants. However, key gatekeeping positions are much more present in the EU-13 compared to the EU-15. This means that EU-13 organizations very often act as a bridge between EU-15 organizations and EU-13 organizations. This result is not surprising because EU-15 countries participate more than EU-13 countries. Hence, the likelihood to have one EU-13 participant in a project with a majority of EU-15 participants is higher than the other way around. This highlights that EU13 organizations have a ‘broker’ or ‘gatekeeper’ role for linking a large number of organizations that would not be connected otherwise. Slovakia, Latvia, Malta and Estonia are the top 4 countries in which participants have the strongest gatekeepers profile between EU-13 and EU-15 participants.
As shown in , higher education institutions are the real hubs of the network in general. They present significantly higher centrality measures compared to other types of participants, in particular a very high average degree centrality of 144 compared to 87 for research organization, 42 for public bodies and 29 for private companies. Many higher education institutions also play the role of hubs in the network: 233 hubs universities under Horizon 2020, which is more than all other types of participants together. Research centres seem to be the second more central type of organization, followed by public organizations.
Table 1. Network statistics by type of organization (Horizon 2020).
On the other hand, private companies report low centrality measures, which means that they are not as central as other types of organizations. This contrast with their significantly large number of connections compared to other types of organizations. illustrates this. The figure shows that 40% of the connections of EU-15 include private companies. The private sector is actually the most important sector in terms of number of collaborations for all country groups, except for third countries where higher education institutions are responsible for almost half the connections within the network. However, private companies are also characterized by a larger number of one-shot collaborations. As a consequence, they present particularly low average centrality measures compared to other types of organizations, especially compared to higher education institutions. Another important observation is that the centrality of private companies in the whole network is similar between EU-15 countries, EU-13 countries and associated countries, while the centrality of higher education institutions in the EU-15 countries is significantly larger than in other country groups.
Figure 4. Centrality by type of organization and by country group (Horizon 2020). Source: Author’s calculations based on CORDA data.
Note: REC = research organizations, PUB = public bodies, PRC = private sector, HES = higher education institutions, OTH = other participants. AC = associated countries, TC = third countries.
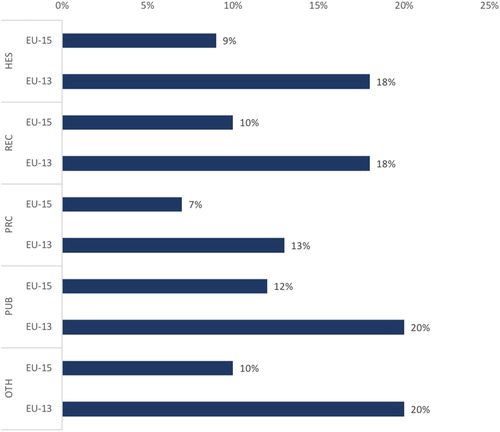
When looking at collaborations between EU-13 and EU-15 participants (), participants acting as intermediaries (gatekeepers) are more frequent within public bodies (13%) compared to other types of organizations. Only 8% of companies play this bridging role. Hence, while the interim evaluation of Horizon 2020 (European Commission, Citation2017) showed that EU-15 companies can represent significant numbers of connections with EU-13 participants, corresponding to massive bridges with EU-13 participants, this broker role is not as frequent for them as for other types of participants. As mentioned above, this bridging role is much more frequent within EU-13 participants. shows the differences in this role by type of participant for EU-13 and EU-15 countries. EU-13 participants are almost always twice more active in this gatekeeping role than EU-15 participants, regardless of the type of organization. At the bottom, only 7% of EU-15 private companies are bridging EU-15 and EU-13 participants. The most active gatekeepers are EU-13 research organizations, public bodies and higher education institutions (20%). The top EU-15 participants that present the largest numbers of collaborations with EU-13 participants in Horizon 2020 are Fraunhofer (DE), CNR (IT), CNRS (FR), CEA (FR) and VTT (FI). The top 5 EU-15 participants that present the highest share of collaborations with EU-13 participants in their collaborations are ENEA (IT), NERC (UK), CINECA (IT), UoA (EL) and JUELICH (DE).
Figure 5. Bridging EU-15 - EU-13 positions (share of gatekeeping positions by type of organization and country group). Source: Author’s calculations based on CORDA data.
Note: REC = research organizations, PUB = public bodies, PRC = private sector, HES = higher education institutions, OTH = other participants.
The large number of connections between EU-13 countries and a few EU-15 countries can be partly explained by the larger number of participations of these EU-15 countries in Horizon 2020. A normalization process can be implemented to control for this. shows the country relatedness network, which expresses collaboration preferences between countries. To compute this relatedness, the number of connections between two countries is divided by the number of connections expected by chanceFootnote8, i.e. based on the amount of participations of both countries (Balland, Boschma, Crespo, & Rigby, Citation2018; Hidalgo, Klinger, Barabási, & Hausmann, Citation2007). In , the top four strongest connections of each country are represented. As a result, participants appear to show very specific preferences in their cross-country collaborations. Several clusters of countries can be observedFootnote9. Countries in a cluster of strong preferences are represented by the same colour. Participants from Baltic countries, Czech Republic and Slovakia tend to collaborate more with each other than what would be expected statistically (green cluster). Cyprus, Greece, Ireland, Luxembourg, Malta, and Portugal form another group of preferred connections (yellow cluster). These two groups bridge to some extent the other two clusters, which are formed respectively by large EU-13 countries (pink cluster) and large EU-15 countries (blue cluster). Overall, these preferences suggest that different forms of proximity, including cultural and geographical proximities tend to shape the structure of the Horizon 2020 network.
Figure 6. The H2020 Country-Relatedness Network (between EU15 and EU13 countries). Source: CORDA data.
Note: Colours based on community structure (Blondel, Guillaume, Lambiotte, & Lefebvre, Citation2008). The top four strongest connections (after normalization) of each country are represented. A plain link indicates that the connection is in the top four connections of both countries. A dashed link indicates that the connection is in the top four of one of both countries. The size of the nodes is proportional to country centrality without normalization.
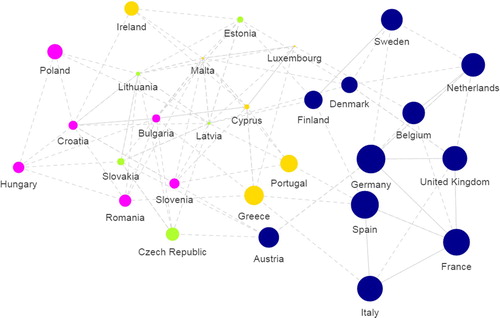
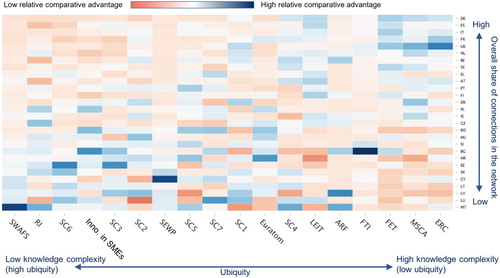
Figure 7. Ubiquity of programme parts and EU-13 centrality (Horizon 2020). Source: Author’s calculations based on CORDA data.
Note: Acronyms for programme parts in Annex. Some programme parts like ERC or MSCA only present a minority of projects with collaborations.
As shown in , higher education institutions are the real hubs of the network in general. They present significantly higher centrality measures compared to other types of participants, in particular a very high average degree centrality of 144 compared to 87 for research organizations, 42 for public bodies and 29 for private companies. Many higher education institutions also play the role of hubs in the network: 233 hubs universities under Horizon 2020, which is more than all other types of participants together. Research centres seem to be the second more central type of organization, followed by public organizations.
Not all countries participate in the same proportion in the different parts of the Programme. This proportion directly affects the importance or centrality of a specific country in the different programme parts (see Annex for definition of the acronyms and for the number of connections by country and by programme part). Following Hidalgo and Hausmann (Citation2009), we measure the so-called ubiquity of a programme as the number of countries that have a relative comparative advantage in a specific programme part. Relative comparative advantage is a measure of specialization, i.e. a participant participates more than what could be expected by chance. The country–project FP networks are operationalized as a n x k two-mode matrix M = (Mc,i), where Mc,i reflects whether a country c has a relative comparative advantage (RCA) in the participation of programme part i (c = 1,. . ., n; i = 1, . . ., k). A country c has RCA in programme part i at time t if the share of projects i in the country's portfolio is higher than the share of projects i in the entire FP portfolio. Ubiquity is the 2-mode degree centrality of programme parts (Ki,0) and is given by the number of countries that exhibit RCA in a particular programme part: .
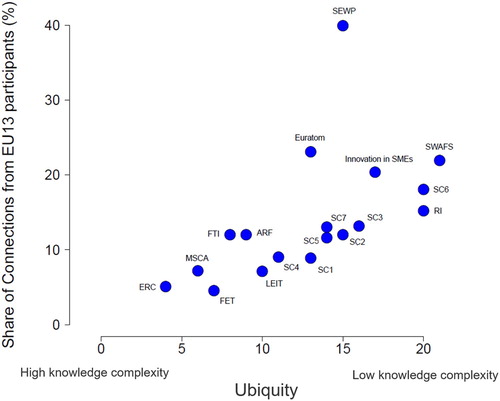
shows that there is a pattern that can be observed when linking the ubiquity of the programme parts (parts that are more ‘common’ amongst countries) with the proportion of connections from EU-13 participants. Ubiquity has been shown to reflect the underlying knowledge complexity of products and technologies (Balland & Rigby, Citation2017), and could therefore be interpreted as a measure of how difficult it is for a country to be a leader in a specific programme part. The figure shows that EU-13 and EU-15 participants are not central in the same programme parts. As expected, EU-13 participants are much more central in programme parts with a lower level of knowledge complexity (i.e. presenting high level of ubiquity), while EU-15 participants dominate more complex programme parts.
The level of knowledge complexity reflects the fact that only few countries have a relative comparative advantage in the participation of a programme part. shows the relative comparative advantages of countries by programme parts when countries are ranked by decreasing overall centrality (share of connections) from top to bottom, and programme parts are ranked with increasing complexity from left to right. The pattern of colours indicates that high relative comparative advantages (blue) can be found in the top right and bottom left parts of the matrix, while lower relative comparative advantages (red) dominate the top left and bottom right parts. This reflects the idea that countries that are less central are also countries that have a lower relative comparative advantage in more complex programme parts and higher comparative advantage in less complex programme parts.
Figure 8. Relative comparative advantage of countries by programme part (Horizon 2020). Source: Author’s calculations based on CORDA data.
Note: Acronyms for programme parts in Annex. Blue indicates high comparative advantage and red indicates low comparative advantage. Darker blue or red indicate respectively higher or lower values.
4. Is the Horizon 2020 network more open?
As shown in the previous section, the size of countries in Horizon 2020 is a key determinant of their central position in the network. However, it is important to examine how the situation has evolved over time, between FP6 and FP7, and between FP7 and Horizon 2020.
On average, participants are slightly less central in the network in FP7 and Horizon 2020 compared to FP6. The average centrality degree of participants was 50 in FP6, while it became about 46 in FP7 and 47 Horizon 2020. This might signal the entry of smaller players, and indicate that the network tends to be opening to less connected participants. To confirm this intuition, we need to turn to other network indicators.
One such network indicator is the transitivity coefficient which measures the likelihood for a participant to be connected to a collaborator of a collaborator. As shown in , participants appear to be more likely in Horizon 2020 than in FP7 to collaborate with partners of their own partners, i.e. the transitivity of collaborations has increased. This signals that participants rely more on information they receive from their own partners to create new collaborations, which could be reflected by higher clustering behaviours within the network.
Table 2. Evolution of the network.
Another network indicator is the assortativity coefficient. It measures the extent to which nodes in a network associate with other nodes in the network, being of a similar or opposing sort. The assortativity of the network is determined for the degree (number of direct neighbours) of the nodes in the network. If the assortativity coefficient is negative, the hubs tend to be connected with non-hubs, and vice versa. shows that the assortativity coefficients are negative in all 3 Framework Programmes: participants acting as hubs (with high degree centrality) seem to connect more likely with other types of participants (non-hubs, with low degree centrality). This suggests key actors in the network have maintained a certain level of openness to other participants throughout the different programmes.
Network Gini coefficients measure the level of structural inequality in a network. It ranges from 0 (perfect equality, with all participants having the same number of connections) to 1 (perfect inequality). shows that the network inequality coefficients are stable over time: the degree distribution has remained relatively similar between the Framework Programmes, with coefficient being 0.66, 0.67, and 0.65 respectively for FP6, FP7 and Horizon 2020. These coefficients suggest that few organizations have many connections, while most organizations have only a few, which is a general tendency of real-world complex networks. This aspect of the network has not been reinforced over time.
Average path length measures the average number of steps along the shortest paths for all possible pairs of network nodes. It is a measure of information flow efficiency in a network. shows the average path length between participants has remained close to 3, meaning that on average a participant can be connected to any other participant in the network within 3 connections (‘degrees of separation’). This measure is relatively small, indicating a highly-connected network in general. The average path length has not changed much over time.
Has the position of country groups changed? The centrality of country groupsFootnote10 has remained stable over time. shows little change in the ranking between country groups of average centrality measures between FP6 and Horizon 2020. Between FP6 and FP7, EU-13 and EU-15 participants seem to have become less central in the network, while the central position of participants from associated countries and third countries was reinforced. However, between FP7 and Horizon 2020, the centrality in the network of both EU-15 and EU-13 countries improved. Based on the number of hubs, the position of EU-15 countries appears to be less dominant in Horizon 2020 compared to FP7.
Figure 9. Evolution of centrality measures. Source: Author’s calculations based on CORDA data.
Average path length measures the average number of steps along the shortest paths for all possible pairs of network nodes. It is a measure of information flow efficiency in a network. shows the average path length between participants has remained close to 3, meaning that on average a participant can be connected to any other participant in the network within 3 connections (‘degrees of separation’). This measure is relatively small, indicating a highly-connected network in general. The average path length has not changed much over time.
In order to look at the potential opening of the network over time, it is important to assess the persistence of collaborations. A network that is structured in ‘closed clubs’ will be characterized by a large amount of persistent collaborations, compared to new or lost collaborations. This is proxied by the Jaccard index that measures the structural distance between networks from one period to the next (Ripley, Snijders, Boda, Voros, & Preciado, Citation2016). It is computed by using information on the number of new ties (Nnew), the number of lost ties (Nlost), and the number of ties maintained (Nmaintained) from one period to the next: . This index is used here to assess the similarity of the connections between FP6 and FP7, and between FP7 and Horizon 2020. A Jaccard coefficient of 1 indicates perfect stability (no changes from one FP’s network to the next), while a Jaccard coefficient of 0 indicates that none of the connections made in one FP is repeated in the next one. As shown in , the network of participations to the FP’s seems to be very dynamic over time. Jaccard indexes for FP6, FP7 and Horizon 2020 are quite lowFootnote11, which indicates that partners are highly likely to change over time. Between FP6 and FP7, about 1,226,970 new connections between partners were created, while 166,508 connections were maintained, and 772,822 were lost. Between FP7 and the first four years of Horizon 2020, 909,444 new connections were made, against 195,474 maintained and 1,198,004 lost. Because of this large ratio of new and lost connections in Horizon 2020 to maintained connections, Jaccard indexes are especially low in Horizon 2020, and suggests a more dynamic network compared to previous Framework Programmes.
Figure 10. Persistence of connections in the network (maintained, new and lost connections between FP’s). Source: Author's calculations based on CORDA data.
Note: Left axis: number of connections. Right axis: Jaccard index (x100). All = all projects, EU-13 = all projects with at least 1 EU-13 organization, EU-15 = all projects with at least 1 EU-15 organization.
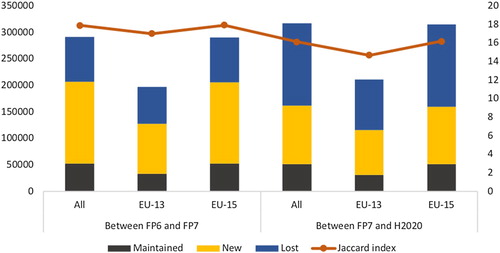
Jaccard indexes are lower for EU-13 than for EU-15 countries, showing that EU-13 countries participants have to some extent a higher propensity to be involved in new collaborations than participants from EU-15 countries. This effect is especially striking in Horizon 2020: participants from EU-13 countries have managed to generate a relatively large amount of new collaborations compared to EU-15 participants. However, both country groups seem to have more new collaborations between FP7 and Horizon 2020, than between FP6 and FP7.
In particular, are EU15-countries opening up to EU-13 countries? As shown in , while EU-15 participants seem to have been closing to some extent their collaborations to EU-13 participants between FP6 and FP7, they appear to have opened up to EU-13 participants with Horizon 2020. In FP6, the percentage of connections between EU-15 participants and EU-13 participants was 14.4% of all collaborations from EU-15 participants. While this percentage decreased to 13.3% during FP7, it increased again to 13.7% in Horizon 2020. Hence, while the opening of EU-15 countries to EU-13 countries seems to have worsened during FP7, the situation has improved with Horizon 2020. In parallel, the share of collaborations between EU-13 participants with each other has been stable since FP6.
Figure 11. Connections with EU-13 participants as a percentage of all connections of EU-15 participants. Source: Author’s calculations based on CORDA data.
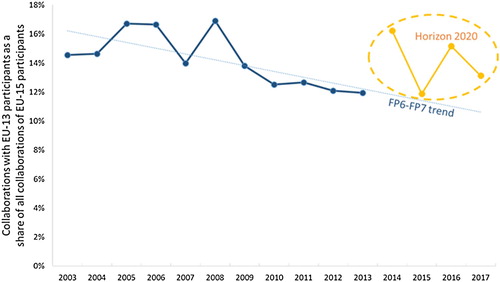
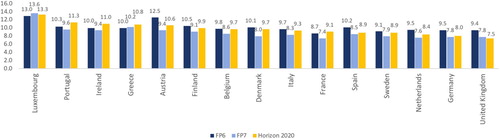
The evolution of these collaborations between EU-15 and EU-13 countries is detailed for each EU-15 country in Footnote12. While there is a general decrease in collaborations with EU-13 participants between FP6 and FP7, almost all EU-15 countries collaborate more often with EU-13 participants in Horizon 2020, compared to FP7. The only exceptions are Luxembourg and the United Kingdom which are also respectively the countries with the largest (13.3%) and the smallest share of connections (7.5%) with EU-13 participants. Since FP6, this trend has been continuously negative only for the UK and continuously positive only for Greece.
Figure 12. Connections with EU-13 countries as a percentage of all connections. Source: Author’s calculations based on CORDA data.
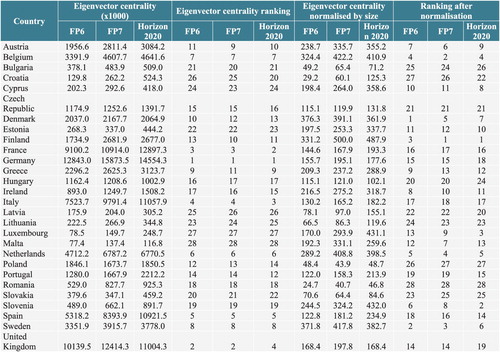
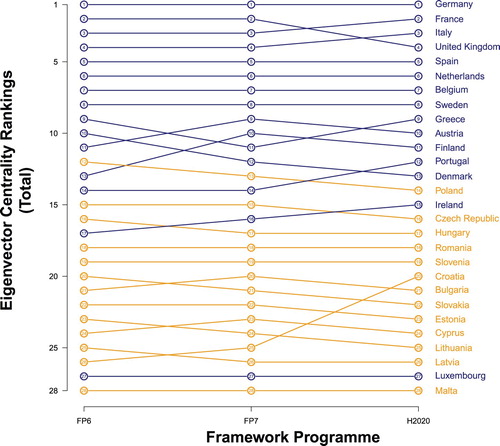
How has the position of EU countries evolved over time? We present network indicators computed at the participant level, and averaged or aggregated at the country level. Only EU countries are analysed. When examining the position of specific countries in the network, we suggested before that country size is an important determinant in the average number of its participants’ connections. This is also reflected in , with the evolution of country rankings based on eigenvector centrality measures. Germany is both the largest participant in the FP and the most central country in the network. After Germany, France and Italy are the most central countries in Horizon 2020. While the UK was more central than France and Italy in FP6 and FP7, its central position worsened in Horizon 2020. Greece, Portugal and Ireland have improved their centrality in the network between FP7 and Horizon 2020 according to this ranking. The chart also confirms that participants from EU-15 countries tend to be more central than their EU-13 counterparts: the bottom of the chart is occupied by a majority of EU-13 countries, with only Croatia having significantly improved its position since FP6.
Figure 13. Network positions of participants by EU country. Source: Author’s calculations based on CORDA data.
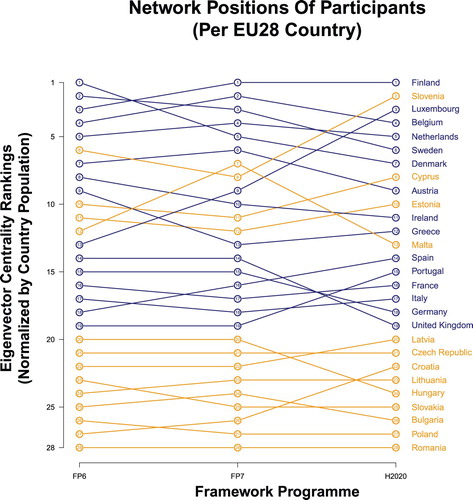
However, these measures are absolute and are significantly influenced by country sizeFootnote13. Normalization for size leads to an overall different picture. presents the evolution of eigenvector centrality coefficients by country between FP6 and Horizon 2020 when normalizing by country population. Different trends can be observed. The most central country, relative to its size, is actually Finland. Some EU-13 countries also appear to be very central in the network for their size: Slovenia is now the second most central country in the network after normalization for size effect. This was not the case in previous programmes: Slovenia was ranked 5th in FP6 and 8th in FP7 in terms of centrality. Luxembourg, the Netherlands, Belgium, Sweden and Denmark are next in terms of size-normalized centrality measure. Among EU-13 countries, Cyprus and Estonia also present strong centrality after normalization. Hence EU-15 and EU-13 groups are not homogenous groups, with some EU-13 countries being more central, relative to their size, than most EU-15 countries. The position of the UK and Hungary dropped significantly between FP7 and Horizon 2020Footnote14. Still, several EU-13 countries are consistently found at the bottom of the ranking.
Figure 14. Network positions of participants by EU country normalized by population. Source: Author’s calculations based on CORDA data (Framework Programme) and World Bank (country population).
5. Conclusion
Using unique and very recent FP data, we have described the dynamics of the research network across EU countries during the period 2003–2017, on the basis of collaborative research projects that have been implemented under the Sixth, Seventh and part of the Eight Framework Programme for Research and Innovation.
A key feature of the network is the dominance of the largest EU-15 countries. This observation is expected as country size correlates with the number of participations in the Framework Programme and the number of collaborations between participants. However, when normalizing for size, some other EU-15 countries pop up as most central (like Finland) but also some EU-13 countries (like Slovenia and Estonia) appear to be central in the network. Still, other EU-13 countries remain at the bottom of the ranking.
We found different components of the networks based on the strongest connections. There are two major clusters of large EU-15 countries and large EU-13 countries that are connected to some extent by two other clusters (one cluster consisting of Baltic countries, Czech Republic and Slovakia, the other cluster representing strong collaborations between Cyprus, Greece, Ireland, Luxembourg, Malta and Portugal). Most network hubs are found in the EU-15 countries, but some EU-13 organizations fulfil a key bridging function, especially Slovenia and some Baltic countries. The most active gatekeepers are EU-13 research organizations, public bodies and higher education institutes, rather than private organizations.
Our findings also show there is a spatial division across countries with respect to the nature of their participation. As expected, EU-15 countries appear to be more engaged in programme parts that are considered to be more complex, while EU-13 countries participate in parts of the programme that are less complex. In general, countries that are less central in the network are also countries that have a relative lower comparative advantage in more complex programme parts and a relative higher comparative advantage in less complex programme parts.
The collaborative research network looks pretty stable during the period 2003-2017. The core and periphery of the EU network have not changed much over time. Having said that, there are also signs of dynamics in the research network. Countries like Slovenia, Luxembourg, Croatia, Portugal and Cyprus show striking increases in terms of size-normalised centrality from FP7 to Horizon 2020, while the UK and Hungary dropped positions. Between FP6 and FP7, EU-15 participants have been reducing their collaborations to EU-13 participants to some extent, but this trend has reverted in Horizon 2020. Moreover, the network of participations to the FP’s appears to be dynamic over time and tends to be opening to less connected participants. Participants in EU-13 countries show a higher propensity to be involved in new collaborations than EU-15 countries.
Overall, the analysis shows that the research network is reproducing existing divides in research excellence across EU countries but that there is also a tendency of dynamics and more openness in the network, in particular between FP7 and Horizon 2020. There is still room for improving the connectivity and centrality of several countries, especially countries with lower R&I performance. This calls for continuous emphasis and effort, in particular for these countries, to ensure the openness of the programme’s networks to their entities. This could be achieved through support activities such as organizing information/networking campaigns, boosting national capacity building, offering further opportunities to entities for accessing successful R&I projects and established networks, or by supporting matchmaking between potential participants informed by analytics and network affinities.
There are a number of limitations in our paper that needs to be taken up by future research. First, the next step is to determine the main drivers behind the evolution of the collaborative research network in the EU we presented. Our study suggests that size of the country, geographical and cultural proximity, and network centrality have an effect on the propensity of EU countries to participate in research collaborations over time, but these suggestions need to be thoroughly tested through a systematic study on the dynamics of the EU network. Second, it remains an open question what are the effects of the dynamics in the EU network in terms of innovation and economic development in the respective countries. There are studies that tend to show a positive effect (e.g. Hoekman et al., Citation2013), but in the case of Horizon 2020, it is still too early to get an accurate assessment. Third, future research should assess whether participation of countries in more complex parts of the FP programme yields more benefits, as one would expect (Balland et al., Citation2018). Finally, there is a challenge to involve more lagging countries in the EU research network, and how FPs can make them benefit from the often wide presence of MNE’s in peripheral countries (Radosevici & Ciampi Stancova, Citation2018).
ORCID
Pierre-Alexandre Balland http://orcid.org/0000-0003-2787-4376
Notes
1. Data include all evaluated calls for collaborative projects. Projects under Public-Public Partnerships, EIT’s Knowledge and Innovation Communities (KICs), and direct actions of the Joint Research Centre are not included.
2. This database is maintained by the Common Support Centre of DG Research and Innovation (European Commission).
3. Year of signature of the contract. Cut-off date for Horizon 2020 is 1/1/2018.
4. Projects with incomplete data on signature date, duration and participant identifier were removed from the analysis (about 99.1% of the initial dataset of collaborative projects).
5. Before Horizon 2020, FP6 and FP7 funded respectively 5,912 and 12,493 collaborative projects, which correspond to 1,305,305 and 1,989,450 collaborations between participants.
6. The interim evaluation of Horizon 2020 (European Commission, Citation2017) also shows highest centrality measures for EU-15 countries in Horizon 2020 compared to other country groups. The approach used for country analysis in this interim evaluation relies on connections at country level after aggregation of participants, not average statistics of participants within a country as in this analysis. As a consequence, differences in centrality measures seem to be exacerbated at participant level in this paper, especially the difference between EU-15 countries and EU-13 countries.
7. The maximum value for the eigenvector centrality of a participant is 1. To avoid very small values when we average eigenvector centrality of participants at the country level, we multiply eigenvector centrality by 1,000.
8. Relatedness is computed using the EconGeo software, implemented as a R package (Balland, Citation2017).
9. Communities within the network are based on the multi-level modularity optimisation algorithm for finding community structure as described by Blondel et al. (Citation2008).
10. For this analysis, the composition of country groups does not vary over time. Country groups are defined based on the situation in Horizon 2020.
11. Compared to other types of network in Ripley et al. (Citation2016).
12. The patterns in and are qualitatively similar. But due to collaborations within country groups, the aggregated values do not numerically correspond to the average of countries.
13. To ensure robustness, other variables describing country size have been tested, such as the national population of researchers (source: Eurostat). This does not affect the key messages from the analysis. However, using population reduces data noise over time and ensures reliability in the evolution of the ranking (see Box 5).
14. The position of Malta also decreased significantly over the same period, but it follows a significant increase in FP7 and the position of small countries is more volatile in the ranking.
15. Links displayed on this graph with N actors combines the N-1 links of a maximum spanning tree (MST) and the N-1 strongest links of the original graph. The MST represents the backbone of a weighted network and is based on three rules. First, only N-1 links from a network with N actors are kept. Second, rule #1 should be satisfied while keeping the strongest links. If xij = 1, xjk = 2, and xki = 3, the algorithm will remove xij. Third, rule #1 and #2 should be satisfied without creating any isolate in the network.
16. These measures are based on the network of participations without any threshold in the number of connections between two participants. See Annex for centrality measures based on connections in at least 2 projects.
Related Research Data
References
- Autant-Bernard, C., Billand, P., Frachisse, P., & Massard, N. (2007). Social distance versus spatial distance in R&D cooperation: Empirical evidence from European collaboration choices in micro and nanotechnologies. Papers in Regional Science, 86, 495–519. doi: 10.1111/j.1435-5957.2007.00132.x
- Balland, P. A. (2012). Proximity and the evolution of collaboration networks: Evidence from research and development projects within the Global Navigation Satellite System (GNSS) Industry. Regional Studies, 46(6), 741–756. doi: 10.1080/00343404.2010.529121
- Balland, P. A. (2017). Economic geography in R: Introduction to the EconGeo package. Papers in Evolutionary Economic Geography, 17(09), 1–75.
- Balland, P. A., Boschma, R., Crespo, J., & Rigby, D. (2018). Smart specialization policy in the EU: Relatedness, knowledge complexity and regional diversification. Regional Studies, forthcoming.
- Balland, P. A., de Vaan, M., & Boschma, R. (2013). The dynamics of interfirm networks along the industry life cycle: The case of the global video game industry, 1987-2007. Journal of Economic Geography, 13(5), 741–765. doi: 10.1093/jeg/lbs023
- Balland, P. A., & Rigby, D. (2017). The geography of complex knowledge. Economic Geography, 93(1), 1–23. doi: 10.1080/00130095.2016.1205947
- Barabasi, A. L., & Albert, R. (1999). Emergence of scaling in random networks. Science, 286(5439), 509–512. doi: 10.1126/science.286.5439.509
- Blondel, V. D., Guillaume, J.-L., Lambiotte, R., & Lefebvre, E. (2008). Fast unfolding of communities in large networks. J. Stat. Mech, P10008. doi: 10.1088/1742-5468/2008/10/P10008
- Boschma, R., & Frenken, K. (2010). The spatial evolution of innovation networks. A proximity perspective. In R. Boschma, & R. Martin (Eds.), The handbook of evolutionary economic geography (pp. 120–135). Cheltenham: Edward Elgar.
- Boschma, R., & Frenken, K. (2018). Evolutionary economic geography. In G. Clark, M. Feldman, M. Gertler, & D. Wojcik (Eds.), New Oxford handbook of economic geography (Chap. 11, pp. 213–229). Oxford: Oxford University Press.
- Breschi, S., & Cusmano, L. (2004). Unveiling the texture of a European research area: Emergence of oligarchic networks under EU Framework Programmes. International Journal of Technology Management, 27, 747–772. doi: 10.1504/IJTM.2004.004992
- Breschi, S., & Lenzi, C. (2015). The role of external linkages and gatekeepers for the renenwal and expansion of US cities’ knowledge base, 1990-2004. Regional Studies, 49(5), 782–797. doi: 10.1080/00343404.2014.954534
- Breschi, S., & Lissoni, F. (2009). Mobility of skilled workers and co-invention networks: An anatomy of localised knowledge flows. Journal of Economic Geography, 9, 439–468. doi: 10.1093/jeg/lbp008
- Broekel, T. (2015). Do cooperative research and development (R&D) subsidies stimulate regional innovation efficiency? Evidence from Germany. Regional Studies, 49(7), 1087–1110. doi: 10.1080/00343404.2013.812781
- Broekel, T., & Mueller, W. (2018). Critical links in knowledge networks – What about proximities and gatekeeper organisations? Industry & Innovation, 25(10), 919–939. doi: 10.1080/13662716.2017.1343130
- Burt, R. S. (2004). Structural holes and good ideas. American Journal of Sociology, 110(2), 349–399. doi: 10.1086/421787
- Cassi, L., & Plunket, A. (2015). Research collaboration in co-inventor networks: Combining closure, bridging and proximities. Regional Studies, 49(6), 936–954. doi: 10.1080/00343404.2013.816412
- Czarnitzki, D., & Fier, A. (2003). Publicly funded R&D collaborations and patent outcome in Germany. ZEW Discussion Papers 03-24, ZEW - Zentrum für Europäische Wirtschaftsforschung / Center for European Economic Research.
- De Noni, I., Orsi, L., & Belussi, F. (2018). The role of collaborative networks in supporting the innovation performances of lagging-behind European regions. Research Policy, 47, 1–13. doi: 10.1016/j.respol.2017.09.006
- European Commission. (2017). Interim evaluation of horizon 2020. Staff working document. SWD(2017)220.
- European Commission. (2018). Impact assessment of horizon Europe. Staff working document. SWD(2018)307.
- Farole, T., Rodriguez-Pose, A., & Storper, M. (2011). Cohesion policy in the European Union: growth, geography, institutions. Journal of Common Market Studies, 49, 1089–1111. doi: 10.1111/j.1468-5965.2010.02161.x
- Fleming, L., Mingo, S., & Chen, D. (2007). Collaborative brokerage, generative creativity and creative success. Administrative Science Quarterly, 52(3), 443–475. doi: 10.2189/asqu.52.3.443
- Foray, D. (2004). The economics of knowledge. London: MIT Press.
- Gilsing, V., Nooteboom, B., Vanhaverbeke, W., Duysters, G., & van den Oord, A. (2007). Network embeddedness and the exploration of novel technologies. Technological distance, betweenness centrality and density. Research Policy, 37, 1717–1731. doi: 10.1016/j.respol.2008.08.010
- Giuliani, E. (2007). The selective nature of knowledge networks in clusters: Evidence from the wine industry. Journal of Economic Geography, 7(2), 139–168. doi: 10.1093/jeg/lbl014
- Glückler, J. (2007). Economic geography and the evolution of networks. Journal of Economic Geography, 7(5), 619–634. doi: 10.1093/jeg/lbm023
- Graf, H. (2011). Gatekeepers in regional networks of innovators. Cambridge Journal of Economics, 35, 173–98. doi: 10.1093/cje/beq001
- Hazir, C. S., LeSage, J., & Autant-Bernard, C. (2016). The role of R&D collaboration networks on regional knowledge creation: Evidence from information and communication technologies. Papers in Regional Science, 97(3), 549–567. doi: 10.1111/pirs.12267
- Hidalgo, C. A., & Hausmann, R. (2009). The building blocks of economic complexity. Proceedings of the National Academy of Sciences of the United States of America, 106(2009), 10570–10575. doi: 10.1073/pnas.0900943106
- Hidalgo, C. A., Klinger, B., Barabási, A. L., & Hausmann, R. (2007). The product space conditions in the development of nations. Science, 317, 482–487. doi: 10.1126/science.1144581
- Hoekman, J. (2012). Science in an age of globalisation. The geography of research collaboration and its effect on scientific publishing. PhD thesis. Eindhoven University of Technology, Eindhoven.
- Hoekman, J., Scherngell, T., Frenken, K., & Tijssen, R. (2013). Acquisition of European research funds and its effect on international scientific collaboration. Journal of Economic Geography, 13(1), 23–52. doi: 10.1093/jeg/lbs011
- Huggins, R., & Thompson, P. (2014). A network-based view of regional growth. Journal of Economic Geography, 14(3), 511–545. doi: 10.1093/jeg/lbt012
- Jones, B. F. (2009). The burden of knowledge and the death of the renaissance man: Is innovation getting harder? Review of Economic Studies, 76(1), 283–317. doi: 10.1111/j.1467-937X.2008.00531.x
- Katz, J. S., & Martin, B. R. (1997). What is research collaboration? Research Policy, 26, 1–18. doi: 10.1016/S0048-7333(96)00917-1
- Maggioni, M. A., Nosvelli, M., & Uberti, T. E. (2007). Space vs. networks in the geography of innovation: A European analysis. Papers in Regional Science, 86(3), 471–493. doi: 10.1111/j.1435-5957.2007.00130.x
- Maggioni, M. A., & Uberti, T. E. (2009). Knowledge networks across Europe: Which distance matters? The Annals of Regional Science, 43, 691–720. doi: 10.1007/s00168-008-0254-7
- Moreno, R., Paci, R., & Usai, S. (2005). Geographical and sector clusters of innovation in Europe. The Annals of Regional Science, 39, 715–739. doi: 10.1007/s00168-005-0021-y
- Morrison, A. (2008). Gatekeepers of knowledge within industrial districts: Who they are, how they interact. Regional Studies, 42(6), 817–835. doi: 10.1080/00343400701654178
- Nooteboom, B. (2000). Learning and innovation in organizations and economies. Oxford: Oxford University Press.
- Olechnicka, A., Ploszaj, A., & Celinska-Janowicz, D. (2019). The geography of scientific collaboration. London/New York: Routledge.
- Paier, M., & Scherngell, T. (2011). Determinants of collaboration in European R&D networks: Empirical evidence from a discrete choice model. Industry and Innovation, 18, 89–104. doi: 10.1080/13662716.2010.528935
- Ponds, R., van Oort, F. G., & Frenken, K. (2010). Innovation, spillovers and university-industry collaboration: An extended knowledge production function approach. Journal of Economic Geography, 10, 231–255. doi: 10.1093/jeg/lbp036
- Powell, W. W., White, D., Koput, K. W., & Owen-Smith, J. (2005). Network dynamics and field evolution: The growth of interorganizational collaboration in the life sciences. American Journal of Sociology, 110, 1132–1205. doi: 10.1086/421508
- Radosevic, S., & Yoruk, E. (2014). Are there global shifts in world science base? Analysis of catching up and falling behind of world regions. Scientometrics, 101(3), 1897–1924. doi: 10.1007/s11192-014-1344-1
- Radosevici, S., & Ciampi Stancova, K. (2018). Internationalising smart specialisation: Assessment and issues in the case of EU new member states. Journal of the Knowledge Economy, 9, 263–293. doi: 10.1007/s13132-015-0339-3
- Ripley, R., Snijders, T. A. B., Boda, Z., Voros, A., & Preciado, P. (2016). Manual for RSiena. Retrieved from http://www.stats.ox.ac.uk/~snijders/siena/RSiena_Manual.pdf
- Scherngell, T., & Barber, M. (2009). Spatial interaction modelling of cross-region R&D collaborations: empirical evidence from the 5th EU framework programme. Papers in Regional Science, 88, 531–546. doi: 10.1111/j.1435-5957.2008.00215.x
- Scherngell, T., & Lata, R. (2013). Towards an integrated European Research Area? Findings from eigenvector spatially filtered spatial interaction models using European framework programme data. Papers in Regional Science, 92(3), 555–577.
- Singh, J. (2005). Collaborative networks as determinants of knowledge diffusion patterns. Management Science, 51(5), 756–770. doi: 10.1287/mnsc.1040.0349
- Sorenson, O., Rivkin, J. W., & Fleming, L. (2006). Complexity, networks and knowledge flow. Research Policy, 35(7), 994–1017. doi: 10.1016/j.respol.2006.05.002
- Stuck, J., Broekel, T., & Revilla Diez, J. (2016). Network structures in regional innovation systems. European Planning Studies, 24(3), 423–442. doi: 10.1080/09654313.2015.1074984
- Ter Wal, A. L. J. (2014). The dynamics of the inventor network in German biotechnology: Geographic proximity versus triadic closure. Journal of Economic Geography, 14, 589–620. doi: 10.1093/jeg/lbs063
- Tijssen, R. J. W. (2008). Are we moving towards an integrated European research area? Some macro-level bibliometric perspectives. COLLNET Journal of Scientometrics and Information Management, 2, 19–25. doi: 10.1080/09737766.2008.10700837
- Tsouri, M. (2018). Knowledge transfer in time of crisis: Evidence from the Trentino region. Industry and Innovation. doi: 10.1080/13662716.2018.1551124
- Uhlbach, W. H., Balland, P., & Scherngell, T. (2017). R&D policy and technological trajectories of regions: Evidence from the EU framework programmes. Papers in evolutionary economic geography 17.22, Utrecht University, Section Economic Geography, Utrecht .
- Vicente, J., Balland, P. A., & Brossard, O. (2011). Getting into networks and clusters: Evidence from the midi-pyrenean global navigation satellite systems (GNSS) collaboration network. Regional Studies, 45, 1059–1078. doi: 10.1080/00343401003713340
- Wanzenbock, I., Scherngell, T., & Brenner, T. (2014). Embeddedness of regions in European knowledge networks: A comparative analysis of inter-regional r&d collaborations, co-patents and co-publications. The Annals of Regional Science, 53(2), 337–368. doi: 10.1007/s00168-013-0588-7
- Wouden, F. v. d., & Rigby, D. L. (2017). Co-inventor networks and knowledge production in specialized and diversified cities. Papers in evolutionary economic geography (PEEG) 17.15, Section Economic Geography, Utrecht University.
- Wuchty, S., Jones, B. F., & Uzzi, B. (2007). The increasing dominance of teams in production of knowledge. Science, 316(5827), 1036–1039. doi: 10.1126/science.1136099
Annex
Figure A1. Centrality with alternative threshold (one-off connections discarded).
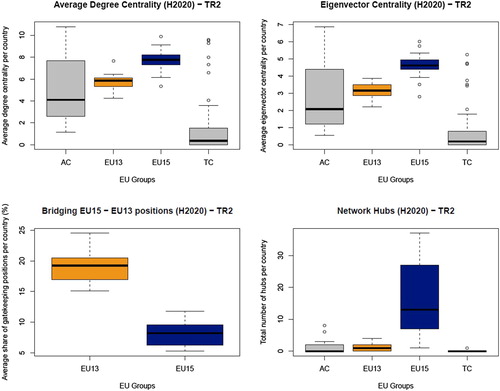
Table A1. Programmes parts in Horizon 2020.
Figure A2. Share of country participations by programme part (%). Source: Author’s calculations based on CORDA data.
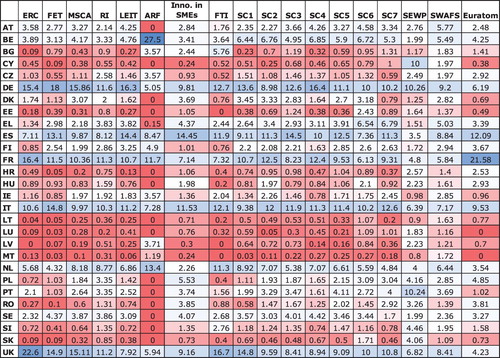
Figure A3. Share of country participations by programme part (%) with countries organized by decreasing overall centrality (from top to bottom) and programme parts organized by decreasing ubiquity (from left to right). Source: Author’s calculations based on CORDA data.
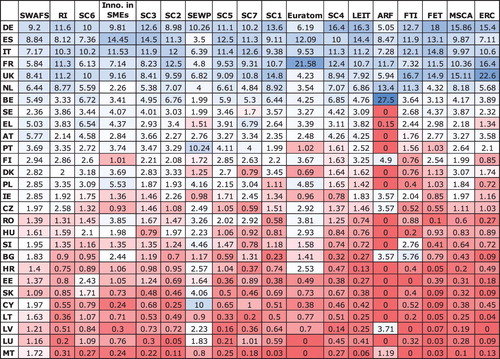
Figure A4. Centrality rankings for EU countries. Source: Author’s calculations based on CORDA data.