
 ?Mathematical formulae have been encoded as MathML and are displayed in this HTML version using MathJax in order to improve their display. Uncheck the box to turn MathJax off. This feature requires Javascript. Click on a formula to zoom.
ABSTRACT
This paper examines the relationship between public houses or ‘pubs’ and house prices in Great Britain. Using a unique dataset, comprising statistical indicators for 373 local authorities registered between 2005 and 2015, the authors investigate this relationship from a panel data perspective. The analysis identifies a strong positive association between an increase in the number of pubs and house prices, showing different patterns with regard to pubs located in urban, suburban and rural areas. Results offer an original contribution to the literature related to the economic value of pubs as important third places in Great Britain, providing the basis for potential policy choices aimed at supporting community investment.
1. Introduction
In the United Kingdom (UK hereafter), public houses or ‘pubs’ provide important places for social aggregation, offering physical settings for many types of communal activities (Maye et al., Citation2005; Mount & Cabras, Citation2016). Several recent studies confirm the positive impact of pubs as third places on local communities (Bowler & Everitt, Citation1999; Cabras & Mount, Citation2017; Maye et al., Citation2005; Mount & Cabras, Citation2016), and this impact on community cohesion appears to be greater than other third place including community halls, village shops, post offices and libraries (Cabras & Lau, Citation2019). Any decline in the number of pubs, therefore, represents a potential threat to the cohesion and attractiveness of a community. According to British Beer and Pub Association (Citation2015), the total number of UK pubs declined from about 67,000 to less than 49,300 in the period 1982–2015.
Notwithstanding the importance of the issue and the significance of the long run decline, there is an absence of large sample research evidence into the consequences of pub closures. One reason is that significant attention, understandably, has concentrated on the causes of these closures, notably regulation, restructuring and competition from supermarkets (Higgins et al., Citation2016; Preece, Citation2016). A further possible reason is the lack of a consistent long run data source suitable for longitudinal analysis of the effects of closures on community cohesion and economic wellbeing.
Moreover, because pubs offer generalized social benefits, placing an economic value on their presence or absence in a community is problematic. These benefits may differ according to access and location effects, for example, according to the degree of urbanization. A possible solution, explored in this paper, is to use house prices as a standard of economic value across these locations in order to proxy the effects of pubs and pub closures in any given locality. Access and proximity to amenities are important factors in households’ choice to purchase a house in the countryside (Costello, Citation2007) and in urban and suburban areas (Ding et al., Citation2010), with a substantial number of homebuyers specifying proximity to a pub as important in their decision (Tepilo, Citation2015). The presence of a pub, therefore, according to its location, may be expected to have a positive impact on house prices. In a similar vein, specifying this relationship through time and across a range of urban and rural contexts, allows us to analyse the local economic consequences of pub openings and closures.
We thus investigate the relationship between changes in the number of pubs and house prices between 2005 and 2015, using an original panel dataset, comprising information on facilities and services available for 373 local authorities (LAs hereafter) in Great Britain,Footnote1 grouped according to their degree of urbanization. The paper comprises of six sections, including the introduction. Section 2 discusses and illustrates the theoretical background of the study, focusing on third places and analysing their importance with regard to concepts such as community cohesion and social capital. Section 3 provides an overview of the progressive decline in pubs that has occurred in England, Scotland and Wales, focusing on pubs operating in spatially remote areas and rural parishes and explaining the significance of these places for rural communities. Section 4 describes data used and methodology applied and explores research hypothesis. Section 5 presents and explains the econometric models elaborated in the analysis, examining results. Section 6 evaluates findings from the previous section in light of the main research questions addressed by this study, discussing the linkage between pubs and house prices and drawing recommendations and conclusions.
2. Third places and the decline of pubs in the UK
The purpose of the study presented in this paper is to explore, examine and evaluate the possible relationships between pubs and house prices within LAs. In particular, our investigation aims to understand whether changes in the number of pubs could have a different impact on house prices in urban, suburban and rural areas.
The reasoning behind this question is intrinsically related to the role of pubs as ‘third places’, thus physical places for people to congregate and join together, shaping and delineating frameworks and boundaries for individuals and groups (Oldenburg, Citation1989; Watson and Watson, 2012). Third places are assumed to facilitate the accumulation of social capital within the communities they serve, with social capital being the whole of relationships and ties among individuals which provide a degree of social interaction, cohesiveness and networking in a given community (Putman, Citation2000). Empirical evidence seems to suggest that third places play an important functional role in providing platforms for these concepts to develop and expand (Botterman et al., Citation2012). Relationships between individual and society are often regulated ‘by other social “bodies” such as community groups, friendship networks, voluntary groups but, above all, by families and organisation’ (Watson and Watson, 2012, p. 687); and these relationships define the network dimension of social capital (Copus & Skuras, Citation2006).
Despite these findings, however, the last decade has been characterized by an increasing number of pub closures, and a variety of factors that have affected British pubs can be distinguished and used to explain pubs’ decline. Among these factors, the changes in the sector since the 1960s, which saw the separation of pubs from breweries that traditionally owned them (Preece, Citation2016); the Beer Orders issued by Parliament in 1989, which forced large brewers operating in an oligo- monopolistic market to dispose of a large stock of their pubs (Pratten, Citation2007); the rise and enlargement of corporate pub-chains or ‘pubcos’ in the early 1990s and the consequent decline of independently owned pubs or ‘free-houses’ (Preece, Citation2016); and, more recently, tough market restructuring and related pub closures due to the 2008 financial crisis (Andrews and Turner, Citation2012). Moreover, factors like the progressive decrease of alcohol prices sold in supermarkets and off-license retailers (Smith and Foxcroft, Citation2009); the raise of European style-cafes (Lincoln, Citation2006); and the growth of home entertainment (e.g. game-consoles, high-definition TVs and home-theatre sound systems) all contributed to making pub nights less attractive (Pratten, Citation2007), pushing many pub-goers to reduce their visits and move them mainly during weekends (Mount & Cabras, Citation2016).
Pubs may also face different challenges depending on which areas they are located. In urban areas, pubs represent an important component of the so called ‘night-time economy’ (NTE), based on clubs, bars and other licensed premises that attract residents as well as tourists to urban centres, generating significant employment and revenues (Hough & Hunter, Citation2008; Tierney, Citation2006). Successive UK Governments encouraged the NTE with licensing and planning policies in the 1990s and early 2000s, in conjunction with a national strategy that sought the re-vitalization of city-centre locations (Hough and Hunter, Citation2008). Such support was not enjoyed by pubs located in rural areas, and many needed to reconfigure themselves into different types of businesses (e.g. gastro-pubs, bed and breakfasts) in order to survive.
3. Determinants of house prices and the relationship with pubs
Because the house is the most valuable asset for the vast majority of households, housing market issues generated a significant amount of literature. Among theoretical frameworks explaining the functioning of housing markets, the model proposed by Rosen (Citation1974) is frequently used to describe housing as a composite bundle of goods determined by house’s attributes such as size, location, neighbourhood, access to transport links, etc. A market equilibrium in the model is reached when the marginal benefit of improving one or more parts of the bundle (e.g. buying a larger estate, or moving to a safer neighbourhood), based on individual consumers’ preferences and income, is offset by the utility costs of the additional expenditure involved. In Rosen’s model, house prices capture and reflect the benefits of a range of composite attributes, and can be used to interpret consumers’ willingness to pay for one or more of those attributes, and to define the relationship between housing prices and houses’ implicit attributes also known as the ‘hedonic’ price function.
DiPasquale and Wheaton (Citation1992) use a four-quadrant model to explain the housing market, in which quadrants indicate (i) the asset market valuation, (ii) the property market rent determination, (iii) the asset market construction and (iv) the property market stock adjustment. Mutual interactions across these quadrants result in a continuous adjustment between housing demand and supply; basically, starting with a given stock of space, the property market determines rents which reflect property prices by the asset market. These, in turn, ‘generate new construction that, back in the property market, eventually yields a new level of stock. The combined property and asset markets are in equilibrium when the starting and ending levels of the stock are the same’ (DiPasquale and Wheaton, Citation1992, p.189). This signifies that, in a well-functioning space market, real effective housing prices and rents decrease when the housing demand increases, and vice versa.
More recent literature on the subject tends to focus the so-called spatial equilibrium condition proposed by Glaeser (Citation2008), which sees individual households maximize their utility by moving locations, buying houses in what they perceive to be better locations compared to the ones they depart from, with the housing market reaching an equilibrium when individuals see no difference across locations in terms of the utility offered by each location. By doing so, households maximize their indirect utility function (Glaeser, Citation2008).
As the presence (or absence) of facilities and amenities affects the attractiveness of a given area or location and its related housing prices, many research works address and investigate this issue in different countries worldwide. See, for instance, studies identifying the positive impact of good quality schools (Figlio and Lucas, Citation2004), presence of sport facilities (Feng and Humphreys, Citation2018) and better access to railways stations and metro connections (Armstrong and Rodriguez, Citation2006; Baum-Snow and Kahn, Citation2000) on residential property values in the US; the housing price premium that a favourable job location combined with a variety of amenities confer to housing prices in the Netherlands (Garresset and Marlet, Citation2015); and the increase in housing prices resulting from having a playground within spatial proximity in Australian neighbourhoods (Breunig et al., Citation2019). Moreover, other studies demonstrate how the overall attractiveness and housing prices of residential areas fall in presence of factors such as higher crime rates (Gibbons, Citation2004), higher levels of pollution (Chen & Chen, Citation2016) and environmental dis-amenities (e.g. risk of flooding, Zhang, Citation2016).
With regard to the UK housing market, Holly and Jones (Citation1997) indicate household incomes to be the most important determinant of house prices, while Brooks and Tsolacos (Citation2010) refer to lagged values as another significant predictor. According to Hincks et al. (Citation2014), prior to the recession in 2007, housing markets across the UK had experienced more than a decade of uninterrupted growth. While this growth was widely assumed to continue by policy-makers after 2008, the onset of the recession and subsequent recovery accrued differences across localities, imposing new challenges for policymakers at national and sub-national levels (Holmes & Grimes, Citation2008). This resulted in a significant variability of housing stock across the UK, with some areas experiencing a dramatic oversupply and others a lack of supply due to the reluctance of the private sector to commit to new build activities, creating affordability issues in some areas (e.g. London and the South East) as well as negative equity concerns in others (Hincks et al., Citation2014).
In such context, notwithstanding the assumption that the loss of third places and pubs, in particular, can have a detrimental impact on the attractiveness of residential places, there has been some speculation in the UK that the presence of pubs in given communities could have a positive effect on house prices. Particularly in the countryside, community initiatives undertaken by residents to save their locals, officially aimed at preserving spaces for residents to congregate and join together, could actually be intended to conserve the value of residents’ housing investments, keeping house prices higher and therefore maintaining their residential areas more attractive for future investors. This aspect may have become even more significant with many rural areas becoming bedroom communities for metropolitan areas (Scott, Citation2002).
An example supporting this argument is provided by the case of the Lyvennet Community Trust (LCT hereafter), in the village of Crosby Ravensworth in the Lyvennet Valley, Northern England. The LCT is a Community Land Trust, thus a non-for-profit organization that supports and promotes any charitable purpose for the benefit of the community in the area. Its steering group comprises County, District and Parish Councillors, along with interested representatives from the community. The LCT is particularly focused on the provision of affordable housing for people who want to relocate to Crosby Ravensworth. When the Butcher’s Arms, the only pub in the village, was put on the market in September 2009, the LCT worried that its closure could compromise the attractiveness of Crosby. More worryingly for the LCT, however, was the fact that this closure could have compromised the construction of 20 new houses in 2010 since the presence of a pub in a village makes the village itself more attractive for potential residents and has an impact on the local housing market.
The LCT then actively campaigned to rescue the pub from closure, and it was successful in in promoting the creation of a cooperative of local residents with the objective to purchase the Butchers’ Arms. In an interview given to one of the authors in April 2010, Doug Henderson, an LCT member, explained at that time:
Crosby it is quite an isolated community, you don’t get an awful lot of passing trade. So with a pub, the likelihood of someone that can stop and look at the place could just rise (…) getting the pub is just part of the story: it is actually what we can do to add value to this local area.
The LCT is an umbrella organisation for the community living in Crosby Ravensworth. It is actually focused on supporting any initiative, any business that can develop here. The idea of us [the LCT] building houses and selling them to local people is still our priority. But if this is your vision, then you need to have other things in place to make the place sufficiently attractive for them [the local people] to come and live here. The pub is collateral to our vision.
The example of Crosby Ravensworth seems to suit more pubs in rural areas rather than those located in urban areas, although empirical evidence available in the UK is not unequivocal. Examining the impact of amenities and facilities in London, Gibbons (Citation2004) found that property prices tend to be higher in areas with a selection of pubs and wine bars, with having as many as ten pubs or wine bars per square kilometre boosting property prices by 2.8%. However, Gibson also found that living too close to a pub could negatively affect housing prices due to high levels of antisocial behaviours and criminal damages likely to occur in proximity of these places. Research conducted in Wales by Kapman and Aru (Citation2017) found significant differences in housing prices across neighbouring rural wards, although the impact of pubs on price variation was unclear. For instance, the median price paid for a property in the village of Llangynidr (LA: Powys), was £295,938 at the end of 2016 – four times higher than in neighbouring in the village of Twyn Carno (LA: Caerphilly), where the median price was £75,944. At the time the study was conducted, Llangynidr had two pubs, a shop and a primary school in the area. Similarly, Twyn Carno had a pub, a shop and takeaway in the area, along with a primary school.
Based on these considerations, we propose and address the following research questions: ‘What is the relationship between the number of pubs and housing prices in Great Britain? And how does this relationship differ between urban and rural LAs?’
4. Methodology
4.1. The dataset
To answer our two research questions, we extracted and combined a range of information from various datasets provided by the Office for National Statistics (ONS, Citation2016a), including those provided by the Annual Business Enquiry (ONS, Citation2016b). The resulting dataset encompasses data for 373 LAs on an annual basis, covering a time-period of nine years between 2005 and 2015 (years 2008 and 2009 excluded due to incomplete data). The dataset comprises the median house prices (reported in £), treated as the dependent variable, as well as the number of pubs, treated as the independent variable of main interest. In addition, we use median weekly salary (reported in £), unemployment rate and size of resident population as control variables. reports descriptive statistics for these variables. The dataset contains a small percentage of cases for which information was missing or incomplete; we excluded these cases from our analysis, with the dataset classed as unbalanced and resulting in a final sample size of 3,134 observations.
Table 1. Variables used in the study.
LAs comprised in our dataset were classified according to their levels of urbanization based on the urban-rural classification provided by Bibby and Shepherd (Citation2004) which mainly considers Output Areas (OAs) and their sub-hierarchies, and ranks geographical areas in six main categories: ‘Major Urban’ (districts with a population of at least 100,000 people or with half of their population concentrated in urban areas with a population of more than 750,000); ‘Large Urban’ (districts with a population of at least 50,000 people or with half of their population concentrated in urban areas with a population between 250,000 and 750,000); ‘Other Urban’ (districts with a population lower than 37,000 or with less than 26% of their population concentrated in larger market towns and rural settlements); ‘Significant Rural’ (districts with a more than 37,000 people or more than 26% of their population concentrated in larger market towns and rural settlements), ‘Rural – 50’ (districts with at least 50% but less than 80% of their population in rural settlements and larger market towns); and ‘Rural – 80’ (districts with at least 80% of their population in rural settlements and larger market towns). The six-fold grouping can be further aggregated within three main groups ‘Predominantly Urban’ (Major, Large and Other Urban), ‘Significant Rural’ and ‘Predominantly Rural’ (Rural-50 and Rural-80).
Using Bibby and Shepard’s urban-rural classification has the advantage of addressing areas at the same administrative level across the three countries considered, and for which an appropriate amount of data are available in the time-span analysed.Footnote2 Equally, we chose to focus on LAs instead of other administrative or geographical units (for instance OAs, which are more homogenous with regard to attributes such as size and population), as LAs provided a much clearer distinction in terms of scalar levels of urbanity/rurality (e.g. OAs usually consist of either entirely of urban postcodes or entirely of rural postcodes). Hence, we apply the urban-rural classification to model interaction effects and to analyse how the relationship between pubs and house prices varies across LAs with different levels of urbanization/rurality.
However, applying the urban-rural classification used for England to Welsh and Scottish LAs required some adjustment and transformation. Therefore, we followed indications provided by Pateman (Citation2011) in relation to urban-rural areas to identify, select and reclassify LAs in Wales and Scotland. The exercise was straightforward for the vast majority of LAs considered, with just a few cases requiring further investigation with regard to grouping. shows the LAs considered in our study, while reveals that cases excluded from our unbalanced dataset did not change the regional distribution of data significantly. Therefore, the information presented can be assumed as representative of the UK.
Figure 1. Map of LAs analysed in this study.
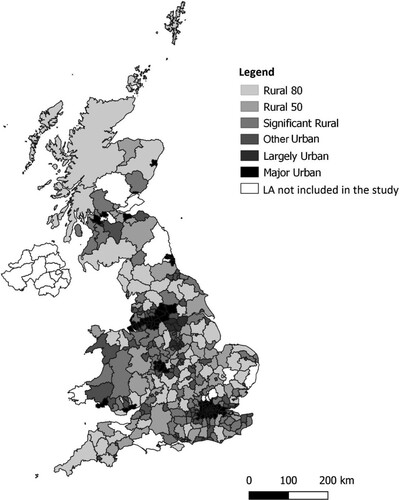
Table 2. Urbanization/rurality classification.
4.2. Descriptive data analysis
comprises of four graphs. The first graph (a) shows the development of the overall house prices in £ against the overall development of the numbers of pubs per 1.000 inhabitants from 2005 to 2015. The remaining three graphs illustrate the evolution of house prices against the evolution of the numbers of pubs separately for ‘Predominantly Urban’ (d), ‘Significant Rural’ (c) and ‘Predominantly Rural’ (b) LAs.
Figure 2. Evolution of number of pubs and house prices.
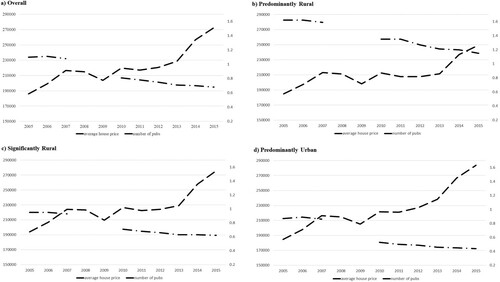
Average house prices show a positive trend in all four graphs. After an initial steep increase between 2005 and 2007, house prices declined in the direct aftermath of the financial crisis. A quick recovery followed in 2010, with the trend showing a period of slow growth and stagnation between 2010 and 2013, particularly in rural areas. In contrast, data for 2014 and 2015 highlight a period of steep growth in all regions. In 2005, ‘Significant Rural’ LAs showed the highest average house price at approximately £194,000; ten years after, in 2015, the highest average house price was found in ‘Predominantly Urban’ LAs at approximately £283,800. In contrast, ‘Predominantly Urban’ LAs showed the lowest average house price with approximately £184.500 in 2005, but ten years after the lowest average house price was found in ‘Predominantly Rural’ LAs with approximately £249.600. As a result, ‘Predominantly Urban’ LAs show the highest growth rate (54%) within the period considered followed by ‘Significant Rural’ LAs (42%) and ‘Predominantly Rural’ LAs (35%).
Trends related to pub counts tell a different story, as all show a negative trend. After a relatively stable period between 2005 and 2007, a steady decline in the number of pubs is evident since 2010, particularly in ‘Predominantly Urban’ LAs. ‘Predominantly Urban’ LAs showed the lowest pubs per capita ratio both in 2005 and 2015, with 0.87 and 0.44 pubs per thousand residents respectively. In contrast, ‘Predominantly Rural’ LAs the lowest pubs per capita ratio, both in 2005 and 2015, with 1.62 and 1.15 pubs per thousand residents respectively. However, ‘Predominately Urban’ LAs also show a sharp decline in the numbers of pubs (−49%), followed by ‘Significant Urban’ LAs (−35%) and ‘Predominantly Rural’ LAs (−29%).
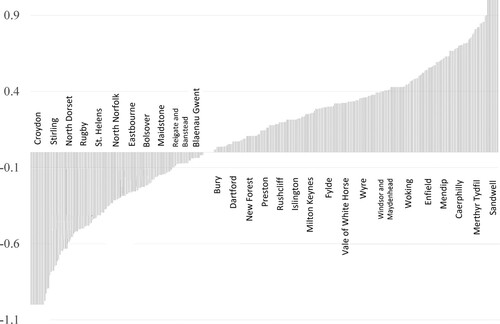
Although these figures seem to suggest an inverse relationship between the number of pubs and average house prices in the period considered, they are not sufficient to confirm such relationship maintained for all types of LAs on an annual basis. We further test the correlation between the annual growth rate in house prices and the annual growth rate in the number of pubs (percentages respectively) for each LA using Spearman’s rank correlation coefficient, or Spearman’s ρ. Spearman’s ρ is a non-parametric measure based on the rankings which assess how the correlation between two variables can be described as a monotonic function; as such, it can be used for both continuous and ordinal variables. As illustrated in , some LAs show a negative correlation between the annual growth rate related to house prices and the annual growth measured for the number of pubs, although the majority exhibit a positive correlation. An important aspect to consider would be then how these LAs differ in their levels of urbanization/rurality in view of addressing our research questions.
Figure 3. Spearman’s rho correlations per LA.
5. Modelling for house prices
The findings generated from the descriptive analysis provides valuable information about the relationship between the number of pubs and housing prices in Great Britain, confirming our general assumptions and identifying some relevant associations among selected variables. Firstly, descriptive results corroborate evidence provided by other sources (BBPA, Citation2015; CAMRA, Citation2012) that the stock of pubs in Great Britain has significantly decreased between 2005 and 2015, with housing prices increasing in the same period. Secondly, they show that the decline of pubs appears to disadvantage urban communities more strongly than rural ones, while the increase of average house prices is stronger in urban communities than rural ones. Thirdly, results confirm that the impact of pubs on the housing markets deserve more detailed and critical scrutiny, for instance by examining potential interaction effects used to understand how the relationship between changes in the number of pubs and changes in average housing prices across the LAs varies based on LA’s levels of urbanization/rurality.
To investigate this relationship, we develop a range of models by applying a panel data approach using LAs as subject observations for which measures are repeated annually (see Raudenbush & Bryk, Citation2002). In doing so, we treat housing prices as the dependent variable, and the number of pubs, weekly median salary, population and unemployment rate as independent variables, adding an interaction effect between the urbanization/rurality and numbers of pubs in an LA in our model. In total, we fitted five models generated by following a step-wise procedure, introducing variables in succession and by considering gains over the unconditional model (Raudenbush and Bryk, Citation2002).
In the first step, we calculate the unconditional model (), which contains no explanatory variables, estimating the residuals within LAs (
) and the general residuals (
) separately, as shown by equation (1)
(1)
(1) Next, we calculate the intra-cluster correlations ‘rho’, which represents the unobserved heterogeneity across Las and indicates the estimated proportion of the total variance attributed to the between variance, as shown by equation (2)
(2)
(2) where sigma_u describes the standard deviation of residuals within LAs (
, while sigma_e describes the overall error term (
).
The unconditional models report an intra-class correlation (rho) of 0.89, indicating house prices as strongly correlated within LAs over time and therefore influenced by unobserved heterogeneity across LAs. This finding underpins our decision to apply a panel data approach, as performing standard OLS regressions would entail the risk of the standard assumption of independent observations being violated, leading to inefficient and biased standard errors (Mizon, Citation1995). In such situation, random-effect and fixed-effect panel regressions would be more suitable to estimate. After applying a HausmanSpecification Test to compare random-effect and fixed-effect estimates in the final model (), which yield a significant results (Prob > chi2 = 0.0000), we decide to estimate a fixed-effect panel regression to capture the average within-subject effects of the time-varying covariates on the dependent variable (Rabe-Hesketh & Skrondal, Citation2008).
Next, we perform a Fisher-type unit-root test for panel data to test whether our dependent variable is stationary; a Fisher-type unit-root test does not require strongly balanced data and the individual series can have gaps – two characteristics of our dataset (Whitehead, Citation2002). As the Fisher-type unit-root test yielded an insignificant result, we can assume that the dependent variable is non-stationary, allowing to insert the lagged house prices with a time lag of one year as an independent variable, assuming that house prices are influenced by values registered in the previous year ().
We then add the median weekly salary, unemployment rate and size of the resident population as control variables to model (). Sequentially, we include number of pubs as independent variable
and then insert an interaction effect capturing the association between and numbers of pubs and levels of urbanization/rurality within LAs, focusing on ‘Rural – 80’ LAs in order to analyse whether the impact of pubs on house prices is significantly different in these LAs compared to more urbanized LAs
The resulting linear fixed-effects model is shown by equation (3)
(3)
(3)
In equation (3), represents the average house price in LA i at year t. In terms of coefficients,
represents the constant term of the regression;
represents the within-unit component of average house prices in LA i in year t − 1 (lagged variable);
represents the within-unit component of number of pubs;
represents the within-unit component of the unemployment rate,
represents the within-unit component of the resident population;
represents the within-unit component of the weekly salary in LA i in year t; and
represents the within-unit component of the interaction effect of the number of pubs and the rurality of LA i in year t. The random error is represented by
, while the remaining unobserved heterogeneity is represented by
.
All the coefficient signs in are consistent with our expectations. The results confirm that lagged house prices have a positive impact on average house prices, and that an increase in the unemployment rate leads to a decline in average housing prices within LAs. The model also confirms a positive effect of population growth on house price development, and suggests that any change in weakly salary levels have no significant impact on housing prices. Most importantly, the results confirm that an increase in the number of pubs, indeed, has a positive impact on house price development. Based on the positive interaction effect, it can also be concluded that the positive impact of pubs on house prices is significantly stronger in rural areas mpared to more urban ones. For the most part, these findings were confirmed by a GMM estimation, which was performed as a robustness test (see appendix).
Table 3. Linear fixed-effect panel regression results.
Finally, in the last step, we develop our models by focusing on additional combinations of interaction effects ( Results indicate that the positive relationship between an increase in the number of pubs and house prices is significantly weaker in ‘Other Urban’ LAs, but significantly stronger in ‘Major Urban’ and ‘Rural-80’ LAs. This finding suggests a u-shape relationship between levels of urbanization and the strength of the effect of pubs on house prices, identifying this effect as significantly stronger in very rural and very urban LAs, with a much stronger effect in ‘Rural-80’ areas compared to ‘Major Urban’
.
6. Discussion and conclusions
The aim of the paper was to analyse the relationship between the number of pubs and housing prices in the UK, examining whether this relationship differs among urban and rural areas by developing linear fixed-effect panel regressions for a dataset of 373 LAs over a period of nine years comprised between 2005 and 2015.
The analysis yields three important results. Firstly, the descriptive data analysis indicates that rural LAs experience a smaller decline in the number of pubs than urban LAs. This finding is in contrast to previous studies, highlighting that the decline in pubs affects rural areas more significantly than urban areas (Andrew & Turner, Citation2012; Cabras & Mount, Citation2017; CAMRA, Citation2012; Mount & Cabras, Citation2016). While these studies reason that rural areas might not provide sufficient customer demand to justify the presence of pubs from a financial perspective, our findings seem to point into the opposite direction. Our results suggest that urban pubs face more challenges than rural pubs, likely due to stronger competition between pubs and alternative localities.
Secondly, our econometric models identify a positive relationship between an increase in the number of pubs and an increase in housing prices. This result adds to previous studies that highlighted the importance of pubs for local communities, focussing on community cohesion and social engagement (Cabras & Reggiani, Citation2010; Mount & Cabras, Citation2016), as well as on local economic development (Cabras & Bosworth, Citation2014). Thirdly, our analysis indicates that the effect of pubs on house prices is significantly stronger in rural areas within the period considered, confirming the positive impact that initiatives such as the one in Crosby Ravensworth might produce for housing prices in rural areas.
The decline of pubs in terms of business closures is often associated with the vanishing of several other initiatives and activities taking place at a local level, with negative effects on local communities that go far beyond the mere closure of commercial businesses and services (Cabras & Mount, Citation2017). Findings from our panel data analysis demonstrate that their decline also affect overall attractiveness in terms of the economic value of residential areas, particularly in the countryside. In rural areas, preserving pubs from closure can help to keep house prices stable and may even increase the value of localized house markets.
Our findings suggest that actions and initiatives aimed at preserving pubs from closures, particularly in rural areas, should be reinforced. Government and LAs can play an important role: in the past, public sector financial support helped many resident communities to create the co-operatives aimed at purchasing their pubs, particularly in the countryside (see Cabras, Citation2011). In recent years, campaigns and initiatives carried out by a number of organizations such as Pub is The Hub, the Plunkett Foundation and the Campaign for Real Ale (CAMRA) have increased public awareness about the dangers incurred by local communities were incurring in terms of lost opportunities and cultural degradation. These campaigns and initiatives generated a number of outcomes specifically aimed at preserving the role and impact of third places, and pubs in particular, within local communities.
For instance, with the inclusion of ‘public eating places’ among those places to preserve in the Sustainable Local Community Act (Parliament, Citation2007), Parliament provided an initial instrument to protect pubs from unnecessary closures, and in 2009 the Department for Communities and Local Government (DCLG) allocated £70 million to an initiative called ‘Communitybuilder’, aimed at funding projects at local levels, ‘including those offering communities a place to meet and those to provide and host community services’ (Carpenter Citation2009). Moreover, the Localism Act and the Neighbourhood Planning Act passed by Parliament in 2011 and 2017 respectively supplied and increased control of LAs in matters related to community assets and services. Community groups can now identify services and assets ‘of community value’ and require LAs to insert them on a protected list: when listed assets come up ‘for sale or change of ownership, community groups are given enough time to raise funds to bid and buy the asset when it comes on the open market’ (Mount & Cabras, Citation2016, p. 1213), forbidding for pubs to be redeveloped or demolished without reference to the local community or planners (Parliament, Citation2017). UK legislation then provide powerful instruments to LAs to protect pubs’ premises from any change of destination or use, indirectly contributing to maintaining housing prices stable in those communities or residential areas served by pubs.
However, while pubs appear to be the most important amenities in rural areas (Cabras and Lau, Citation2019), this may not be the case elsewhere. Some sources suggest a link between the presence of pubs and anti-social behaviour (Crawford & Flint, Citation2009; Hough & Hunter, Citation2008), mainly related to the expansion of the NTE (Tierney, Citation2006), although a clear relationship has not been proved as yet. Alcohol consumption can provide a pretext for anti-social behaviour, and places serving alcohol could increase fear among the public in relation to this issue. In this regard, our results suggest a U-shaped relationship between the levels of urbanization and the positive effect of pubs on house prices, indicating a much stronger effect of pubs in most rural LAs and, to a lesser extent, in ‘Major Urban’ LAs, with the same effect being significantly weaker in ‘Other Urban’ LAs.
Although the findings of our analysis provide an original contribution to the field, they also present some limitations. For instance, the urban-rural classification used to develop our analysis, while providing an important tool to discern between more urbanized and less urbanized areas at the sub-regional level, and to identify more rural LAs, still does not account the potential variation within LAs. For example, LAs located in Cumbria or Cornwall, while presenting lower levels of urbanization compared to other areas (e.g. Greater London or the West Midlands), may still have heavily urbanized pockets due to high population density and concentration of services and infrastructures in restricted areas. Given the range of observations and information provided in the dataset analysed in this study, controlling for LA size, population or even urban/rural classification should help to investigate trends and relationships within these groups.
In conclusion, findings gathered from this study provide significant information and new knowledge about the decline of pubs in Great Britain and its effects on the housing market at a local level. The evidence presented and discussed in this paper, while providing an incentive for further studies, can also give practitioners and policymakers more accurate instruments to design and implement policies in support of pubs.
Disclosure statement
No potential conflict of interest was reported by the author(s).
Notes
1 For purposes of comparability, the study uses data from England, Scotland and Wales, and excludes Northern Ireland.
2 Data available at lower administrative levels, such as ward and parishes, were considered with regard to creating the dataset, although significant gaps were detected. Similarly, we focused on LAs instead of Output Areas (OA) as these provided a much clearer discerning in terms of urban/rural; urban/rural mixes were avoided where possible in our analysis.
References
- Andrews, D., & Turner, S. (2012). Is the pub still the hub? International Journal of Contemporary Hospitality Management, 24(4), 542–552. doi: https://doi.org/10.1108/09596111211226815
- Armstrong, R. J., & Rodriguez, D. A. (2006). An evaluation of the accessibility benefits of commuter rail in Eastern Massachusetts using spatial hedonic price functions. Transportation, 33, 21–43. doi: https://doi.org/10.1007/s11116-005-0949-x
- Baum-Snow, N., & Kahn, M. E. (2000). The effects of new public projects to expand urban rail transit. Journal of Public Economics, 77, 241–263. doi: https://doi.org/10.1016/S0047-2727(99)00085-7
- Bibby, P., & Shepherd, J. (2004). Developing a new classification of urban and rural areas for policy purposes – the methodology. Report for the Department for Environment, Food and Rural Affairs, Countryside Agency. Retrieved from http://www.econsultation.net/ru/method_paper_final.pdf
- Botterman, S., Hooghe, M., & Reeskens, T. (2012). ‘One size fits all’? An empirical study into the multidimensionality of social cohesion indicators in Belgian local communities. Urban Studies, 49(1), 185–202. doi: https://doi.org/10.1177/0042098010397397
- Bowler, I., & Everitt, J. (1999). Production and consumption in rural service provision: The case of the English village pub. In: N. Walford, J. Everitt, & D. Napton (Eds.), Reshaping the countryside: Perceptions and processes of rural change (pp. 147–156). Oxford: CABI.
- Breunig, R., Hasan, S., & Whiteoak, K. (2019). Value of playgrounds relative to green spaces: Matching evidence from property prices in Australia. Landscape and Urban Planning, 190. doi: https://doi.org/10.1016/j.landurbplan.2019.103608
- British Beer and Pubs Association. (2015). Statistical Handbook – a compilation of drinks industry statistics. London: Brewing.
- Brooks, C., & Tsolacos, S. (2010). Real estate modelling and forecasting. Cambridge: Cambridge University Press.
- Cabras, I. (2011). Industrial and provident societies and village pubs: Exploring community cohesion in rural Britain. Environment and Planning A, 43(4), 2435–2451.
- Cabras, I., & Bosworth, G. (2014). Embedded models of rural entrepreneurship: The case of pubs in Cumbria. North West of England. Local Economy, 29(6–7), 598–616. doi: https://doi.org/10.1177/0269094214544276
- Cabras, I., & Lau, C. K. (2019). The availability of local services and its impact on community cohesion in rural areas: Evidence from the English countryside. Local Economy, 34(3), 248–270. doi: https://doi.org/10.1177/0269094219831951
- Cabras, I., & Mount, M. (2017). Assessing the impact of pubs on community cohesion and wellbeing in the English countryside: A longitudinal study. International Journal of Contemporary Hospitality Management, 29(1), 55–79. doi: https://doi.org/10.1108/IJCHM-12-2015-0717
- Cabras, I., & Reggiani, C. (2010). Village pubs as a social propellant in rural areas: An econometric study. Journal of Environmental Planning and Management, 53(7), 947–962. doi: https://doi.org/10.1080/09640568.2010.495488
- Campaign for Real Ale. (2012). CAMRA releases new national pub closure research. Retrieved from http://www.camra.org.uk/page.php?id=33&filternews2=May%202012
- Carpenter, J. (2009). Local asset measures could save vital pubs. Regeneration and Renewal, 7, 27.
- Chen, D., & Chen, S. (2016). Particulate air pollution and real estate valuation: Evidence from 286 Chinese prefecture-level cities over 2004–2013. Energy Policy, 109, 884–897. doi: https://doi.org/10.1016/j.enpol.2017.05.044
- Copus, A., & Skuras, D. (2006). Business networks and innovation in selected lagging areas of the European Union: A spatial perspective. European Planning Studies, 14(1), 79–93. doi: https://doi.org/10.1080/09654310500339885
- Costello, L. (2007). Going bush: The implications of urban-rural migration. Geographical Research, 45(1), 85–94. doi: https://doi.org/10.1111/j.1745-5871.2007.00430.x
- Crawford, A., & Flint, J. (2009). Urban safety, anti-social behaviour and the night-time economy. Criminology & Criminal Justice, 9(4), 403–413. doi: https://doi.org/10.1177/1748895809343390
- Ding, W., Xheng, S., & Guo, X. (2010). Value of access to jobs and amenities: Evidence from new residential properties in Beijing. Tsingua Science and Technology, 15(5), 595–603. doi: https://doi.org/10.1016/S1007-0214(10)70106-1
- DiPasquale, D., & Wheaton, W. C. (1992). The markets for real estate assets and space: A conceptual framework. Real Estate Economics, 20(2), 181–198. doi: https://doi.org/10.1111/1540-6229.00579
- Feng, A., & Humphreys, B. (2018). Assessing the economic impact of sports facilities on residential property values: A spatial hedonic approach. Journal of Sports Economics, 19(2), 188–210.
- Figlio, D. N., & Lucas, M. E. (2004). What’s in a grade? School report cards and the housing market. American Economic Review, 94, 591–604. doi: https://doi.org/10.1257/0002828041464489
- Foster, N. (2013). How to bolster the real estate market. New York Times, January 3. Retrieved from http://www.nytimes.com/2013/01/04/greathomesanddestinations/how-to-bolster-the-real-estate-market.html
- Garretsen, H., & Marlet, G. (2015). Amenities and the attraction of Dutch cities. Regional Studies, 51(5), 724–736. doi: https://doi.org/10.1080/00343404.2015.1135239
- Gibbons, S. (2004). The costs of urban property crime. The Economic Journal, 114(499), 441–463. doi: https://doi.org/10.1111/j.1468-0297.2004.00254.x
- Glaeser, E. L. (2008). Cities, agglomeration, and spatial equilibrium. Oxford: Oxford University Press.
- Higgins, D., Toms, S., & Uddin, M. (2016). Vertical monopoly power, profit and risk: The British beer industry, c. 1970–c. 2004. Business History, 58(5), 667–693. doi: https://doi.org/10.1080/00076791.2015.1041381
- Hincks, S., Webb, B., & Wong, C. (2014). Fragility and recovery: Housing, localities and uneven spatial development in the UK. Regional Studies, 48(11), 1842–1862. doi: https://doi.org/10.1080/00343404.2012.761687
- Holly, S., & Jones, H. (1997). House prices since the 1940s: Cointegration, demography and asymmetries. Economic Modelling, 14(4), 549–565.
- Holmes, M., & Grimes, A. (2008). Is there long-run convergence among regional house prices in the UK? Urban Studies, 45(8), 1531–1544. doi: https://doi.org/10.1177/0042098008091489
- Hough, M., & Hunter, G. (2008). The 2003 licensing Act’s impact on crime and disorder: An evaluation. Criminology and Criminal Justice, 8(3), 239–260. doi: https://doi.org/10.1177/1748895808092428
- Kapman, J., & Aru, D. (2017). The huge difference in house prices in neighbourhoods right next to each other. Wales Online, Press Release 20 July. Retrieved from https://www.walesonline.co.uk/lifestyle/welsh-homes/huge-difference-house-prices-neighbourhoods-13348717
- Lincoln, G. (2006). Diversification in rural pubs: A strategy for survival and community value? International Journal of Entrepreneurship and Small Business, 3(3/4), 329–347.
- Maye, D., Ilbery, B., & Kneafsey, M. (2005). Changing places: Investigating the cultural terrain of village pubs in South Northamptonshire. Social and Cultural Geography, 6(6), 831–847. doi: https://doi.org/10.1080/14649360500353079
- Mizon, G. E. (1995). A simple message for autocorrelation correctors: Don’t. Journal of Econometrics, 69(1), 267–288. doi: https://doi.org/10.1016/0304-4076(94)01671-L
- Mount, M., & Cabras, I. (2016). Community cohesion and village pubs in Northern England: An econometric study. Regional Studies, 50(7), 1203–1216. doi: https://doi.org/10.1080/00343404.2014.989150
- Office for National Statistics. (2016a). Census statistics. London: Office for National Statistics.
- Office for National Statistics. (2016b). Annual business inquiry. London: Office for National Statistics.
- Oldenburg, R. (1989). The great good place. New York, NY: Marlowe and Company.
- Parliament. (2007). Sustainable communities act. London: Eland House. Ref: 07LGSR050080
- Parliament. (2017). Neighbourhood Planning Act; Chapter 2. London: HM Stationery Office.
- Pateman, T. (2011). Rural and urban areas: Comparing lives using rural/urban classifications. Regional Trends, 43(1), 11–86. doi: https://doi.org/10.1057/rt.2011.2
- Pratten, J. D. (2007). The development of the modern UK public house – part 1: The traditional British public house of the twentieth century. International Journal of Contemporary Hospitality Management, 19(4), 335–342. doi: https://doi.org/10.1108/09596110710747670
- Preece, D. (2016). Turbulence in UK public house retailing: Ramifications and responses. In I. Cabras, D. Higgins, & D. Preece (Eds.), Brewing, beer and pubs: A global perspective (pp. 247–265). London: Palgrave Macmillan.
- Putman, R. (2000). Bowling alone: The collapse and revival of American community. New York, NY: Simon & Schuster Paperbacks.
- Rabe-Hesketh, S., & Skrondal, A. (2008). Multilevel and longitudinal modeling using Stata (2nd ed.). College Station, TX: Stata Press.
- Raudenbush, S. W., & Bryk, A. (2002). Hierarchical Linear Models (2nd ed.). Thousand Oaks, CA: Sage.
- Rosen, S. (1974). Hedonic prices and implicit markets: Product differentiation in pure competition. Journal of Political Economy, 82(1), 34–55. doi: https://doi.org/10.1086/260169
- Scott, M. (2002). Delivering integrated rural development: Insights from Northern Ireland. European Planning Studies, 10(8), 1013–1025. doi: https://doi.org/10.1080/0965431022000031284
- Smith, L., & Foxcroft, D. (2009). Drinking in the UK. An exploration of trends. Report, Joseph Rowntree Foundation, UK, June. Retrieved from http://www.jrf.org.uk/sites/files/jrf/UK-alcohol-trends-FULL.pdf
- Tepilo. (2015). Our 2015 Buyer Barometer. Retrieved from https://www.tepilo.com/advice/2015/9/our-2015-buyer-barometer
- Tierney, J. (2006). 'We want to be more European': The 2003 Licensing Act and Britain's night-time economy. Social Policy and Society, 5(4), 453–460.
- Whitehead, A. (2002). Meta-analysis of controlled clinical trials. Chichester: Wiley.
- Zhang, L. (2016). Flood hazard impact on neighbourhood house prices: A spatial quantile regression analysis. Regional Science and Urban Economics, 60, 12–19. doi: https://doi.org/10.1016/j.regsciurbeco.2016.06.005