
 ?Mathematical formulae have been encoded as MathML and are displayed in this HTML version using MathJax in order to improve their display. Uncheck the box to turn MathJax off. This feature requires Javascript. Click on a formula to zoom.
ABSTRACT
This paper explores the spatial patterns and underlying determinants of repeated inventor collaboration across European NUTS 3 regions. It is found that only a small fraction of co-inventor linkages across regions are repeated, while community detection reveals that these collaborations are clustered in geographical space more intensively compared with collaboration in general. Additional results from gravity modelling indicate that links in the inter-regional co-inventor network emerge mainly through the triadic collaboration of regions, while geographical proximity becomes the most influential factor for repeating co-inventor ties. In addition to that, the combination of technological similarity and shared third partner regions offer a premium for the likelihood of repeating a collaboration, but only when geographical proximity is present as an enabler. Hence, repeated inter-regional co-inventor collaborations are more likely to revert to spatial clustering, contributing to the fragmentation of the European Research Area.
1. Introduction
In order to enhance the competitiveness of economic actors across the European Union, considerable effort has been pledged to boosting innovative capacity through research and development (R&D) investments (European Commission Citation2010). However, the most promising innovative actors tend to be geographically concentrated in already more successful locations (Usai Citation2011). EU15 countries outperform the later-joined EU13 countries in terms of research and innovation (R&I) activities (Delanghe, Muldur, and Soete Citation2009; Quaglio et al. Citation2020), all the while within-country differences in innovative capacity are also substantial (Crescenzi, Rodriguez-Pose, and Storper Citation2007). Efforts to increase public R&D expenditures were set back in the aftermath of the 2008 crisis (Rodríguez-Pose Citation2020), while the impact of the ongoing pandemic is likely to be considerable as well. Additionally, regions across Europe have demonstrated disparities in the ability to translate innovative activity to economic growth (Rodríguez-Pose Citation2020). These processes amount to a lasting innovation divide amongst EU regions.
Integration and the promotion of knowledge-sharing collaboration across regions is central to the strategy of the EU to alleviate this innovation divide (European Commission Citation2020). Collaboration is expected to improve overall R&I performance, as knowledge production and innovation increasingly relies on combining the knowledge of multiple actors (Jones Citation2009). Additionally, collaborative R&I activity holds the potential to connect lagging regions and territories of the EU13 countries more tightly to the core of European R&I activities (Lengyel and Leskó Citation2016), to facilitate knowledge sharing across regions (Hoekman et al. Citation2013; Broekel Citation2015; De Noni, Orsi, and Belussi Citation2018) and ultimately to decrease regional differences in R&I capacity. Hence, it is an explicit aim of initiatives like the European Research Area (ERA) to improve R&I collaboration between EU regions (Frenken, Hoekman, and van Oort Citation2007; Council of the European Union Citation2009; Harrap and Doussineau Citation2017).
To explore potential obstacles and opportunities for inter-regional R&I related cooperation, scholars from different fields have studied the spatial networks of knowledge sharing and collaboration in the EU (e.g. Breschi and Cusmano Citation2004; Roediger-Schluga and Barber Citation2008; Maggioni, Nosvelli, and Uberti Citation2007; Maggioni and Uberti Citation2009; Scherngell and Lata Citation2013). This stream of studies reveals fragmentation for multiple forms of R&I-related collaboration between territories. Co-inventor ties of patent collaboration form spatial communities that resemble national borders or include groups of regions in neighbouring countries (Chessa et al. Citation2013). Under the EU Framework Programme (FP), collaborative R&D activities between member states have become more integrated during the period of 2003–2017, but the EU13 countries are still dominantly engaged in technologies of lower complexity (Balland, Boschma, and Ravet Citation2019). Finally, while collaboration on scientific publications is less determined by territorial borders due to EU integration efforts, cooperation is still predominant between geographically proximate actors (Hoekman, Frenken, and Tijssen Citation2010), and more complex scientific knowledge tends to cluster in regions in the North and West of Europe (Heimeriks et al. Citation2019).
However, to fully appreciate the relational structure of such collaborations across European regions, repeated collaborations also need to be explored. That is, we need to better understand how the repeating of collaboration to produce knowledge shapes cohesion in the ERA. Repeated collaboration may enhance the effectiveness of collaborative agreements (Zollo, Reuer, and Singh Citation2002), and the performance of partners (Goerzen Citation2007), and may facilitate the exchange of more complex knowledge (Reagans and McEvily Citation2003; Sorenson, Rivkin, and Fleming Citation2006), but may also decrease the quality of inventive outcome (Beaudry and Schiffauerova Citation2011), and reinforce fragmentation through the formation of closed clubs (Balland, Boschma, and Ravet Citation2019). Therefore, the aim of this paper is to map the structure of European inter-regional co-inventor ties, and to test how multiple dimensions of similarity shape the spatial pattern of repeated inventive collaboration.
The analysis is based on patents filed at the European Patent Office from the EU28 and continental EFTA countries (Norway and Switzerland) between 2006 and 2010. To investigate the geographies of repeated collaboration, we construct an inter-regional co-inventor network on the level of NUTS 3 regions and identify repeated co-inventor relationships from before 2006. To characterize the spatial patterns of the full collaboration network and the network of repeated ties, we apply a community finding algorithm (Blondel et al. Citation2008) on both networks. We also investigate how repeated co-inventor ties, compared with co-inventorhsip in general, depend on geographical distance (Liben-Nowell et al. Citation2005; Lambiotte et al. Citation2008; Lengyel et al. Citation2015), the overlap between technological portfolios of regions (Maggioni, Nosvelli, and Uberti Citation2007; Maggioni and Uberti Citation2009) and the number of third regions as common partners (Hazir and Autant-Bernard Citation2014). We also apply a multivariate gravity equation approach (Maggioni, Nosvelli, and Uberti Citation2007; Broekel et al. Citation2014) to test these factors and their joint effect on the repeating of co-inventor ties between regions.
In short, our results indicate that inter-regional co-inventor ties are rarely repeated, but many regions are linked through these collaborations. Repeated co-inventor ties are concentrated on a smaller geographical scale compared with collaboration in general. While gravity modelling for the overall and the repeated collaboration networks show similar patterns, a feature unique to repeated collaboration is a very strong and positive correlation between the three-way interaction of similarities between regions and the number of such ties. These results contribute to the geography of innovation literature by showing how repeated co-inventor collaborations are structured and by complementing recent studies of multiple European contexts in finding that repeated ties in collaborative knowledge production seem to be the exception (Balland, Boschma, and Ravet Citation2019; Fritsch and Zoellner Citation2020; Fritsch and Kudic Citation2021).
In Section 2 we explain the relevance of repeated inter-regional co-inventor ties. Section 3 describes the data, the community detection method, the variables and the estimation strategy of our gravity approaches. Empirical results are detailed in Section 4, while Section 5 offers a discussion of the findings.
2. The relational structure of collaborative knowledge production across European regions
While knowledge is an increasingly important ingredient for securing competitive advantage and economic development (Foray and Lundvall Citation1998), it's production is achieved more and more through the collaboration of knowledgeable actors of narrow expertise (Jones Citation2009). As collaboration imposes co-ordination costs on the parties involved (Jackson Citation2008), similarity and geographical proximity among them can facilitate knowledge exchange. Indeed, it is well established by now that knowledge sharing is highly concentrated and mostly takes place in dense, local networks (Singh Citation2005; Breschi and Lissoni Citation2009). However, at a more systemic level this means that the resources necessary for a desired level of innovative activity are likely distributed amongst multiple agents and locations (Martin and Sunley Citation2007). Hence, even though distant connections are relatively sparse compared with local interactions, inter-regional ties can bring novel ideas and new knowledge to regional economies, thus fostering internal innovation processes (Bathelt, Malmberg, and Maskell Citation2004; Fitjar and Huber Citation2014; De Noni, Orsi, and Belussi Citation2018). As the involved parties are from different locations and institutional settings, these linkages enable the combination of a greater variety of knowledge in the innovation process. Finally, evidence also indicates that both agglomeration and collaboration networks matter for R&D productivity at different stages of the knowledge production process (Varga, Pontikakis, and Chorafakis Citation2014).
Hence, increasing the performance and integration of collaborative knowledge production is a central pursuit for the European Union (European Commission Citation2020), all the while considerable effort has been dedicated in academia to understand the relational structure and determinants of such collaborations across European regions. Prominent instantiations of inter-regional knowledge production studied in this literature include joint participation in FP projects (Breschi and Cusmano Citation2004; Maggioni, Nosvelli, and Uberti Citation2007, Citation2014; Maggioni and Uberti Citation2009; Scherngell and Barber Citation2009; Hoekman et al. Citation2013; Hazir and Autant-Bernard Citation2014; Wanzenböck, Scherngell, and Brenner Citation2014; Balland, Boschma, and Ravet Citation2019; Sebestyén et al. Citation2021), co-patenting and co-inventor collaborations (Maggioni, Nosvelli, and Uberti Citation2007; Hoekman, Frenken, and Van Oort Citation2009; Maggioni and Uberti Citation2009; Chessa et al. Citation2013; Wanzenböck, Scherngell, and Brenner Citation2014) and scientific co-publication (Hoekman, Frenken, and Van Oort Citation2009, Citation2010, Citation2013; Chessa et al. Citation2013; Wanzenböck, Scherngell, and Brenner Citation2014). This research indicates that the ERA has a dense hierarchical core (Breschi and Cusmano Citation2004; Hoekman, Frenken, and Van Oort Citation2009), and while signs of integration are present with respect to FP participation of EU15 and EU13 countries (Balland, Boschma, and Ravet Citation2019), by and large Europe remains fragmented along national innovation systems (Chessa et al. Citation2013). In addition, while joining in on collaborative knowledge production for regions of CEE countries offers benefits in terms of patent quality, it also leads to polarization in the technological profiles of those that managed to connect to partners in other regions, and those that did not (Lengyel and Leskó Citation2016).
Investigation into the determinants and constraints of collaborative knowledge production revealed that the proximity of the parties involved is a key driver in these networks (e.g. Fleming and Frenken Citation2007; Balland Citation2012; Broekel and Boschma Citation2012; Brenner, Cantner, and Graf Citation2013; Ter Wal Citation2013; Cassi and Plunket Citation2015; Crescenzi, Nathan, and Rodríguez-Pose Citation2016; Cantner, Hinzmann, and Wolf Citation2017). Proximity here means the degree to which collaborators are similar to one another along different dimensions, including geographical location, domains of expertise, institutional context, social norms and organizational background (e.g. Torre and Rallet Citation2005; Boschma Citation2005). This micro-level observation is reflected in the geography of inter-regional collaborations of knowledge production across Europe as well. First, geographical proximity remains important, as less distant regions tend to collaborate more in terms of patenting, scientific publication and FP projects (Maggioni, Nosvelli, and Uberti Citation2007; Hoekman, Frenken, and Van Oort Citation2009, Citation2010; Maggioni and Uberti Citation2009; Hazir and Autant-Bernard Citation2014). Second, similarity with respect to technological portfolios of regions was found to increase the likelihood of inter-regional collaboration (Maggioni, Nosvelli, and Uberti Citation2007; Maggioni and Uberti Citation2009), as such similarity may facilitate combining extra-regional knowledge for both regions involved. Third, collaboration tends to emerge between regions that have existing ties to common third regions, reflecting in space the development of new connections in the underlying R&D cooperation network (Hazir and Autant-Bernard Citation2014).
What is missing from these accounts is how repeated inter-regional collaboration is structured and how the above drivers of spatial collaboration patterns affect these relations in particular. Exploring repeated interactions in collaborative knowledge production is important as it is unclear based on the literature how this type of inter-region collaborations affect innovative performance. The aim of this study is to provide insights on these collaborations in the context of inter-regional co-inventor networks across Europe.
On the one hand, repeated collaborations may be beneficial for knowledge production. Inventors represent the most immediate and influential social environment for the technical contents of an invention, they stay in touch for the duration of the collaboration and could get in touch again later (Breschi and Lissoni Citation2005). Hence, past collaborators may represent know-who in terms of missing technical competences needed in a subsequent R&D project and re-establishing co-operation among inventors who have worked together previously may be less costly due to mutual past experience. Inventors regularly collaborating with one another may receive additional benefits by developing deeper understanding towards each other through the invention process. Such established relationships facilitate the development of more complex technological solutions (Reagans and McEvily Citation2003; Sorenson, Rivkin, and Fleming Citation2006; Aral Citation2016), the repeating of a collaboration also signals stability, trust, mutual interest (Seabright, Levinthal, and Fichman Citation1992) and represents long-term strategies for collaboration (Dahlander and McFarland Citation2013; Goerzen Citation2007). Therefore, in the context of an inter-regional co-inventor network, many repeated connections can indicate that regions are relative well connected by relationships that involve these benefits. Additionally, numerous repeated ties to distant places can act as established pipelines that bring new technological knowledge to the regional economy. This is important as recent studies indicate that channels to extra-regional knowledge open up the possibility for diversification into new technologies (Balland and Boschma Citation2021; Whittle, Lengyel, and Kogler Citation2020).
On the other hand, arguments can be put forward that the repeated collaboration of inventors may be detrimental to knowledge production. Repeated cooperation means more shared time, which implies heavy opportunity costs (Uzzi Citation1997; Goerzen Citation2007), especially when the repeating of collaboration is frequent. In such cases the growing overlap of knowledge bases also contributes to the circulation of redundant knowledge. For instance, case-study evidence indicates that the repeated collaboration of inventors has a negative impact on the resulting patent quality (Beaudry and Schiffauerova Citation2011). This means that in an inter-regional co-inventor network, regions connected by many repeated collaborations can limit their access towards diverse knowledge sources and might face a lock-in situation in the long run (Malerba Citation2009; Boschma and Frenken Citation2010). A high overlap between inter-regional collaboration networks over time is indicative of the formation of closed clubs, that would go against the aim of an integrated research area across Europe. While such overlap was found to be relatively rare for the FP project network of EU countries (Balland, Boschma, and Ravet Citation2019), research into the geography of scientific co-publication and co-patenting indicates the presence of elite structures (Hoekman, Frenken, and Van Oort Citation2009), meaning that regions hosting high quality scholars and funding tend to network among themselves.
In the following, we explore the spatial structure of co-inventor linkages and repeated co-inventor linkages between European regions, and model how geographical proximity, similar technology portfolios and ties to common third regions affect the formation of these collaboration networks.
3. Data and methods
3.1. Data
For the analysis, we use the full set of patents authored by European inventors and registered by the European Patent Office (EPO). Patents became a widely used data source to construct such networks as they offer granular information on the location of inventors and on the invented technology for a relatively long period of time (Griliches Citation1990; Desrochers Citation1998). Notwithstanding these merits, it is also widely acknowledged in the literature that patent data has its drawbacks, as some industries are more prone to patenting than others (e.g. Graf and Henning Citation2009), and patents represent only a partial picture of inventors’ social networks in particular, and cooperation for innovation more generally (Fritsch, Titze, and Piontek Citation2020). Therefore, our analysis shows only a partial account on inter-regional collaborative knowledge production.
The data is from the publicly available OECD REGPAT 2015 Database that contains the year of filing, the technological classes of patents, the unique identifier of inventors and the region of their residence. offers an overview of the data management process. For every patent the database includes a unique ID and location information at the NUTS 3 level of the inventor(s), as well as different technology classes (4-digit IPC class in our case) that the patent was assigned to (Step 1).
Figure 1. Schematic visualization of deriving the inter-regional co-inventor network. Source: Own illustration.
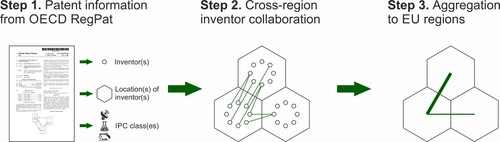
From this patent information, we derive the inventor collaboration network, in which two inventors are linked if they co-authored at least one patent over the 2006 to 2010 period (Step 2). Patents can be considered an outcome observed at the end of a successful collaboration, and while evidence indicates that R&D project collaboration tends to take up about 2–3 years, there is also considerable variation associated with this (Greve et al. Citation2010; Phelps Citation2010; Ramlogan and Consoli Citation2014). We opted for considering an inventor-inventor tie repeated, if the inventors had co-authored at least one patent in the 1991–2005 period as well. This implies that repeated collaboration in our analysis will represent a combination of frequently recurring co-operations and collaborations where inventors work together after a hiatus.
Finally, we aggregate the co-inventor network on the region-region level so that the tie weights between regions are proportional to the number of inventor collaborations between regions in the 2006 to 2010 period (Step 3). In a similar fashion, we aggregate repeated co-inventor links on the region-region level. Admittedly, a drawback of basing the inter-regional collaboration network on individuals as opposed to organizations is that boundaries of the firm are not considered (Ter Wal and & Boschma Citation2009). Inventors in a corporate setting in particular may have limited agency in creating and repeating collaboration ties and so organizational strategy may also be reflected in the observed patterns of repeated inter-regional collaboration. An alternative would be to derive the inter-regional network from collaborative ties between organizations. However, co-patenting at the organizational level tends to be rare (Ter Wal and & Boschma Citation2009; Fritsch and Zoellner Citation2020), likely due to the fact that cooperating companies prefer to avoid the legal complexity involved in co-patenting by dividing patents from joint R&D effort (Hagedoorn Citation2003). Finally, critical to our investigation on spatial patterns, patents of multi-establishment companies tend to be assigned to the headquarters of these firms (Ter Wal and & Boschma Citation2009), which is amplified by the fact that bigger firms tend to patent more while they are also more likely to have multiple branches. For these reasons we opt for the co-inventor level when deriving the network. Additionally, the aggregation of ties also implies that our results should be less sensitive to the potential issues related to inventor identification over time and space (Raffo and Lhuillery Citation2009; Schoen, Heinisch, and Buenstorf Citation2014) and show general patterns at a large scale even when the collaboration between inventors cannot be observed directly.
3.2. Variables for modelling inter-regional co-inventor ties
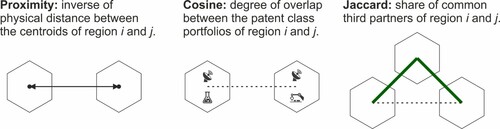
illustrates the three key variables involved in the empirical analysis. First, geographical proximity between regions
and
is calculated as
, where
denotes the physical distance measured in kilometres between the centroids of each region. Second, a common way of quantifying technological similarity between two regions
and
is to calculate the cosine similarity (
) of their patent portfolio vectors
and
. This variable is defined as
, where the numerator is the inner product of the regional patent portfolios. These portfolios contain the patents made between 2000 and 2005 for each 4-digit IPC class in the region. The denominator is the product of the Euclidean length of each patent portfolio vector (Schütze, Manning, and Raghavan Citation2008). In our case cosine similarity ranges from zero to one, where zero is the case of perfectly unrelated portfolios and one represents complete similarity. Finally, to capture the share of common third partners for each pair of regions, we use the Jaccard index, that measures the overlap between finite sample sets and is defined as the cardinality of the intersection divided by the cardinality of the union (Leydesdorff Citation2008):
, where
and
refer to the underlying collaboration vectors of regions
and
for the 2000-2005 period. This variable ranges from zero to one, where higher values indicate a higher share of common third partners.
Figure 2. Schematic visualization of the network variables. Source: Own illustration.
To make the comparison of coefficients easier, the three main explanatory variables are rescaled to zero mean z-scores, where a unit change in z-score is equivalent to one standard deviation in the original variable. presents the descriptive statistics for these three key variables.
Table 1. Descriptive statistics and correlation of the standardized main explanatory variables.
3.3. Applied methods: community detection, gravity approach and regression design
As an initial step, we characterize the spatial community structure of (repeated) inter-regional co-inventor ties by using the Louvain algorithm (Blondel et al. Citation2008), a popular and effective method for partitioning a network through hierarchical clustering. This algorithm finds the best grouping of nodes – in our case a NUTS 3 region – in a network by optimizing the modularity of the community structure, which is the measure of link concentration within groups of the partitioning, rather than between them (Newman Citation2006). The modularityFootnote1 of the network's partitioning can be written as
where L is the total number of individual co-inventor links in the network,
is the total number of links for members of group
and
is the number of links within group
.
Next, we take a gravity approach, that is often applied in network science (Liben-Nowell et al. Citation2005; Lambiotte et al. Citation2008; Lengyel et al. Citation2015), to measure how distance decay (), cosine similarity of technological portfolios (
) and collaborations with the same third regions (
) change the probability of collaboration and repeated collaboration between two regions. Distance decay influences network density (Liben-Nowell et al. Citation2005) and thus yields spatial communities in and of itself (Expert et al. Citation2011). Because technological similarity of regions and having common third partners influence the establishment and repeating of collaboration (Maggioni, Nosvelli, and Uberti Citation2007; Ter Wal Citation2013; Juhász and Lengyel Citation2018), we consider probabilities as a function of these dimensions as well. We bin the distributions of region-region links into intervals for all three characteristics (denoted by
lower index). Then we calculate the probability of collaboration and repeated collaboration for every group such that
(1)
(1) where
is the number of observed individual co-inventor connections between regions
and
in the corresponding network, whereas
and
refer to the number of inventors in these regions who authored at least one patent in the 2006–2010 period, regardless whether they established a new collaboration or repeated an old one. To keep simplicity in the notation, we refer to time period 2006–2010 as
and to the previous period 2000–2005 as
.
Finally, we rely on a regression framework for disentangling the effect of multiple dimensions of similarity behind the spatial structure of the collaboration and repeated collaboration networks. Here the strength of region-region links is estimated in regression analyses with dyadic covariates and characteristics of both regions involved in the dyad. We look for differences in the correlation values of co-variates between the strength of collaboration and repeated collaboration ties on the same set of region-region links, for which the co-variates are identical. Therefore, a necessary condition for this analysis is the variation of collaboration versus repeated collaboration tie strengths. While his correlation is very strong (see Appendix Figure A1, see online Supplemental Material), it is paired with sufficient variance between these values.
The strength of collaboration and repeated collaboration between regions can be considered as count data of individual co-inventor links, in which most region-region links account for zero individual connections. Therefore, we apply a Zero-Inflated Negative Binomial (ZINB) regression, which consists of two parts (Greene Citation1994). The first equation in the ZINB modelling is often referred to as regime selection, which is employed to deal with excessive zeros in the data and is formulated as
(2)
(2) where we estimate the probability that a connection may develop between two regions. In the equation
is a dummy variable that takes the value of 1 if region
and region
are in the same country and
are a collection of region-level control variables that are commonly used in similar estimations.
The second equation refers to the count process, in which we estimate the number of co-inventor ties between regions by our three main variables
(3)
(3) where
is the strength of collaboration or repeated collaboration between regions
and
in the period of 2006-2010,
refers to geographical proximity, while
and
refer to variables explained above, based on data from the previous period 2000–2005. Besides transforming distance to proximity, which is important to have all correlations with identical signs, we standardize every variable so that coefficient sizes can be compared across varying scales. However, the correlation between geographical proximity, technological similarity and shared third connected regions call for better understanding. Therefore, in a further specification we include the interaction effect of our dichotomized main variables.Footnote2 For a more detailed explanation on ZINB specifications see Greene (Citation1994) and Burger, van Oort, and Linders (Citation2009).
4. Results
We summarize the major characteristics of inter-regional co-inventor ties in Europe in . First, out of more than 772 K inter-regional collaborations between inventors in 2006–2010, only every 18th tie was a repeated one. The low share of repeated collaboration signals that inventive knowledge is mostly produced through new collaborations. By aggregating these linkages to the level of European NUTS 3 regions, we get a weighted network of regions in which the weight of a region-region tie is the number of individual collaborations connecting the two. After the aggregation, the collaboration network of regions consists of nearly 47 K weighted ties, while a repeated collaboration exists only between one 7th of these region pairs. Consequently, the density of the repeated collaboration network is one magnitude lower than the density of the complete collaboration network. As repeated ties appear to be rare between both inventors and regions, we interpret the following results accordingly.
Table 2. Characteristics of the co-inventor network and the repeated collaboration network.
4.1. Spatial communities of inventor collaboration
Our findings reported in reveal a remarkably lower number of communities in the collaboration network, compared with the repeated collaboration network. These communities are groups of regions within which regions are relatively densely connected by collaboration ties, but regions across community borders are relatively loosely connected. The ‘modularity’ measure further demonstrates that repeated collaboration tends to be concentrated to a higher extent within these communities than collaboration in general. However, this difference is due to the lower level of network density of repeated collaboration links, as both networks show similar levels of relative modularity. Taken together, these findings show that repeated collaboration tends to be fragmented into region groups, much like it is the case for co-inventor collaboration in general (Chessa et al. Citation2013).
In we map both networks and their community structures. Since the overall collaboration network has too many links to fit meaningfully on a map, and also because the tie weights disperse on a large scale, we simplify this network into its maximum spanning tree for visualization. In it, every region is connected to every other region by only one path such that the sum of the tie weights is maximized. (A) reveals that most European countries have an outstanding innovation centre, in which collaboration is concentrated and these centres bridge the innovation system with other countries (e.g. in Spain, Sweden, Finland, Italy, Hungary and Romania). There is more than one centre in Poland, France and especially in Germany, where regional centres emerge from the maximum spanning tree. Most of these spatial structures are present in the repeated collaboration network as well, in which all ties are depicted in (B). Repeated collaboration is concentrated in single innovation hubs in Sweden, Finland, Italy, whereas two centres emerge in France (Paris and Lyon) and multiple centres in Germany, where these centres are strongly connected to each other.
Figure 3. Spatial patterns of inventor collaboration and repeated collaboration networks of European regions. Source: Own calculation based on OECD REGPAT 2015. Note: (A) The maximum spanning tree of the collaboration network across NUTS 3 regions in Europe reveals the importance of national centers. (B) Most of the repeated collaborations remain within country borders, and strongest ties are concentrated within close proximity of innovative hubs. (C) The 7 communities of the collaboration network span across countries, with the exception of Germany that is divided into two communities and Italy, but are mostly concentrated in large regions. (D) Repeated collaboration is organized into 23 smaller-scale clusters.
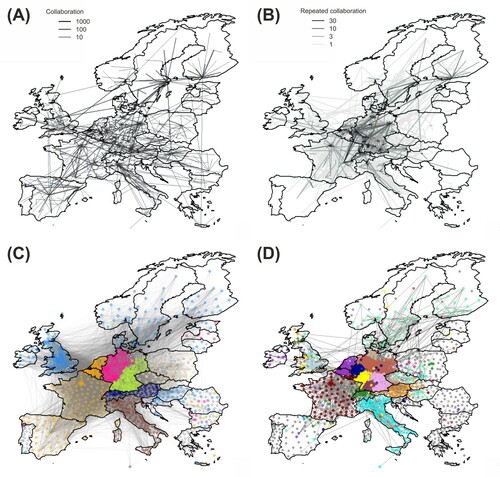
Both networks are organized into spatially bounded communities [(C,D)], which is not surprising since spatial community structures have been repeatedly found in social and communication networks (Lambiotte et al. Citation2008; Sobolevsky et al. Citation2013; Lengyel et al. Citation2015). Chessa et al. (Citation2013) also reported that communities of inventor collaboration are bounded by national borders in Europe. Our findings suggest that some of the communities expand countries: for instance, the community including the Benelux states, France and Spain. These communities contain neighbouring countries such as Switzerland and Austria or the community of Poland, Czech Republic and Slovakia. However, the United Kingdom, Hungary and Croatia are found to be in one community with the Scandinavian countries. We find that inventor collaboration in Italy is a separate network community. Interestingly, Germany is organized into two large communities that do not follow perfectly the East-West divide, as particularly the southern part of the country belongs to the same community as the eastern part. This may be a sign of reorganization of inventive collaboration after the fall of the Iron Curtain (Jun et al. Citation2017).
Repeated inter-regional collaborations are not organized by a universal pattern of spatial levels. In some cases, these communities represent countries (e.g. France and Italy), groups of countries (e.g. Belgium and the Netherlands or the Scandinavian countries), spatially clustered regions that span across countries (e.g. in the UK) and spatially concentrated communities with very few overlaps (in Germany). Nevertheless, all larger communities of inter-regional collaboration break into smaller ones of repeated collaboration. This finding suggests that collaboration is relatively more likely to be repeated between geographically proximate locations while collaboration in general is relatively more likely to bridge distant locations.
These results have implications with respect to the European innovation system, as one of the major R&I policy aims of the EU is to integrate disconnected national systems of innovation into the ERA in order to increase access to novelty and innovation output. Although inventor collaboration in general shows signs of ongoing integration, it is still bounded by national systems of innovation. Repeated collaboration, however, seems to be even more difficult to integrate into a unified ERA. In the following subsections we aim to better understand the determinants behind this geography of co-inventor collaborations.
4.2. Gravity approach on inter-regional co-inventor ties
In the next stage of the analysis, we explore the probability of repeated collaboration, compared with collaboration in general, as a function of distance, technological similarity and shared third partner regions (). Since we express these probabilities as observed over all possible ties for both networks, the smaller probability for repeated collaboration comes from the lower density of individual connections. However, these differences are surprisingly stable across all three distributions.
Figure 4. The probability of collaboration and repeated collaboration as a function of region-to-region characteristics. Source: Own calculation based on OECD REGPAT 2015. Note: (A) Distance () decay is smooth for geographically proximate collaboration and repeated collaboration, following a linear decay on log-log scale with the exponents −1.05 and −1.27 for distances larger than 100 km. (B) The overlap between technological profiles of regions, measured by cosine similarity (
), increases the probability of collaboration with a growing intensity as similarity rises. (C) The probability of collaboration grows linearly on a logarithmic scale as the share of common third connected regions, measured by Jaccard similarity (
), increases. The exponent is 3.86 for collaboration and 5.67 for repeated collaboration.
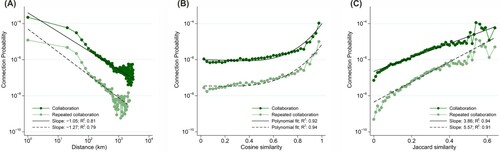
The exponent of distance decay in the repeated collaboration network is somewhat higher than in the complete collaboration network. This signals that the role of geographical proximity is more important for repeated collaborations because the probability of co-inventing decays faster as distance grows. However, these power laws can be fitted to the middle of the distance distribution only and curves are remarkably similar for distances smaller than 100 km [(A)]. Regarding technological similarity, we find that a polynomial fit captures the relationship between cosine similarity and link probability very well [(B)]. This suggests that a wide overlap of technological profiles of regions increases the probability of collaboration and repeated collaboration ties in a similar manner. Moreover, above a threshold of extensive technological similarity, these probabilities increase exponentially, revealing that collaboration is more likely between regions that have strongly similar technological profiles. In terms of shared third partners, we find that a higher value of Jaccard similarity is associated with a higher link probability. Linear fits on the semi-logarithmic graph indicate an exponential relationship, where the exponent is higher for repeated collaboration [(C)]. This indicates that tie-dependence is an important driver of repeated co-inventor interactions between regions.
Taken together these findings suggest that while the association between various dimensions of similarity and the likelihood of inter-regional collaboration show similar patterns for repeated collaboration and for collaboration in general, the former is subject to a more pronounced distance decay and is influenced more by the existence of common third partners. In the next section, we complement this exploration with regression analysis to investigate the interaction effect of these dimensions.
4.3. Regression analysis on inter-regional co-inventor ties
Multivariate gravity models enable us to compare coefficients of the three determinants of inter-regional collaboration and also informs us whether these coefficients differ for repeated collaboration and collaboration in general. Estimations of the regression model are illustrated in where point estimates are presented with their 95% confidence intervals. (A) depicts coefficients estimated from EquationEquation 3(3)
(3) . Because all three explanatory variables are standardized, coefficients show the expected change in the log number of collaboration and repeated collaboration in case there is one standard deviation change in the independent variable.
Figure 5. Results of the multivariate estimations. Source: Own calculation based on OECD REGPAT 2015. Note: (A) Considering single effects only, we observe that the probability of collaboration is mostly increased by common third partners, while repeated ties gain probability if regions are geographically proximate. (B) Interaction effects reveal that repeated ties gain extra probability if regions are geographically proximate, technologically similar and connected to the same set of regions at the same time.
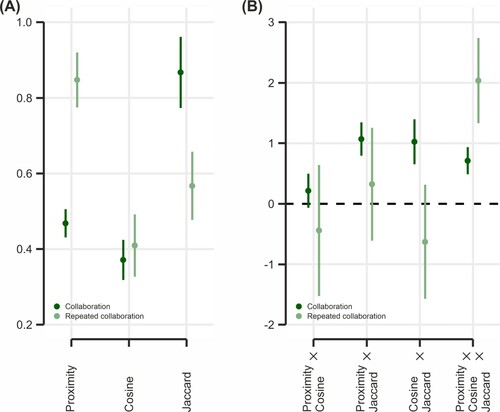
The findings suggest that geographical proximity is more important for repeated collaboration than what is observed in the full collaboration network. Technological similarity has a relatively small correlation with both values of collaboration and repeated collaboration across European regions. Interestingly, high shares of common third connected regions favour collaboration more but not so much the repeating of collaborations. These aggregate level findings are in line with previous results of Ter Wal (Citation2013) on co-inventor networks, who argues that cohesive network formation decreases costs and uncertainties for new link formation, but once the collaboration is established, geographical proximity is more important in decreasing the costs of maintaining and thus further strengthening these relations. The importance of geographical proximity gives a hint already at why spatial communities of repeated networks are of smaller spatial scale than the ones in the general collaboration network. Additional details of the parameter estimations are presented in Table A3 of the Appendix (see online Supplemental Material).
We applied a variety of robustness checks to validate our results. Collaboration ties can only be repeated in case they existed previously. This means that the number of repeated collaborations highly depends on the number of collaborations in the past. To take this deterministic process into account, as a first robustness check, we include the number of existing co-inventor ties between regions i and j, based on the 1991–2005 period. However, one can argue that in order to correctly estimate the repeating of collaborations, the sample must be narrowed down to regions with non-zero collaborations in the past. To do so, in another robustness check, we run our original model on repeated ties based only on the sub-sample of previously connected regions. These results are similar to the original estimation, but the different sample sizes would make the comparison of betas precarious. Additionally, repeated collaboration can be driven by intra-firm collaboration. As a further robustness check, we identified firms as assignees of patents and estimated regressions by keeping only those repeated ties where the collaboration happens across different firms. For this, we exclude those repeated collaborations where we found repeating sequences in the assignees’ names. As a theoretical example, patents made by ‘Best Toy Factory, Budapest’ and ‘Best Toy Factory, Paris’ are considered as intra-firm collaboration. These latter tests did not change our results substantially. Robustness checks are reported in Appendix (see online Supplemental Material) Table A3 Model 3, 4 and 5.
In (B), we illustrate the coefficients and 95% confidence interval of interaction terms of our main explanatory variables. Additional details of the estimations are presented in Table A4 of the Appendix (see online Supplemental Material). The interaction coefficients of ties in the full collaboration network are positive and significant in all cases when the Jaccard index is involved. This means that connections towards the same set of regions increases the effect of both geographical proximity and technological similarity. More importantly, we find that repeated collaboration is increased by interaction terms only if all three variables are included in the joint effect. This finding suggests that the repeating of inter-regional inventor collaboration in Europe gains extra likelihood when regions are geographically proximate, are similar in their technological profile and connected to the same set of other regions. Consequently, the communities of repeated collaboration are of smaller spatial scale not only because the effect of geographical proximity is at work, but also because this is coupled with technological similarity and shared third regional connections.
5. Conclusion
Collaborative knowledge production in an integrated ERA is a lasting pursuit of the European Union (Council of the European Union Citation2009; European Commission Citation2020), however a series of studies document the elusiveness of this aim (e.g. Hoekman, Frenken, and Van Oort Citation2009, Citation2010; Chessa et al. Citation2013), as well as that collaboration is subject to various dimensions of proximity (e.g. Breschi and Cusmano Citation2004; Roediger-Schluga and Barber Citation2008; Maggioni, Nosvelli, and Uberti Citation2007; Maggioni and Uberti Citation2009; Scherngell and Lata Citation2013). The aim of this paper has been to explore an aspect of such collaborations hitherto neglected in the related literature, namely the relational structure of those collaborations that were repeated over time. Deploying multiple tools of analysis in the context of inventor collaborations across European NUTS 3 regions, we found that only a small fraction of co-inventor linkages across regions are repeated, and they are clustered in geographical space more intensively compared with the complete collaboration network. Our results show that collaborations in the inter-regional co-inventor network emerge mainly through the triadic collaboration of regions, while geographical proximity becomes the most influential factor for the repeating of co-inventor collaboration. In addition to that, the combination of technological similarity and shared third partner regions offer a premium for the likelihood of repeated collaboration, but only when geographical proximity is present as an enabler.
Hence, these findings indicate that despite establishing the ERA, inventive knowledge production, as partially proxied in this paper by co-inventorship, is still fragmented into spatial formations resembling national systems of innovation. The results on repeated inter-regional collaboration add that collaborations involving inventors who have already worked together before are likely to revert to spatial clustering of co-inventorship between similar technological profiles, thus contributing to fragmentation.
What is curious is the relatively low share of repeated collaboration in inter-regional co-inventor activities. As argued earlier, such collaborations involve accumulated experience in working together, and consequently one could expect the emergence of more robust spatial and relational structures on the back of these connections. However, the fact that this type of collaboration in inter-regional co-inventorship is relatively rare points to a very dynamic system of knowledge production across Europe. According to the findings presented in this paper, higher order tie-dependence in the form of shared third partners brings more stability to these collaborations. As a result, our study does not find evidence on the formation of closed clubs in inter-regional co-patenting on the back of repeated collaboration. This way it complements the recent findings of Balland, Boschma, and Ravet (Citation2019) on a relatively low level of overlap between FP project collaboration networks over time, and evidence by Fritsch and Zoellner (Citation2020), showing that there is a high level of fluidity in German inter-regional co-inventor networks where only a small share of links between inventors carry over from a three year period to the next. These accounts are prompting the question why dyadic connections from various collaborative knowledge production efforts in the European spatial structure tend to not get carried over to future collaboration.
Taking up on this question goes beyond the confines and limitations of this paper and should be taken up in future research. First, as discussed earlier, it is unclear based on the literature whether repeated ties of inter-regional collaboration represent opportunities or threats with respect to the quality of knowledge produced. More broadly, it is unclear whether patents created in repeated collaborations are different from patents created in new collaborations. Second, it is unclear how and to what extent the observed pattern of repeated co-inventor collaboration reflects the strategic decision of organizations. Future research on this could shed light on how social network processes between inventors interact with the strategic decision making of organizations, resulting in the observed spatial structure of repeated collaboration. In this paper we could not engage with these questions due to lack of information. Third, we identified collaboration network dynamics in a simple way by looking at repeated ties that could be modelled using a gravity approach. However, the formation and repeating of collaboration ties are strongly influenced by the previous features of the network (Broekel et al. Citation2014). Hence, one might investigate network dynamics more in detail with more nuanced definitions of a tie and applying models that take network topology into account in a more sophisticated way. By doing so, one could reveal how network cohesion favours the repeating of individual ties and how technological profiles of inventors contribute to this process in geographical space.
Supporting_Informationnew.docx
Download MS Word (405.4 KB)Acknowledgements
The authors are thankful for the services of the Databank of the Centre for Economic and Regional Studies. The authors are grateful for comments received at the workshop of MIT Media Lab and The Institute for New Economic Thinking Young Scholars Initiative on ‘Innovation, Complexity and Economic Geography’, the ‘Innova 4’ workshop in the Joint Research Center of the European Commission in Ispra, the ‘4th RA X Networks’ workshop at Andrássy University Budapest, the 2018 Conference of the Hungarian Regional Science Association in Kecskemét and ICUBERD workshop at Pécs University. Z.E., S.J. and B.L. acknowledge the financial support received from Hungarian Scientific Research Fund (OTKA K-129207), G.T. would like to acknowledge funding from the Science Foundation Ireland (SFI) under the SFI Science Policy Research Programme (grant agreement No 17/SPR/5324, SciTechSpace).
Disclosure statement
No potential conflict of interest was reported by the author(s).
Notes
1 Because modularity is highly dependent on the size and density of the network, the mere comparison of the measure obtained from two networks - such as the full and repeated inter-regional collaboration networks - can be misleading. Hence, following Sah et al. (Citation2017), we calculate the relative modularity of the two networks by dividing the modularity () by the theoretical maximum (
), that would be achieved if all links were within the communities. We report these tests in Table A1 and Table A2 of the Appendix (see online Supplemental Material).
2 This transformation is neccesary because the three-way interactions of continous variables would be difficult to interpret otherwise.
References
- Aral, S. 2016. “The Future of Weak Ties.” American Journal of Sociology 121 (6): 1931–1939. doi:https://doi.org/10.1086/686293
- Balland, P. 2012. “Proximity and the Evolution of Collaboration Networks: Evidence from Research and Development Projects Within the Global Navigation Satellite System (GNSS) Industry.” Regional Studies 46 (6): 741–756. doi:https://doi.org/10.1080/00343404.2010.529121
- Balland, P., and A. Boschma. 2021. “Complementary Interregional Linkages and Smart Specialisation: an Empirical Study on European Regions.” Regional Studies. Published Online. doi:10.1080/00343404.2020.1861240
- Balland, P., R. Boschma, and R. Ravet. 2019. “Network Dynamics in Collaborative Research in the EU, 2003–2017.” European Planning Studies 27 (9): 1811–1837. doi:https://doi.org/10.1080/09654313.2019.1641187
- Bathelt, H., A. Malmberg, and P. Maskell. 2004. “Clusters and Knowledge: Local Buzz, Global Pipelines and the Process of Knowledge Creation.” Progress in Human Geography 28 (1): 31–56. doi:https://doi.org/10.1191/0309132504ph469oa
- Beaudry, C., and A. Schiffauerova. 2011. “Impacts of Collaboration and Network Indicators on Patent Quality: The Case of Canadian Nanotechnology Innovation.” European Management Journal 29 (5): 362–376. doi:https://doi.org/10.1016/j.emj.2011.03.001
- Blondel, V., J. Guillaume, R. Lambiotte, and E. Lefebvre. 2008. “Fast Unfolding of Communities in Large Networks.” Journal of Statistical Mechanics: Theory and Experiment 2008 (10): P10008. doi:https://doi.org/10.1088/1742-5468/2008/10/P10008
- Boschma, R. 2005. “Proximity and Innovation: A Critical Assessment.” Regional Studies 39 (1): 61–74. doi:https://doi.org/10.1080/0034340052000320887
- Boschma, R., and K. Frenken. 2010. “The Spatial Evolution of Innovation Networks. A Proximity Perspective.” In The Handbook of Evolutionary Economic Geography, edited by R. Boschma and K. Frenken, 120–135. Cheltenham: Edward Elgar.
- Brenner, T., U. Cantner, and H. Graf. 2013. “Introduction: Structure and Dynamics of Innovation Networks.” Regional Studies 47 (5): 647–650. doi:https://doi.org/10.1080/00343404.2013.770302
- Breschi, S., and L. Cusmano. 2004. “Unveiling the Texture of a European Research Area: Emergence of Oligarchic Networks Under EU Framework Programmes.” International Journal of Technology Management 27 (8): 747–772. doi:https://doi.org/10.1504/IJTM.2004.004992
- Breschi, S., and F. Lissoni. 2005. “Knowledge Networks from Patent Data.” In Handbook of Quantitative Science and Technology Research, edited by H. F. Moed, W. Glänzel, and U. Schmoch, 613–643. Dordrecht: Kluwer.
- Breschi, S., and F. Lissoni. 2009. “Mobility of Skilled Workers and Co-invention Networks: An Anatomy of Localized Knowledge Flows.” Journal of Economic Geography 9 (4): 439–468. doi:https://doi.org/10.1093/jeg/lbp008
- Broekel, T. 2015. “Do Cooperative Research and Development (R&D) Subsidies Stimulate Regional Innovation Efficiency? Evidence from Germany.” Regional Studies 49 (7): 1087–1110. doi:https://doi.org/10.1080/00343404.2013.812781
- Broekel, T., P. Balland, M. Burger, and F. van Oort. 2014. “Modeling Knowledge Networks in Economic Geography: a Discussion of Four Methods.” The Annals of Regional Science 53 (2): 423–452. doi:https://doi.org/10.1007/s00168-014-0616-2
- Broekel, T., and R. Boschma. 2012. “Knowledge Networks in the Dutch Aviation Industry: the Proximity Paradox.” Journal of Economic Geography 12 (2): 409–433. doi:https://doi.org/10.1093/jeg/lbr010
- Burger, M., F. van Oort, and G. Linders. 2009. “On the Specification of the Gravity Model of Trade: Zeros, Excess Zeros and Zero-Inflated Estimation.” Spatial Economic Analysis 4 (2): 167–190. doi:https://doi.org/10.1080/17421770902834327
- Cantner, U., S. Hinzmann, and T. Wolf. 2017. “The Coevolution of Innovative Ties, Proximity, and Competencies: Toward a Dynamic Approach to Innovation Cooperation.” In Knowledge and Networks, edited by J. Glückler, E. Lazega, and I. Hammer, 337–372. Cham: Springer.
- Cassi, L., and A. Plunket. 2015. “Research Collaboration in co-Inventor Networks: Combining Closure, Bridging and Proximities.” Regional Studies 49 (6): 936–954. doi:https://doi.org/10.1080/00343404.2013.816412
- Chessa, A., A. Morescalchi, F. Pammolli, O. Penner, A. Petersen, and M. Riccaboni. 2013. “Is Europe Evolving Toward an Integrated Research Area?” Science 339 (6120): 650–651. doi:https://doi.org/10.1126/science.1227970
- Council of the European Union. 2009. “Conclusions of the Council on the Definition of a ‘2020 Vision for the European Research Area’.” Official Journal of the European Union. 2009/C 25/01: 1–4.
- Crescenzi, R., A. Rodriguez-Pose, and M. Storper. 2007. “The Territorial Dynamics of Innovation: a Europe–United States Comparative Analysis.” Journal of Economic Geography 7 (6): 673–709. doi:https://doi.org/10.1093/jeg/lbm030
- Crescenzi, R., M. Nathan, and A. Rodríguez-Pose. 2016. “Do Inventors Talk to Strangers? On Proximity and Collaborative Knowledge Creation.” Research Policy 45 (1): 177–194. doi:https://doi.org/10.1016/j.respol.2015.07.003
- Dahlander, L., and D. McFarland. 2013. “Ties That Last: Tie Formation and Persistence in Research Collaborations Over Time.” Administrative Science Quarterly 58 (1): 69–110. doi:https://doi.org/10.1177/0001839212474272
- De Noni, I., L. Orsi, and F. Belussi. 2018. “The Role of Collaborative Networks in Supporting the Innovation Performances of Lagging-Behind European Regions.” Research Policy 47 (1): 1–13. doi:https://doi.org/10.1016/j.respol.2017.09.006
- Delanghe, H., U. Muldur, and L. Soete. 2009. European Science and Technology Policy: Towards Integration or Fragementation? Cheltenham: Edward Elgar.
- Desrochers, P. 1998. “On the Abuse of Patents as Economic Indicators.” The Quarterly Journal of Austrian Economics 1 (4): 51–74. doi:https://doi.org/10.1007/s12113-998-1026-z
- European Commission. 2010. Europe 2020: A European Strategy for Smart, Sustainable and Inclusive Growth. Brussels: European Commission.
- European Commission. 2020. Science, Research and Innovation Performance of the EU 2020. A Fair Green and Digital Europe. Brussels: European Commission.
- Expert, P., T. Evans, V. Blondel, and R. Lambiotte. 2011. “Uncovering Space-Independent Communities in Spatial Networks.” Proceedings of the National Academy of Sciences 108 (19): 7663–7668. doi:https://doi.org/10.1073/pnas.1018962108
- Fitjar, R., and F. Huber. 2014. “Global Pipelines for Innovation: Insights from the Case of Norway.” Journal of Economic Geography 15 (3): 561–583. doi:https://doi.org/10.1093/jeg/lbu017
- Fleming, L., and K. Frenken. 2007. “The Evolution of Inventor Networks in the Silicon Valley and Boston Regions.” Advances in Complex Systems 10 (01): 53–71. doi:https://doi.org/10.1142/S0219525907000921
- Foray, D., and B. Lundvall. 1998. “The Knowledge-Based Economy: From the Economics of Knowledge to the Learning Economy.” In The Economic Impact of Knowledge. , edited by D. Neef, G. A. Siesfeld, and J. Cefola, 115–121. Woburn, MA: Butterworth-Heinemann.
- Frenken, K., J. Hoekman, and F. van Oort. 2007. Towards a European Research Area. Rotterdam: Nai Publishers.
- Fritsch, M., M. Titze, and M. Piontek. 2020. “Identifying Cooperation for Innovation—a Comparison of Data Sources.” Industry and Innovation 27 (6): 630–659. doi:https://doi.org/10.1080/13662716.2019.1650253
- Fritsch, M., and M. Zoellner. 2020. “The Fluidity of Inventor Networks.” The Journal of Technology Transfer 45: 1063–1087. doi:https://doi.org/10.1007/s10961-019-09726-z
- Fritsch, M., and M. Kudic. 2021. “Micro Dynamics and Macro Stability in Inventor Networks.” The Journal of Technology Transfer. doi:10.1007/s10961-021-09851-8
- Goerzen, A. 2007. “Alliance Networks and Firm Performance: The Impact of Repeated Partnerships.” Strategic Management Journal 28 (5): 487–509. doi:https://doi.org/10.1002/smj.588
- Graf, H., and T. Henning. 2009. “: Public Research in Regional Networks of Innovators: A Comparative Study of Four East German Regions.” Regional Studies 43 (10): 1349–1368. doi:https://doi.org/10.1080/00343400802251460
- Greene, W. 1994. Accounting for Excess Zeros and Sample Selection in Poisson and Negative Binomial Regression Models. NYU Working Paper, No. EC-94-10.
- Greve, H., J. Baum, H. Mitsuhashi, and T. Rowley. 2010. “Built to Last but Falling Apart: Cohesion, Friction, and Withdrawal from Interfirm Alliances.” Academy of Management Journal 53 (2): 302–322. doi:https://doi.org/10.5465/amj.2010.49388955
- Griliches, Z. 1990. “Patent Statistics as Economic Indicators: A Survey.” Journal of Economic Literature 28 (4): 1661–1701.
- Hagedoorn, J. 2003. “Sharing Intellectual Property Rights—an Exploratory Study of Joint Patenting Amongst Companies.” Industrial and Corporate Change 12 (5): 1035–1050. doi:https://doi.org/10.1093/icc/12.5.1035
- Harrap, N., and M. Doussineau. 2017. “Collaboration and Networks: EU13 Participation in International Science.” JRC Policy Insights, Stairway to Excellence Brief Series (2).
- Hazir, C., and C. Autant-Bernard. 2014. “Determinants of Cross-Regional R&D Collaboration: Some Empirical Evidence from Europe in Biotechnology.” The Annals of Regional Science 53 (2): 369–393. doi:https://doi.org/10.1007/s00168-014-0606-4
- Heimeriks, G., D. Li, W. Lamers, I. Meijer, and A. Yegros. 2019. “Scientific Knowledge Production in European Regions: Patterns of Growth, Diversity and Complexity.” European Planning Studies 27 (11): 2123–2143. doi:https://doi.org/10.1080/09654313.2019.1645814
- Hoekman, J., K. Frenken, and F. Van Oort. 2009. “The Geography of Collaborative Knowledge Production in Europe.” The Annals of Regional Science 43 (3): 721–738. doi:https://doi.org/10.1007/s00168-008-0252-9
- Hoekman, J., K. Frenken, and R. J. Tijssen. 2010. “Research Collaboration at a Distance: Changing Spatial Patterns of Scientific Collaboration Within Europe.” Research Policy 39 (5): 662–673. doi:https://doi.org/10.1016/j.respol.2010.01.012
- Hoekman, J., T. Scherngell, K. Frenken, and R. Tijssen. 2013. “Acquisition of European Research Funds and its Effect on International Scientific Collaboration.” Journal of Economic Geography 13 (1): 23–52. doi:https://doi.org/10.1093/jeg/lbs011
- Jackson, M. 2008. Social and Economic Networks. Princeton, NJ: Princeton University Press.
- Jones, B. 2009. “The Burden of Knowledge and the “Death of the Renaissance Man”: Is Innovation Getting Harder?” The Review of Economic Studies 76 (1): 283–317. doi:https://doi.org/10.1111/j.1467-937X.2008.00531.x
- Juhász, S., and B. Lengyel. 2018. “Creation and Persistence of Ties in Cluster Knowledge Networks.” Journal of Economic Geography 18 (6): 1203–1226. doi:https://doi.org/10.1093/jeg/lbx039
- Jun, B., F. Pinheiro, T. Buchmann, S. Yi, and C. Hidalgo. 2017. “Meet me in the Middle: The Reunification of Germany’s Research Network.” arXiv Preprint arXiv (1704): 08426.
- Lambiotte, R., V. Blondel, C. De Kerchove, E. Huens, C. Prieur, Z. Smoreda, and P. Van Dooren. 2008. “Geographical Dispersal of Mobile Communication Networks.” Physica A: Statistical Mechanics and its Applications 387 (21): 5317–5325. doi:https://doi.org/10.1016/j.physa.2008.05.014
- Lengyel, B., and M. Leskó. 2016. “International Collaboration and Spatial Dynamics of US Patenting in Central and Eastern Europe 1981-2010.” PLOS One 11 (11): e0166034. doi:https://doi.org/10.1371/journal.pone.0166034
- Lengyel, B., A. Varga, B. Ságvári, Á Jakobi, and J. Kertész. 2015. “Geographies of an Online Social Network.” PLOS One 10 (9): e0137248. doi:https://doi.org/10.1371/journal.pone.0137248
- Leydesdorff, L. 2008. “On the Normalization and Visualization of Author co-Citation Data: Salton’s Cosine Versus the Jaccard Index.” Journal of the American Society for Information Science and Technology 59 (1): 77–85. doi:https://doi.org/10.1002/asi.20732
- Liben-Nowell, D., J. Novak, R. Kumar, P. Raghavan, and A. Tomkins. 2005. “Geographic Routing in Social Networks.” Proceedings of the National Academy of Sciences 102 (33): 11623–11628. doi:https://doi.org/10.1073/pnas.0503018102
- Maggioni, M., M. Nosvelli, and T. Uberti. 2007. “Space Versus Networks in the Geography of Innovation: A European Analysis.” Papers in Regional Science 86 (3): 471–493. doi:https://doi.org/10.1111/j.1435-5957.2007.00130.x
- Maggioni, M., and T. Uberti. 2009. “Knowledge Networks Across Europe: Which Distance Matters?” The Annals of Regional Science 43 (3): 691–720. doi:https://doi.org/10.1007/s00168-008-0254-7
- Maggioni, M., T. Uberti, and M. Nosvelli. 2014. “Does Intentional Mean Hierarchical? Knowledge Flows and Innovative Performance of European Regions.” The Annals of Regional Science 53 (2): 453–485. doi:https://doi.org/10.1007/s00168-014-0618-0
- Malerba, F. 2009. “Increase Learning, Break Knowledge Lock-ins and Foster Dynamic Complementarities: Evolutionary and System Perspectives on Technology Policy in Industrial Dynamics.” In The New Economics of Technology Policy, edited by D. Foray, 33–45. Cheltenham: Edward Elgar.
- Martin, R., and P. Sunley. 2007. “Complexity Thinking and Evolutionary Economic Geography.” Journal of Economic Geography 7 (5): 573–601. doi:https://doi.org/10.1093/jeg/lbm019
- Phelps, C. 2010. “A Longitudinal Study of the Influence of Alliance Network Structure and Composition on Firm Exploratory Innovation.” Academy of Management Journal 53 (4): 890–913. doi:https://doi.org/10.5465/amj.2010.52814627
- Newman, M. 2006. “Modularity and Community Structure in Networks.” Proceedings of the National Academy of Sciences 103 (23): 8577–8582. doi:https://doi.org/10.1073/pnas.0601602103
- Quaglio, G., S. Millar, M. Pazour, V. Albrecht, T. Vondrak, M. Kwiek, and K. Schuch. 2020. Exploring the Performance Gap in EU Framework Programmes Between EU13 and EU15 Member States. European Parliamentary Research Service, Scientific Foresight Unit (STOA), PE 641.542 – June 2020.
- Raffo, J., and S. Lhuillery. 2009. “How to Play the “Names Game”: Patent Retrieval Comparing Different Heuristics.” Research Policy 38 (10): 1617–1627. doi:https://doi.org/10.1016/j.respol.2009.08.001
- Ramlogan, R., and D. Consoli. 2014. “Dynamics of Collaborative Research Medicine: The Case of Glaucoma.” The Journal of Technology Transfer 39 (4): 544–566. doi:https://doi.org/10.1007/s10961-013-9300-4
- Reagans, R., and B. McEvily. 2003. “Network Structure and Knowledge Transfer: The Effects of Cohesion and Range.” Administrative Science Quarterly 48 (2): 240–267. doi:https://doi.org/10.2307/3556658
- Rodríguez-Pose, A. 2020. “The Research and Innovation Divide in the EU and its Economic Consequences.” In European Commission: Science, Research and Innovation Performance of the EU 2020. A Fair Green and Digital Europe. Brussels: European Commission, 676–707.
- Roediger-Schluga, T., and M. Barber. 2008. “R&D Collaboration Networks in the European Framework Programmes: Data Processing, Network Construction and Selected Results.” International Journal of Foresight and Innovation Policy 4 (3-4): 321–347. doi:https://doi.org/10.1504/IJFIP.2008.017583
- Sah, P., S. Leu, P. Cross, P. Hudson, and S. Bansal. 2017. “Unraveling the Disease Consequences and Mechanisms of Modular Structure in Animal Social Networks.” Proceedings of the National Academy of Sciences 114 (16): 4165–4170. doi:https://doi.org/10.1073/pnas.1613616114
- Scherngell, T., and M. Barber. 2009. “Spatial Interaction Modelling of Cross-Region RD Collaborations: Empirical Evidence from the 5th EU Framework Programme.” Papers in Regional Science 88 (3): 531–546. doi:https://doi.org/10.1111/j.1435-5957.2008.00215.x
- Scherngell, T., and R. Lata. 2013. “Towards an Integrated European Research Area? Findings from Eigenvector Spatially Filtered Spatial Interaction Models Using European Framework Programme Data.” Papers in Regional Science 92 (3): 555–577. doi:https://doi.org/10.1111/j.1435-5957.2012.00419.x
- Schoen, A., D. Heinisch, and G. Buenstorf. 2014. “Playing the Name Game to Identify Academic Patents in Germany.” Scientometrics 101 (1): 527–545. doi:https://doi.org/10.1007/s11192-014-1400-x
- Schütze, H., C. Manning, and P. Raghavan. 2008. Introduction to Information Retrieval. Vol. 39. New York, NY: Cambridge University Press.
- Seabright, M., D. Levinthal, and M. Fichman. 1992. “Role of Individual Attachments in the Dissolution of Interorganizational Relationships.” Academy of Management Journal 35 (1): 122–160. doi:https://doi.org/10.5465/256475
- Sebestyén, T., E. Braun, Z. Iloskics, and A. Varga. 2021. “Spatial and Institutional Dimensions of Research Collaboration: a Multidimensional Profiling of European Regions.” Regional Statistics 11 (2): 1–29. doi:https://doi.org/10.15196/RS110203
- Singh, J. 2005. “Collaborative Networks as Determinants of Knowledge Diffusion Patterns.” Management Science 51 (5): 756–770. doi:https://doi.org/10.1287/mnsc.1040.0349
- Sobolevsky, S., M. Szell, R. Campari, T. Couronné, Z. Smoreda, and C. Ratti. 2013. “Delineating Geographical Regions with Networks of Human Interactions in an Extensive set of Countries.” PLOS One 8 (12): e81707. doi:https://doi.org/10.1371/journal.pone.0081707
- Sorenson, O., J. Rivkin, and L. Fleming. 2006. “Complexity, Networks and Knowledge Flow.” Research Policy 35 (7): 994–1017. doi:https://doi.org/10.1016/j.respol.2006.05.002
- Ter Wal, A., and R. Boschma. 2009. “Applying Social Network Analysis in Economic Geography: Framing Some key Analytic Issues.” The Annals of Regional Science 43 (3): 739–756. doi:https://doi.org/10.1007/s00168-008-0258-3
- Ter Wal, A. 2013. “The Dynamics of the Inventor Network in German Biotechnology: Geographic Proximity Versus Triadic Closure.” Journal of Economic Geography 14 (3): 589–620. doi:https://doi.org/10.1093/jeg/lbs063
- Torre, A., and A. Rallet. 2005. “Proximity and Localization.” Regional Studies 39 (1): 47–59. doi:https://doi.org/10.1080/0034340052000320842
- Usai, S. 2011. “The Geography of Inventive Activity in OECD Regions.” Regional Studies 45 (6): 711–731. doi:https://doi.org/10.1080/00343401003792492
- Uzzi, B. 1997. “Social Structure and Competition in Interfirm Networks: The Paradox of Embeddedness.” Administrative Science Quarterly 42 (1): 35–67. doi:https://doi.org/10.2307/2393808
- Varga, A., D. Pontikakis, and G. Chorafakis. 2014. “Metropolitan Edison and Cosmopolitan Pasteur? Agglomeration and Interregional Research Network Effects on European R&D Productivity.” Journal of Economic Geography 14 (2): 229–263. doi:https://doi.org/10.1093/jeg/lbs041
- Wanzenböck, I., T. Scherngell, and T. Brenner. 2014. “Embeddedness of Regions in European Knowledge Networks: a Comparative Analysis of Inter-Regional R&D Collaborations, co-Patents and co-Publications.” The Annals of Regional Science 53 (2): 337–368. doi:https://doi.org/10.1007/s00168-013-0588-7
- Whittle, A., B. Lengyel, and D. Kogler. 2020. Understanding Regional Branching – Knowledge Diversification via Inventor Collaboration Networks. Papers in Evolutionary Economic Geography, No. 2006.
- Zollo, M., J. Reuer, and H. Singh. 2002. “Interorganizational Routines and Performance in Strategic Alliances.” Organization Science 13 (6): 701–713. doi:https://doi.org/10.1287/orsc.13.6.701.503